Alphabet drops 3.3% despite new AI features, but EMA golden cross points upward
 The stock opened this week on a weaker note
Alphabet Inc's stock is caught in a tight trading range this week after last week's bullish push above the previous monthly high lost strength.
The stock opened this week on a weaker note as bulls failed to build momentum beyond the prior week’s peak at $169.4. On the downside, however, selling pressure has been softened by the technical support of the 20 and 50 day EMAs, which are now aligned near the $163 support level.
• Alphabet shares lose steam after failed breakout above $169.4.
• Technical golden cross near $162.4 acts as short-term support.
• RSI stays bullish, signalling a decisive breakout above $169.4.
Tuesday’s price action was particularly bearish as the company unveiled several new artificial intelligence features during its developers' conference. While analysts welcomed the innovation as a sign of Alphabet’s strength in AI development, market participants appear uncertain about its long-term impact, particularly on the core search business. This divide between Wall Street optimism and market hesitation may explain the bearish price response to the announcement.
The stock opened at $166.45 and climbed to an intraday high of 168.5 before closing lower at $162.9, down 3.34% for Tuesday. This decline was halted at the 20 day EMA, which has so far served as a cushion against further losses. Importantly, a recent bullish crossover between the 20 and 50 day EMAs has now formed near $162.4. This golden cross is a technical signal that suggests broader upside pressure is still in play, even as short-term sentiment wavers.
Alphabet's price outlook hinges on holding golden cross support near $162.4
As of Wednesday morning, Alphabet shares are trading around $164.7 during premarket hours. This reflects a 1.9% decline for the week, but still holds a gain of nearly 3% for the month of May. Price action is now consolidating between the golden cross support around $162.4 and the previous week’s resistance at $169.4, creating a defined trading band.
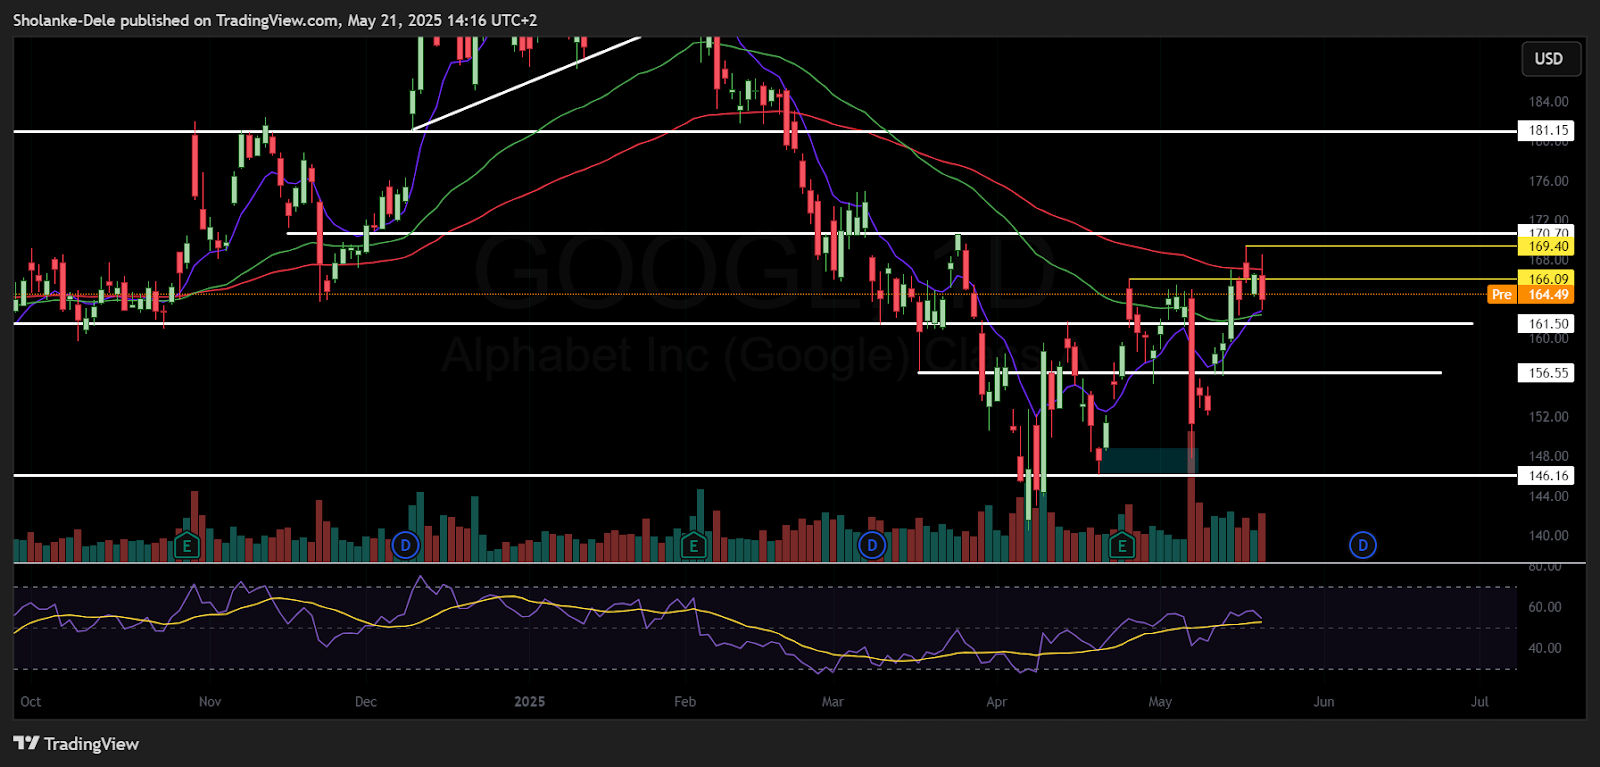
GOOGL stock price dynamic (Oct 2024 - May 2025)
From a momentum perspective, the RSI readings on both the daily and 4 hour charts have declined following Tuesday’s high-volume drop. However, RSI values still sit in bullish territory, indicating there is yet enough strength to support a potential recovery if buyers re-enter near support levels.
Going forward, traders will watch for a break above $166.1 to signal a potential retest of $169.4. A clear move above $169.4 could open the way toward the next resistance zone near $170.7. On the other hand, failure to hold the golden cross support at 162.4 may expose the stock to further losses toward the $161.5 support level.
Alphabet stock broke above key moving averages last week then pulled back after hitting resistance at $169.50. RSI and 50-day EMA held near $161.50 suggesting bullish control.


