Apple stock price slips below key support as momentum weakens and $200 level comes into focus
 Apple stock slips beneath key support levels, with momentum indicators pointing to further downside
Apple Inc. (AAPL) stock closed at $202.09 on May 21, marking a sharp intraday decline of 2.31%. The drop brought the price beneath multiple short-term moving averages, pushing AAPL into a vulnerable zone just above key psychological support near $200. After failing to reclaim the $210–$214 resistance range, the stock’s struggle to maintain upward momentum raises concerns for further weakness if key levels cannot hold.
Highlights
- Apple stock faces resistance near $210–$214, with a recent decline testing $200 support.
- Momentum indicators, including RSI and MACD, signal further downside risks in the near term.
- A daily close below $200 could open the door for a deeper decline toward $194.89.
The broader technical setup for AAPL shows significant pressure after failing to establish a bullish close above the 38.2% Fibonacci retracement level around $203.55. Price action is now testing the 23.6% level near $190.34, a key level to watch if the bearish momentum continues. Bollinger Bands have expanded on the 4-hour chart, signaling potential volatility, though the downward slope indicates that pressure from the bears is still intact.
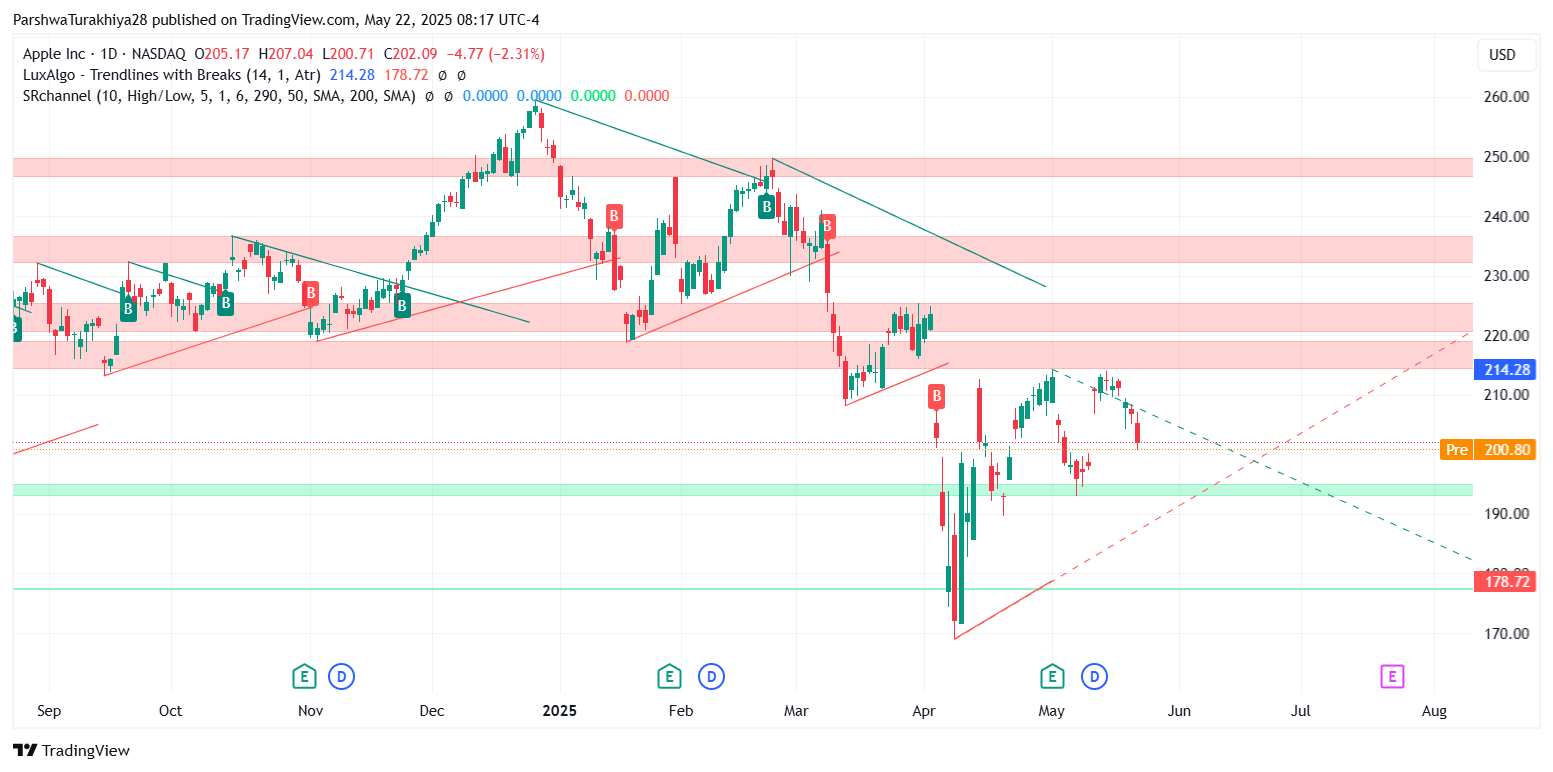
Apple stock price dynamics (September 2024 - May 2025) Source: TradingView.
Momentum indicators flash weakness on lower timeframes
On the 30-minute chart, RSI has dropped to 33.86, signaling oversold conditions, though the broader daily RSI is still trending downward without clear signs of divergence recovery. The MACD remains in a bearish crossover, with both the MACD line and signal line trending downward. These momentum indicators suggest that despite the potential for a short-term bounce, the overall market sentiment remains bearish.
The price is also slipping below the 20/50 EMA cluster, with immediate resistance at $206.70 and multiple EMAs stacked overhead. A daily close below $200 would indicate that further downside risk remains, with key support at $194.89 and $190.34. If the $200 level fails to hold, the next major support target lies at $194.89, followed by $190.34.
Short-term outlook for May 22–23
For May 22, Apple’s immediate focus is whether it can hold above the $200 psychological support level and the 200 EMA at $200.77. If price bounces from this zone, a retest of $204.80 and $207.20 could be in play. However, sustained weakness below $200 would expose the stock to further downside pressure toward $194.89 and possibly $190.34. Traders should monitor the $200 level closely to gauge the stock’s near-term direction.
As mentioned previously, Apple’s stock has struggled to maintain bullish momentum after failing to reclaim the $210–$214 resistance range. The technical outlook remains bearish, with a breakdown below $200 likely to lead to further declines toward $194.89 and $190.34


