Moodeng price market structure shift on 4-hour chart hints at possible bullish continuation
 Moodeng is trading predominantly sideways over the past three days
Moodeng price has closely mirrored the recent price action exhibited by Bitcoin, the leading digital asset. Following Bitcoin's notable pullback that formed a significant supply area, Moodeng similarly retraced.
This synchronized move highlights the correlation between Moodeng and broader cryptocurrency market dynamics.
- Moodeng trades sideways near $0.26 as Monday’s structure shift sets bullish tone
- Price supported by bullish EMA alignment and strong demand zone near $0.225
- Break above $0.2833 could open path toward $0.334 in coming sessions
The retracement in Moodeng's price encountered a notable daily demand zone, effectively halting further declines and initiating multiple recovery attempts since the weekend. However, despite these recovery initiatives, Moodeng has displayed limited progress, trading predominantly sideways over the past three days.
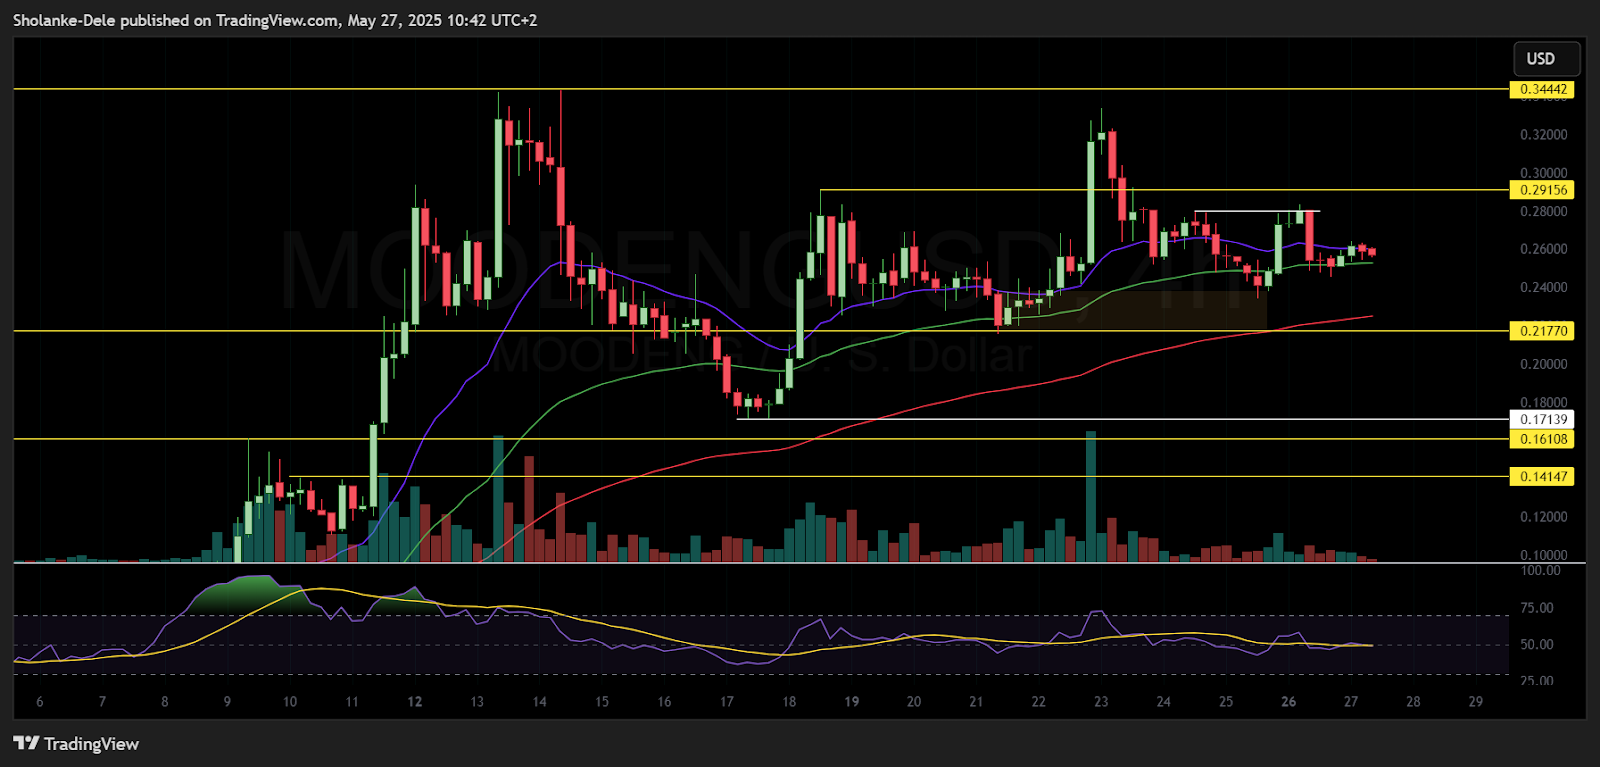
Moodeng price dynamics (April - May 2025). Source: TradingView
On Monday, the cryptocurrency briefly exhibited signs of recovery, only to see these gains swiftly reversed, resulting in a predominantly bearish trading session. Nonetheless, closer examination of the 4-hour chart provides an encouraging perspective. The brief bullish momentum observed on Monday led to a bullish shift in market structure, suggesting the subsequent downward move might represent a temporary retracement rather than the onset of a sustained bearish trend.
Moodeng uptrend remains healthy as 100 EMA and demand zone provide support
Trading activity today, Tuesday, has been characterized by an unusual absence of volatility, a condition persisting since the Asian market session. Currently, Moodeng trades near $0.2600 in today's European session, barely deviating from today’s opening price level. This low volatility points towards market indecision, confirmed by the 4-hour Relative Strength Index (RSI) which remains firmly neutral.
Technical indicators present an optimistic outlook. The 20-period, 50-period, and 100-period exponential moving averages (EMAs) on the 4-hour timeframe exhibit a clear bullish alignment. Significantly, the 50-period EMA positioned around $0.2536 offers immediate support, reflecting a robust short-term bullish sentiment among market participants.
Considering the recent bullish break in market structure, near-term price targets for Moodeng lean upward. Immediate resistance levels include Monday’s intraday high at $0.2833, followed by the slightly higher resistance at $0.2915. Successfully surpassing these levels could potentially accelerate bullish momentum, opening the path toward last week's high near $0.334.
Should bearish pressures intensify, technical support is robustly anchored by the 100-period EMA at $0.225, coinciding effectively within the established daily and 4-hour demand zone. This area may significantly limit further downside, protecting the cryptocurrency from declining towards the lower support threshold at $0.2177.
Moodeng bounced and broke above recent highs showing renewed buyer strength. Bullish RSI and EMA structure supported the push toward triangle resistance for a breakout attempt.


