Apple stock price shows vulnerability ahead of May 28 with support at $195 in focus
 Apple stock faces downward pressure ahead of May 28, with $195 support and potential downside targets at $190
Apple Inc. (AAPL) stock is showing signs of weakness heading into May 28, with the price consolidating just above the critical $195 support zone. The recent breakdown from a short-term rising wedge pattern and rejection from the $202–$203 range indicates that sellers have gained control in the short term.
Highlights
- Apple stock consolidates above $195 after rejecting resistance near $202–$203.
- Momentum remains negative, with multiple bearish indicators on intraday charts.
- Key support levels are at $194–$196, with a potential downside target near $190.
Despite brief periods of oversold conditions, momentum remains negative, and the price could face further downside pressure if the $195 level fails to hold.
Bearish indicators point to further downside risks
On the 30-minute and 4-hour charts, Apple has broken below recent swing lows and is struggling to reclaim upward momentum. The Bollinger Bands have started to compress, with the price hugging the lower band, signaling continued downside pressure. Momentum indicators, such as the RSI and MACD, further support the bearish outlook. The RSI is in oversold territory on both the 30-minute and 4-hour charts, but without bullish divergence on the MACD, downside risks remain elevated.
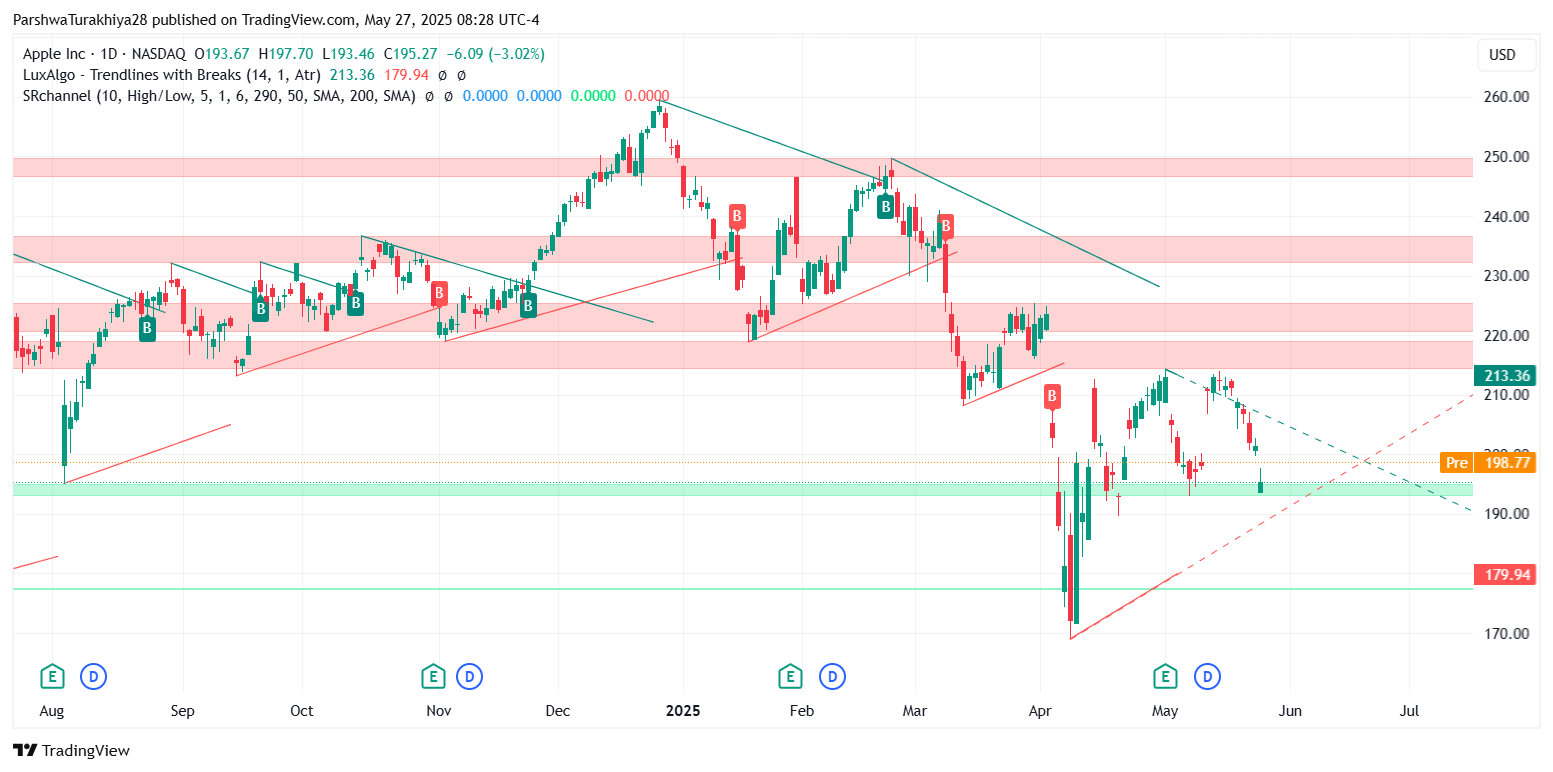
Apple stock price dynamics (Source: TradingView)
The Ichimoku Cloud also reflects weakening momentum, with price trading well below the cloud. Both the Tenkan-sen and Kijun-sen lines have flattened, reinforcing the idea of stalling price action. Resistance remains near $198.8, and a break above $200.97 would likely be required to negate the current bearish structure.
Critical support at $194 and the outlook for the next move
On the daily chart, Apple stock has broken below the 50-day EMA and is trading under a descending triangle pattern. The current price action has brought the stock into a critical support zone between $194 and $196, which coincides with the 0.236 Fibonacci retracement level from the $168.99–$259.47 range. A daily close below $194 would confirm the bearish continuation, with potential downside targets at $190.3 and $179.9. However, if the stock can defend this support zone, a short-term bounce could bring price back toward the $198–$202 resistance zone.
As previously analyzed Apple stock remains vulnerable to further downside if the $194 support fails. Momentum indicators are aligned with a bearish outlook, and a sustained break below $194 could set the stage for a deeper pullback. Traders will be looking for any signs of reversal, with a daily close above $202.75 being key to invalidating the current downtrend.


