Intel stock price shows short-term strength but remains capped by resistance
 Intel stock consolidates at $20.57, testing key resistance at $21.20–$21.55
Intel Inc. (INTC) stock is trading around $20.57, showing signs of consolidation after rebounding from the $20.00 support zone. This support region coincides with a previously tested demand zone that helped drive price action higher in early May.
Highlights
- Intel stock consolidates near $20.57 after a rebound from $20.00.
- Price faces resistance at $21.20–$21.55, with a broader bearish structure in play.
- A break above $21.55 would signal a shift toward bullish momentum.
However, the stock continues to face significant resistance around the $21.20 and $21.55 levels, which are marked by prior supply zones and the confluence of the 100 and 200-period EMAs on the 4-hour chart. The broader structure reflects a series of lower highs, suggesting that sellers still maintain control of the medium-term direction.
Resistance levels keep pressure on price action
On the weekly chart, the price is currently testing the 61.8% Fibonacci retracement level at $21.96, which has acted as a firm resistance ceiling in recent attempts. This level remains critical, as failure to break it decisively has contributed to the bearish momentum seen on the daily chart, where the price has consistently respected a descending trendline from the March peak near $28. The Ichimoku Cloud also reinforces this bearish outlook, with the red cloud hovering above the current price action. A close above $21.55–$22.00, accompanied by volume support, would be needed to reverse this trend.
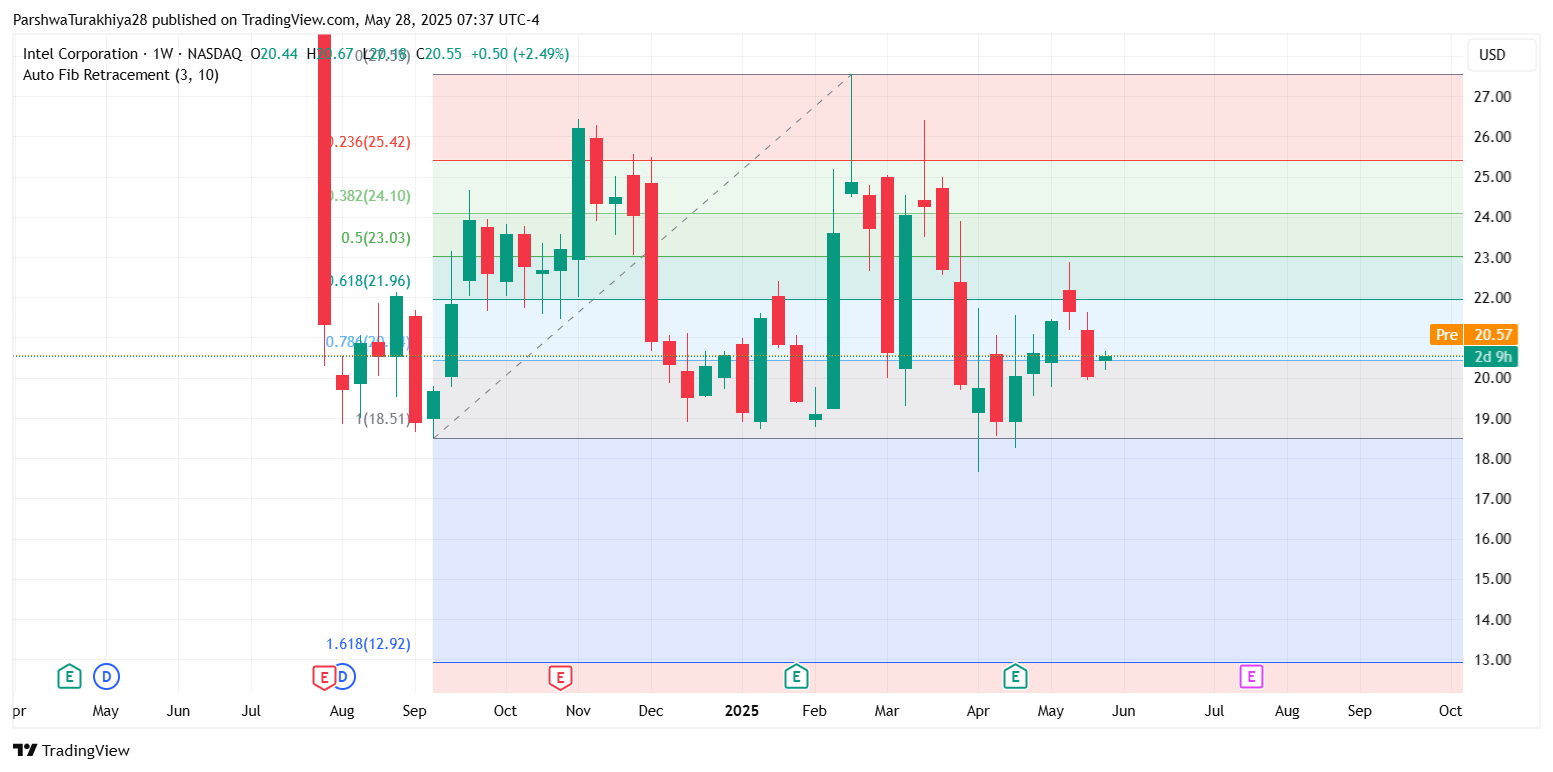
Intel stock price dynamics (Source: TradingView)
The 30-minute chart reveals mild bullish signals, as the RSI has climbed toward the 55–60 range, suggesting growing bullish interest. Meanwhile, the MACD histogram has flipped positive with the MACD line crossing above the signal line, reflecting a short-term shift in momentum. However, these indicators lack substantial divergence, meaning the rally is not yet confirmed. The Stochastic RSI remains in overbought territory, signaling that a pullback or sideways movement may be on the horizon before a potential rally.
Key support and potential downside risks
Intel remains within a broad symmetrical triangle pattern on the daily chart. Unless the stock can break above the $22.00–$22.71 zone, the risk of another leg down remains significant. Support at $20.00 remains critical for the bulls, with a potential downside target of $19.00 if the support fails. The key resistance levels at $21.20 and $21.55 must be cleared for the bulls to gain control and push the stock toward the next resistance at $22.00–$22.71.
In conclusion, Intel stock is showing signs of short-term strength, but the broader technical outlook remains cautious. A break above $21.55 could indicate a shift toward bullish momentum, while failure to hold $20.00 could trigger further downside risk.
As noted in previous analyses, Intel stock remains within a broader consolidation phase. While recent price action suggests short-term strength, resistance at $21.20–$21.55 remains a significant barrier. A decisive break above these levels would pave the way for further gains, while failure to hold $20.00 support could open the door for downside risks.


