Apple stock consolidates within symmetrical triangle, poised for breakout
 Apple stock consolidates, trading at $200.42, with breakout potential above $212
Apple Inc. (AAPL) is currently trading at $200.42, navigating within a well-defined symmetrical triangle pattern across both the daily and 4-hour timeframes. The stock price is compressing between a downward-sloping resistance from the March 2025 highs and an upward-sloping support originating from the April low near $171.
Highlights
- Apple stock consolidates in a symmetrical triangle, trading at $200.42.
- Immediate resistance at $212, with support around $195–$197.
- A breakout above $212 could target $224.91, with $240 as the next upside target.
This triangle formation typically signals coiling volatility, often followed by a breakout. Price action remains capped below the $212–$215 resistance range, which has acted as a strong supply zone since mid-April.
Resistance and support levels indicate breakout potential
On the daily chart, Apple remains under the control of the broader descending channel, despite recent bullish attempts to challenge the upper boundary. A rejection from the $212 zone and subsequent pullback to the $195–$197 demand area highlights the strength of that support.
A sustained daily close above $212.50 would confirm a breakout, potentially targeting the Fibonacci 0.618 retracement level near $224.91 and possibly $240. On the downside, failure to hold $197 could expose the lower triangle trendline near $190, with further downside risk toward the 0.236 Fibonacci level at $190.34.
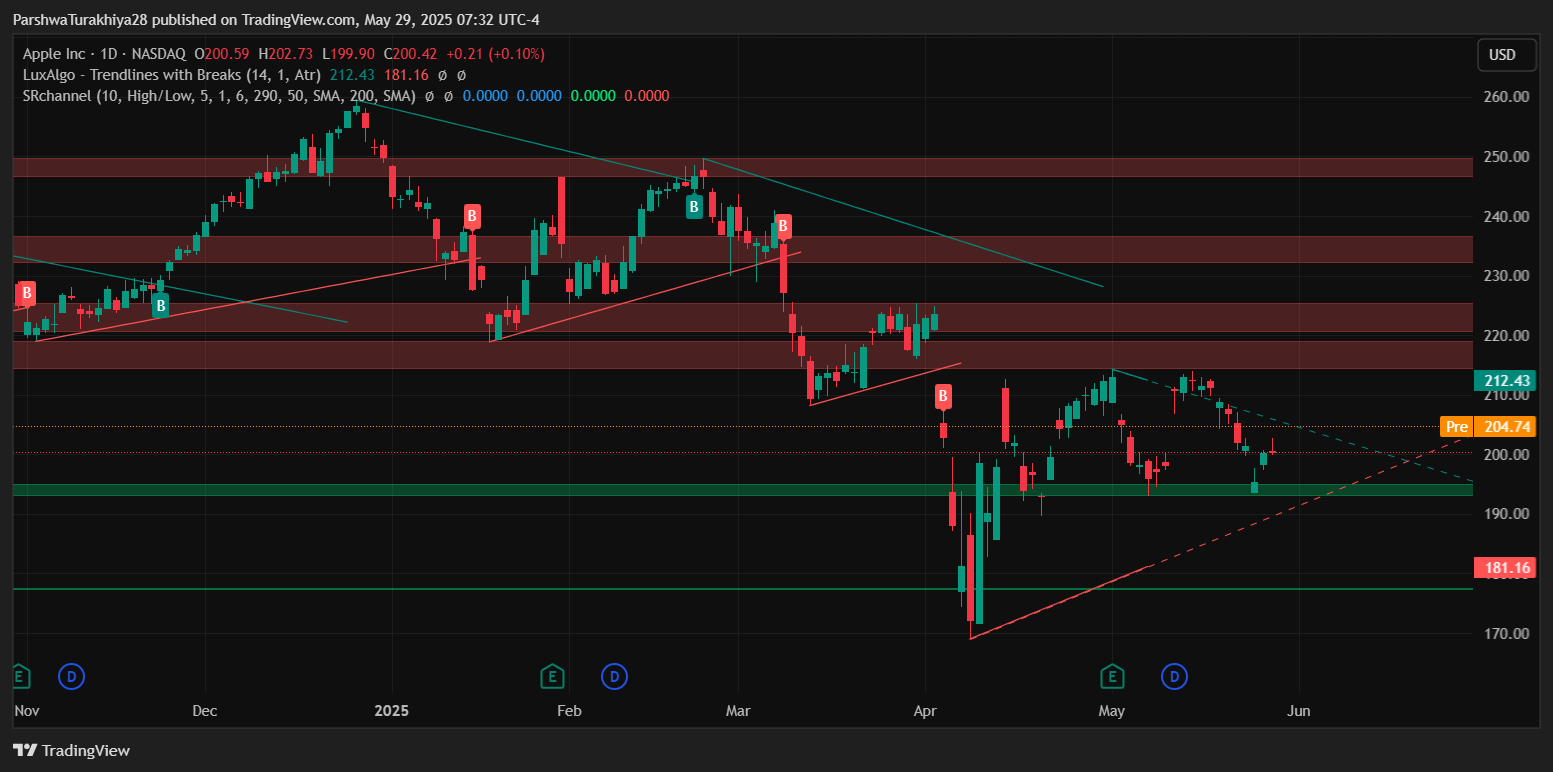
Apple stock price dynamics (Source: TradingView)
The 30-minute and 4-hour charts show consolidation just below the $212 resistance level. The MACD histogram has turned slightly positive, and the MACD line is attempting a bullish crossover, signaling early-stage recovery. The RSI, at 51, indicates neutral conditions, suggesting there is room for further upside if momentum picks up. However, the Stochastic RSI shows short-term pullback from overbought levels, hinting at minor intraday weakness unless momentum reaccelerates.
Bollinger Bands and Ichimoku Cloud highlight breakout potential
Bollinger Bands on the 4-hour chart are starting to widen after a phase of compression, with price testing the middle band at $202. A break above this midline, confirmed by volume, could initiate a move towards the upper band at $208.23. The Ichimoku Cloud remains mixed, with price interacting with the cloud base and Senkou Span A flat-lining near $200.85. A clear move above the cloud would validate a bullish bias, while failure to sustain above $198 could reinforce bearish control.
Apple stock is at a technical inflection point. Traders should closely monitor the $212 resistance and the $195–$197 support zone. A breakout above $212 would confirm a continuation of the bullish trend toward $224.91, while failure to break through this resistance could lead to further consolidation or a pullback toward $190.
As previously noted, Apple stock remains trapped within a descending channel but is showing signs of a potential breakout if it can overcome the $212 resistance. A clean move above $212 would suggest bullish continuation, while failure to hold support at $197 could expose the stock to further downside risks.


