Gold price prediction: XAU/USD breakout of consolidation amid geopolitical tensions
 Gold price hits $2,670, fueled by geopolitical tensions and central bank purchases
Gold prices (XAU/USD) continue their upward trajectory, trading at $2,670 during the Asian session on Tuesday after breaking out of a symmetrical triangle pattern and reclaiming the 200 EMA on the 4-hour chart.
The precious metal’s rally is fueled by heightened geopolitical tensions, renewed central bank purchases, and a weaker U.S. dollar environment pointing to potential for further upside.
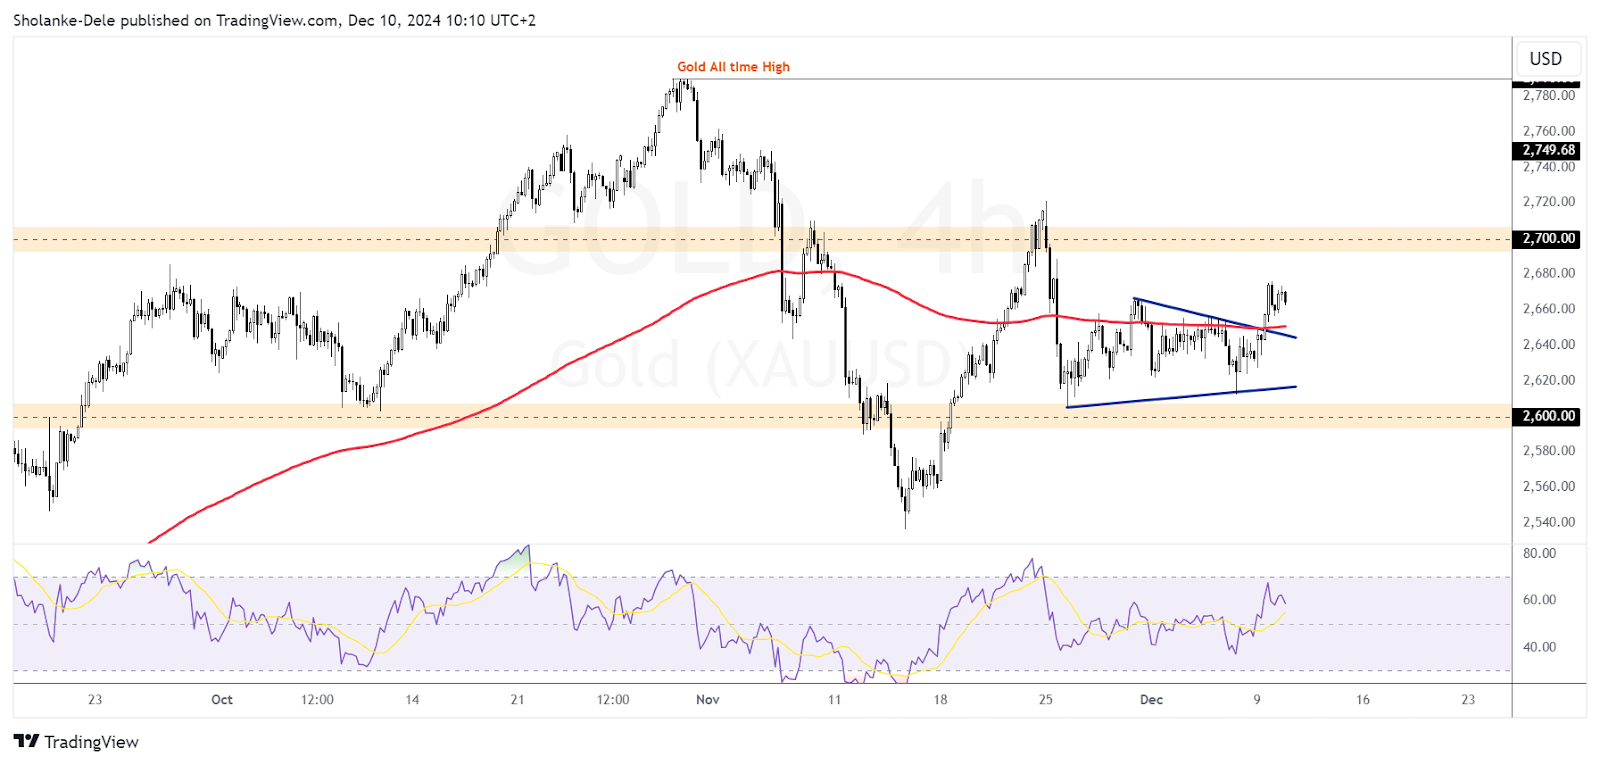
Gold price dynamics (September-December 2024). Source: TradingView.
Escalating geopolitical risks, including the worsening Russia-Ukraine war, political instability in South Korea and France, and uncertainty in the Middle East following the fall of Syria’s Bashar al-Assad regime, have spurred safe-haven demand. Adding to this, China’s central bank resumed gold purchases for the first time in seven months, increasing its reserves by 160,000 ounces in November to 72.96 million ounces. This notable move has reinforced expectations of sustained demand for gold.
The interest rate market also supports gold’s bullish outlook
The 10-year US Treasury yields ticked higher on Monday but remained subdued after losing 20 basis points over the last two weeks. This, coupled with speculation that the Federal Reserve might lower interest rates soon, has kept US Dollar bulls on the defensive. Concerns over President-elect Donald Trump’s tariff policies further weigh on the greenback, enhancing the appeal of the non-yielding precious metal.
Gold price outlook: Breakout above $2,650 signals further upside potentialOn the technical front, gold's breakout above the 200 EMA at $2,650 now positions this level as immediate support. Near-term resistance is observed at $2,700, which previously capped gains in November. The Relative Strength Index (RSI) remains above 50, indicating bullish momentum. While the Federal Reserve’s stance may limit gains, the path of least resistance for gold appears upward. Therefore, a decisive break above $2,700 could set the stage for further gains, while a pullback below $2,650 would bring renewed focus to the 200 EMA as a critical support zone.
Gold price has consolidated in a symmetrical triangle for over two weeks since November 26. The 100 and 200-day exponential moving averages (EMA) are limiting upward movement.


