Shiba Inu faces bearish momentum despite rising market interest
 Shiba Inu struggles near key support, signals potential reversal.
Shiba Inu (SHIB), currently ranked #13 by market capitalization, trades at $0.00002732, reflecting a slight recovery of +0.48% in the last 24 hours. Despite Bitcoin’s strong performance, SHIB has struggled to maintain upward momentum, hovering near critical support levels.
Long-tailed candlesticks on SHIB's 7-day chart suggest potential for a bullish reversal, though traders remain cautious. A decisive breakout above key resistance at $0.0000283 may pave the way toward recovery.
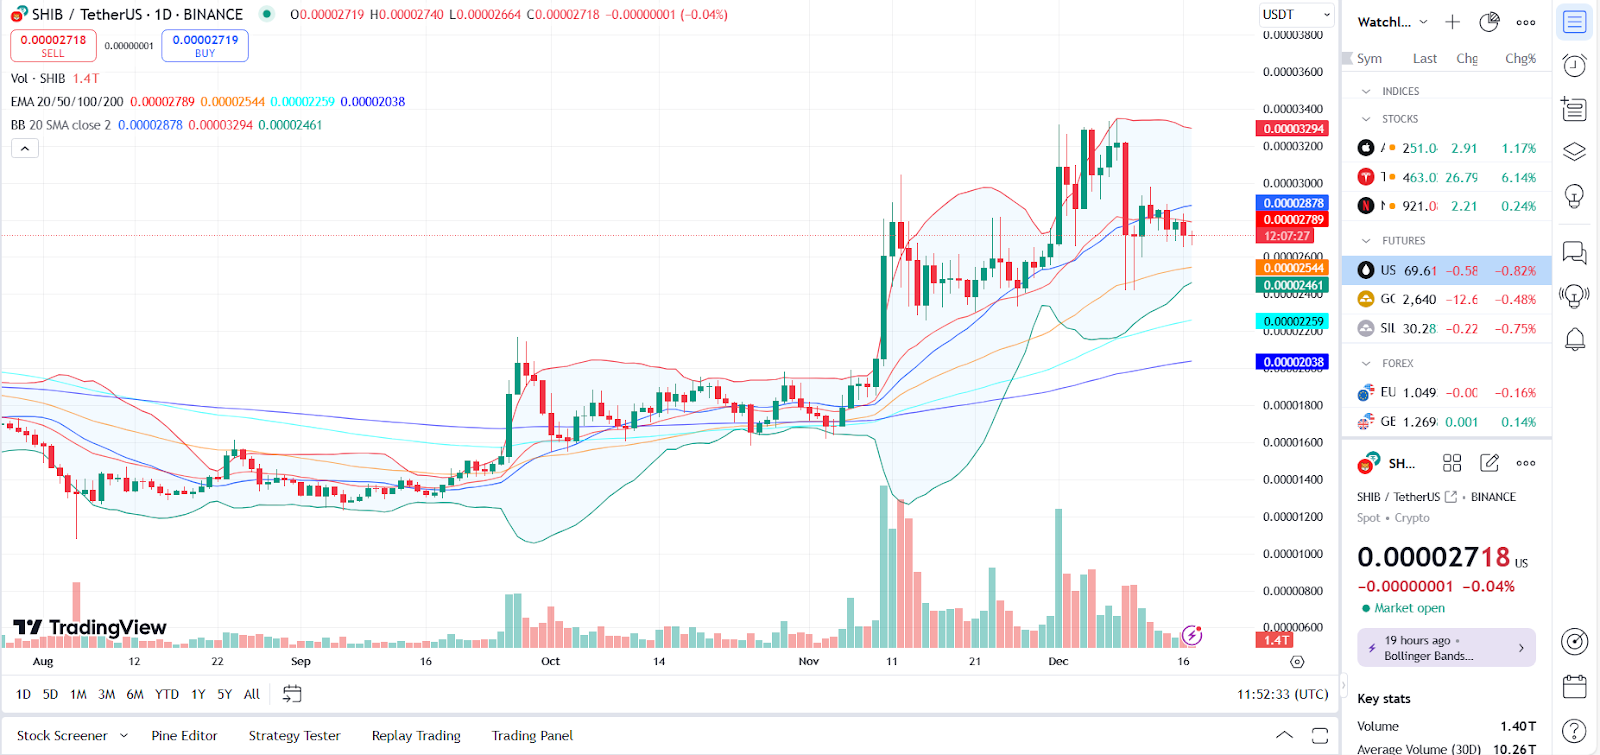
Shiba Inu chart (Aug 2024 - Dec 2024) Source: Trading View
Technical Indicators signal key levels
Bollinger Bands analysis shows SHIB trading below its 20-day EMA at $0.00002790, indicating persistent bearish sentiment. The lower Bollinger Band sits at $0.00002463, highlighting a key support zone. If prices drop toward this level, further downside may occur, testing the next support at $0.00002259.
To confirm a bullish reversal, SHIB needs to sustain a breakout above the 50-day EMA at $0.00002545 and reclaim the moving average. The upper Bollinger Band resistance stands at $0.00003294, with a potential 20% upward move required to challenge this level.
Telegram’s recent innovations, including its gift feature linked to TON-based NFTs, may indirectly boost sentiment across the crypto space. Rising investor interest in decentralized finance (DeFi) projects could further stabilize SHIB’s price trajectory.
To counter ongoing bearish pressures, SHIB must break above its critical resistance levels. Broader market dynamics, including Bitcoin’s performance and evolving investor sentiment, will be decisive. If current market conditions persist, SHIB risks extending its downtrend, though recovery potential remains intact if positive momentum returns.
Previously, we discussed SHIB's rising channel pattern and its need to reclaim the $0.00002860 resistance to reverse bearish sentiment.


