Natural gas price rallies above key resistance as demand surges
 Natural gas prices rally above $3.60 resistance with bullish momentum
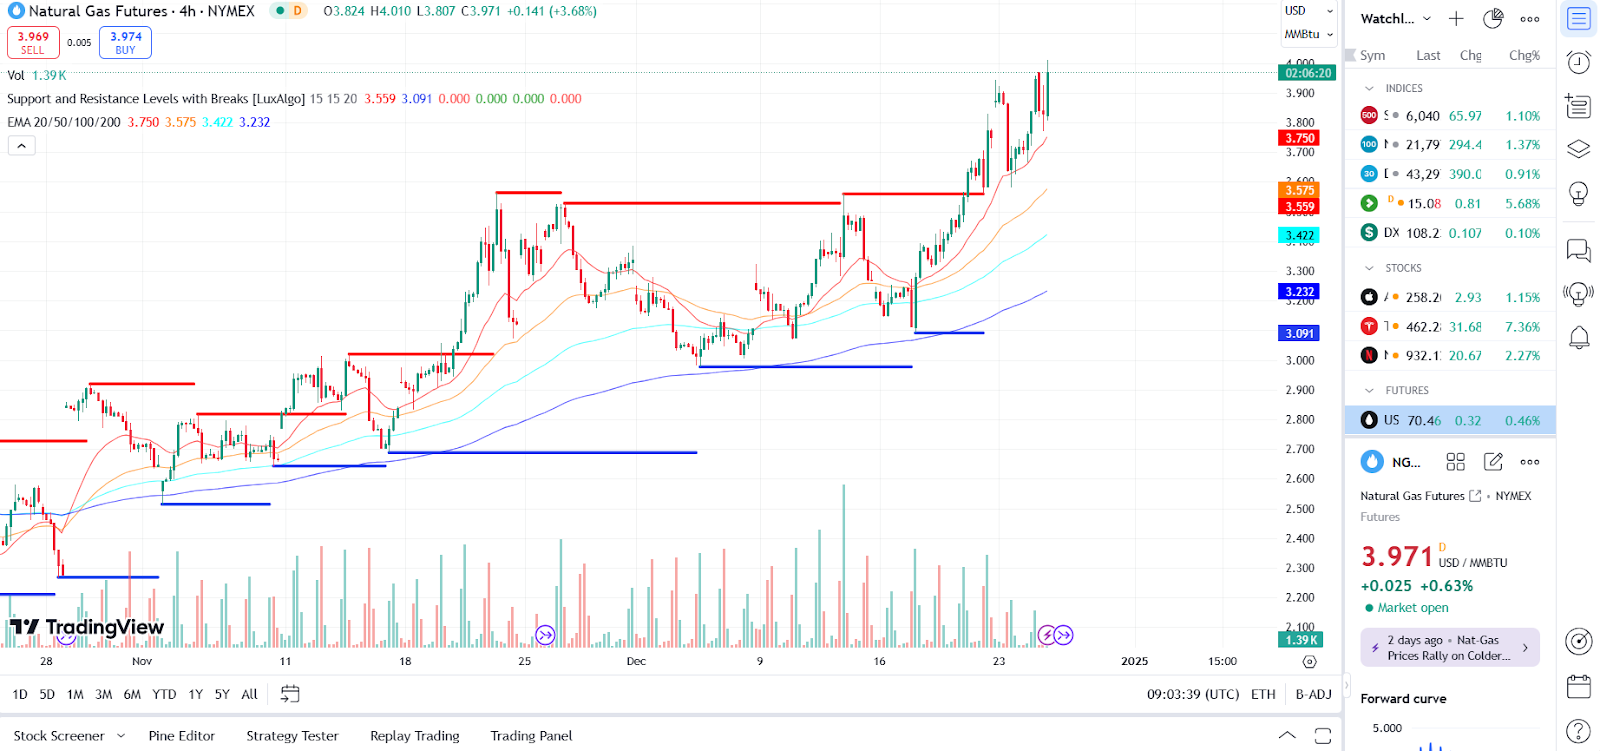
Natural gas prices are trending upward with strong bullish momentum, as indicated by the ascending channel visible on the 4-hour chart. The price recently broke above the $3.60 resistance level and is consolidating near the $4.00 mark, which serves as a critical psychological resistance.
After breaking a key resistance level, natural gas has demonstrated strong upward momentum, supported by a breakout from a cup-and-handle pattern between $3 and $3.60. This movement has pushed prices higher, with analysts pointing to continued gains if this trend persists.
Immediate support levels are seen at $3.57 and $3.42, corresponding to the 50-day and 200-day exponential moving averages (EMAs), respectively.
Natural gas price dynamics (Oct 2024 - Dec 2024) Source: TradingView.
Short-term outlook and technical risks
The moving averages display a clear bullish alignment, with prices trading above the 20-day, 50-day, and 100-day EMAs, signaling sustained upward momentum. The current consolidation near the channel's upper resistance suggests potential for a breakout above $4.00, which could lead to further gains. However, a short-term pullback to the $3.60–$3.70 range cannot be ruled out, providing a potential buying opportunity for traders.
Volume patterns also indicate strong participation, with increasing buying interest supporting the price rally. If natural gas sustains above $4.00, the next key resistance levels to watch are $4.10 and $4.24. Conversely, a break below $3.57 may challenge the bullish trend, bringing the $3.42 support level into focus.
In our previous discussion, we analyzed natural gas prices driven by cold weather and supply concerns, with bullish technical setups like the breakout from $3.60 supporting the ongoing uptrend.


