GBP/USD price hovers near key resistance as traders eye short-term breakout
 GBP/USD holds near resistance as price tests descending trendline
The GBP/USD pair maintained its position near 1.2480 during Wednesday’s Asian session after registering losses in the previous session. Despite holding above the upper boundary of the descending channel pattern, the pair faces headwinds due to sustained bearish momentum indicated by technical signals.
Market participants remain cautious ahead of key U.S. economic releases later this week, including the ISM Services PMI and Federal Reserve meeting minutes. These events could provide crucial insights into future monetary policy and U.S. dollar movements, influencing GBP/USD dynamics.
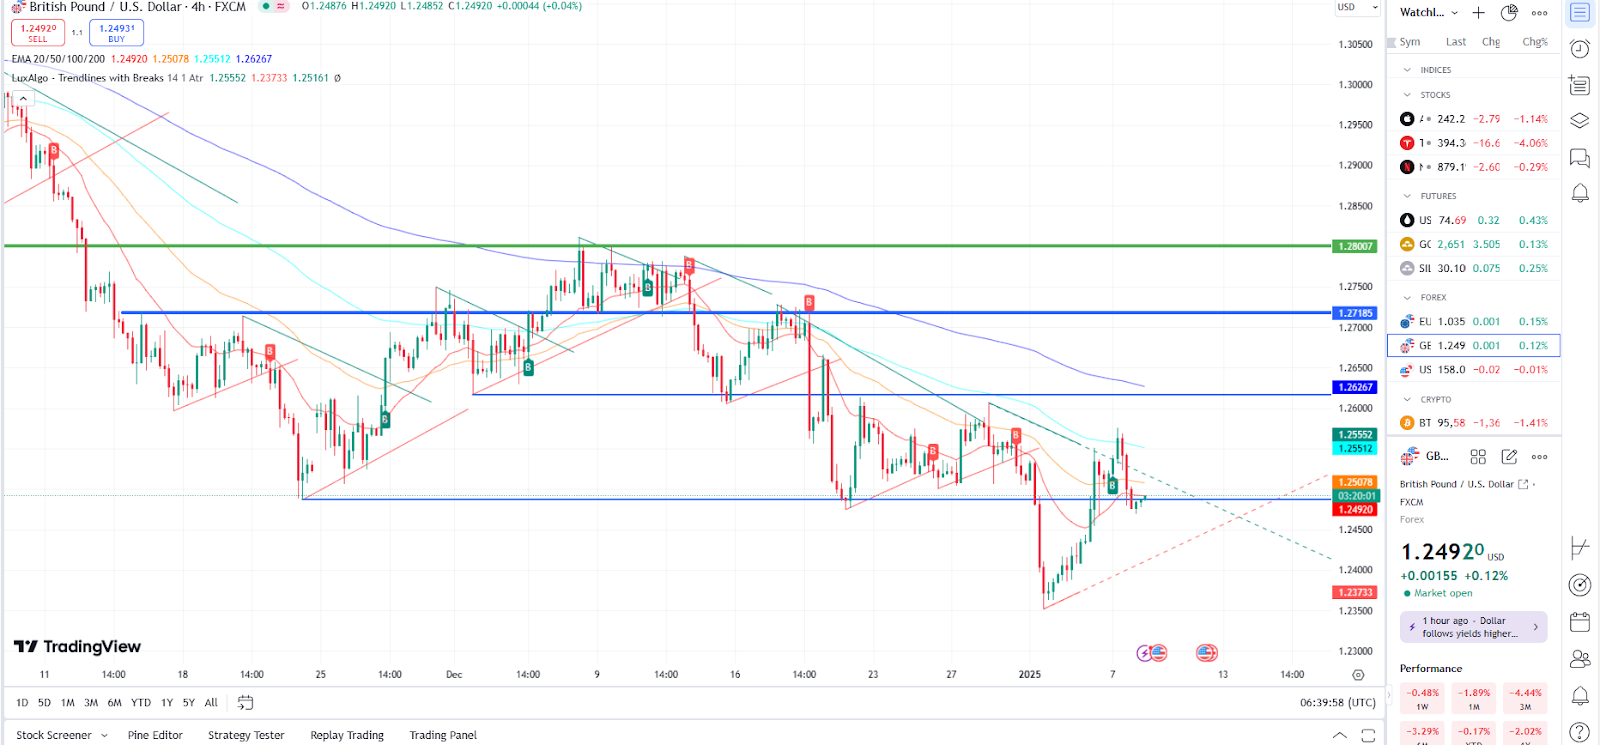
GBP/USD price movement (Nov 2024 - Jan 2025) Source: TradingView.
Technical overview: EMA and RSI levels in focus
The 14-day Relative Strength Index (RSI) remains below the 50 threshold, reflecting ongoing bearish sentiment. Additionally, GBP/USD trades below both the nine-day and 14-day Exponential Moving Averages (EMAs), which sit at 1.2494 and 1.2516, respectively. A decisive breakout above these EMA levels could shift short-term market sentiment toward a bullish trend, potentially propelling the pair to retest its December high of 1.2811.
Conversely, should the pair fail to break above the EMAs, it may re-enter the descending channel and test the critical 1.2352 support, its nine-month low recorded earlier in January. The next significant support level lies at 1.2299, last seen in April 2023, reinforcing bearish risks.
The GBP/USD 4-hour chart shows the pair consolidating near the key resistance level of 1.2500, with price action fluctuating close to the descending trendline. The moving averages suggest mixed momentum—while the 20 EMA and 50 EMA hover around the 1.2490–1.2510 region, acting as immediate resistance, the broader trend remains bearish, indicated by the position of the 200 EMA well above current levels. Key support rests near 1.2373, coinciding with the lower boundary of the range. A breakout above 1.2550 could open the path to 1.2718, while a failure to hold current levels may push the pair back toward 1.2370, reinforcing the bearish bias within the descending channel.
In our previous analysis, we highlighted the importance of the 1.2500 resistance level and its role in capping gains. The current consolidation near this zone underscores traders' focus on breaking this barrier to resume upward momentum or facing further losses toward multi-month lows.


