GBP/USD price faces resistance as bearish momentum persists
 GBP/USD struggles below 1.225, facing bearish momentum and key resistance levels
The GBP/USD pair continues to face selling pressure, trading near 1.223 during Friday’s Asian session. Technical analysis highlights a sustained bearish bias, with the pair confined within a descending channel on the daily chart.
The 14-day Relative Strength Index (RSI) hovers slightly above 30, signaling strong bearish momentum. Adding to this downward trend, the pair is trading below the nine- and 14-day Exponential Moving Averages (EMAs), reinforcing the likelihood of further declines.
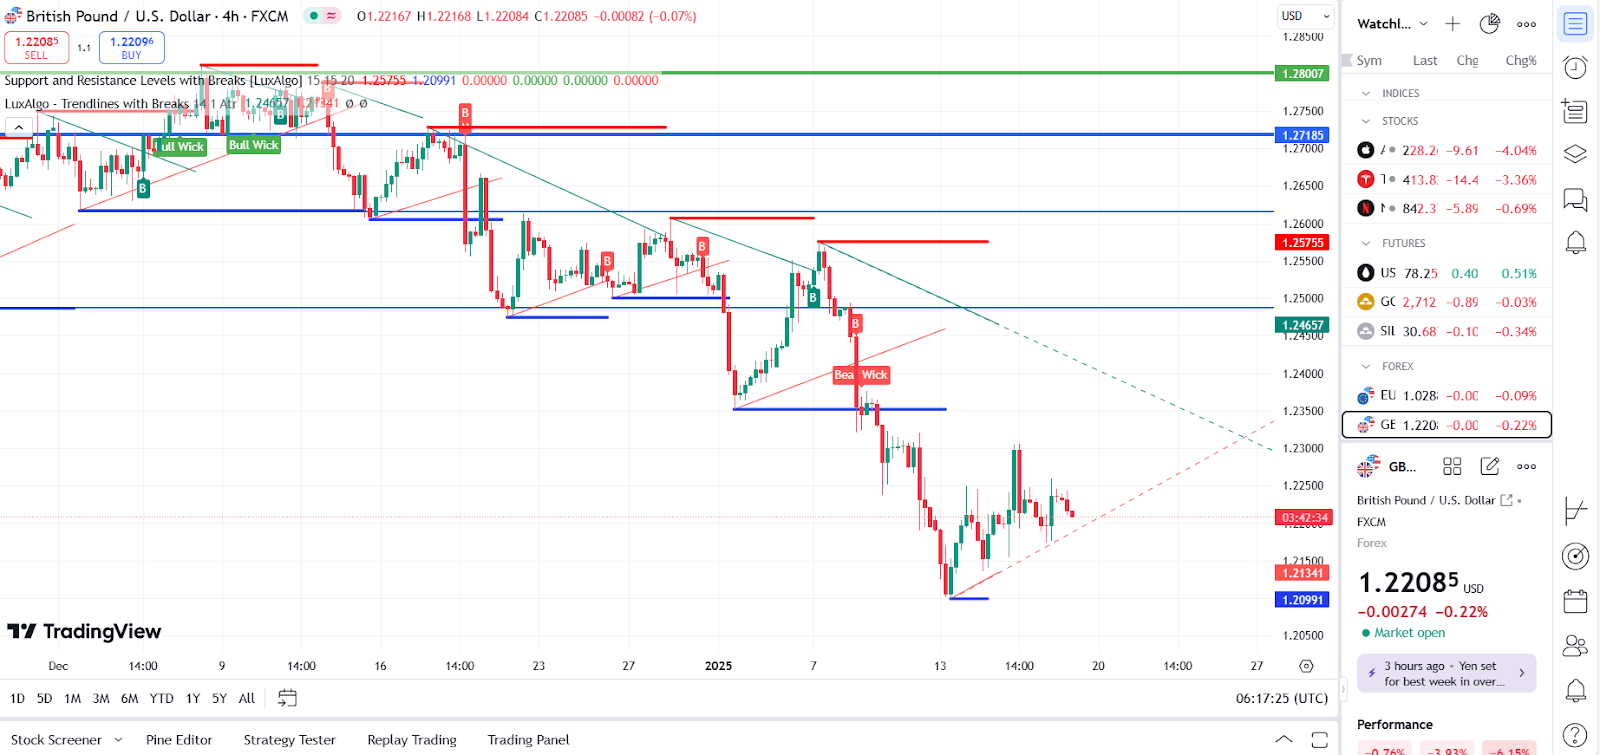
GBP/USD price movement (Dec 2024 - Jan 2025) Source: TradingView.
Key support and resistance levels identified
On the downside, immediate support for GBP/USD lies at the psychological level of 1.21, closely aligned with the 14-month low of 1.2099 reached on January 13. A decisive break below this level could intensify bearish sentiment, opening the door for further declines toward the lower boundary of the descending channel near 1.195.
On the upside, the pair faces immediate resistance at the nine-day EMA at 1.2278, followed by the 14-day EMA at 1.2328. A sustained breakout above these levels could shift short-term momentum, enabling a potential recovery toward the channel’s upper boundary near 1.25.
Outlook and potential price movement
With technical indicators signaling a bearish outlook, GBP/USD is likely to remain under pressure unless it achieves a breakout above key resistance levels. Traders should monitor upcoming U.K. retail sales data and global risk sentiment for further clues on the pair’s trajectory.
Previously, GBP/USD showed signs of stabilization near 1.22 amid weak U.K. economic data and growing dovish expectations for the Bank of England. These challenges persist, shaping the pair’s trajectory as market participants assess ongoing economic and monetary policy trends.