Best Time Frames For Profitable Swing Trading


Editorial Note: While we adhere to strict Editorial Integrity, this post may contain references to products from our partners. Here's an explanation for How We Make Money. None of the data and information on this webpage constitutes investment advice according to our Disclaimer.
The optimal time frames for swing trading are daily (D1) and 4-hour (H4) charts. Daily charts provide reliable signals and reduce the impact of market noise, allowing traders to make informed decisions. 4-hour charts offer a balance between trading frequency and signal quality, making them popular among swing traders.
Swing trading involves opening positions in the direction of the trend after a correction has concluded. Trends are characterized by local drawdowns of varying depths, and it is expected that once the correction ends, the price will either return to its previous high or establish a new maximum. The movement continues until a significant trend reversal occurs due to a deeper correction. This strategy's success heavily depends on the choice of timeframe, as trends on higher timeframes tend to be more stable but harder to identify. Conversely, lower timeframes offer smaller profit margins per trade due to the limited amplitude of price movements.
This review examines the impact of timeframes on swing trading effectiveness, categorizing swing trading strategies based on timeframes, and identifying the optimal timeframes for successful implementation. Practical examples illustrate how this strategy can be applied across various timeframes to achieve consistent results.
Best time frames for swing trading
Swing trading is effective on any timeframe, but each of them has its own approaches. Short-term timeframes require quick decisions, and on long-term ones, you can combine swing trading with positional trading. Below are the main timeframes with their advantages and disadvantages.
15-30 minutes
The M1 timeframe is not suitable for swing trading due to its unpredictability. On M5-M15, there is little time to make decisions, which often leads to mistakes, especially for beginners who either misinterpret signals or miss entry points. However, M15-M30 has its advantages: corrections usually last 1-2 hours, which allows you to quickly evaluate the result of open positions. A popular strategy is to determine the trend on H4-D1 (for example, using the Three White Soldiers or Three Black Crows patterns) and enter the market on M15-M30 after corrections.
- Pros
- Cons
- The ability to catch several price movements per day.
- Suitable for trading on news that usually influences the trend within a few hours.
- High emotional load due to constant monitoring of the chart.
- Little time to make decisions, which increases the risk of mistakes.
- A quick reaction is required to avoid being late with the entry.
M15-M30 is often chosen by experienced traders who prefer active strategies and are confident in their ability to make quick decisions.

This example illustrates the difficulties of working on short timeframes, where the entry point must be determined almost instantly. During an intraday trend movement, profit could only be made on one of two corrections if the position was opened immediately after the reversal.
Strategy principle:
Open a long position after the formation of a weak reversal pattern (pin bar).
Close the position or reverse when the bearish Engulfing pattern is formed.
Increase the existing position or open a new one during the next correction.
Repeat the actions during the next bearish Engulfing pattern.
When the bullish Engulfing pattern appears, increase the purchase or reverse the position.
The only section between points 2 and 3 could lead to losses.
Timeframe 1-4 hours
The timeframe 1-4 hours is considered optimal for beginner traders. It provides enough time to make decisions, provides relatively stable trends that are weakly influenced by fundamental factors and market makers, and allows you to quickly see the result of the transaction.
Strategies:
Increasing the volume of the position at the end of the trend movement.
Reversal of the position at the beginning or end of the correction.
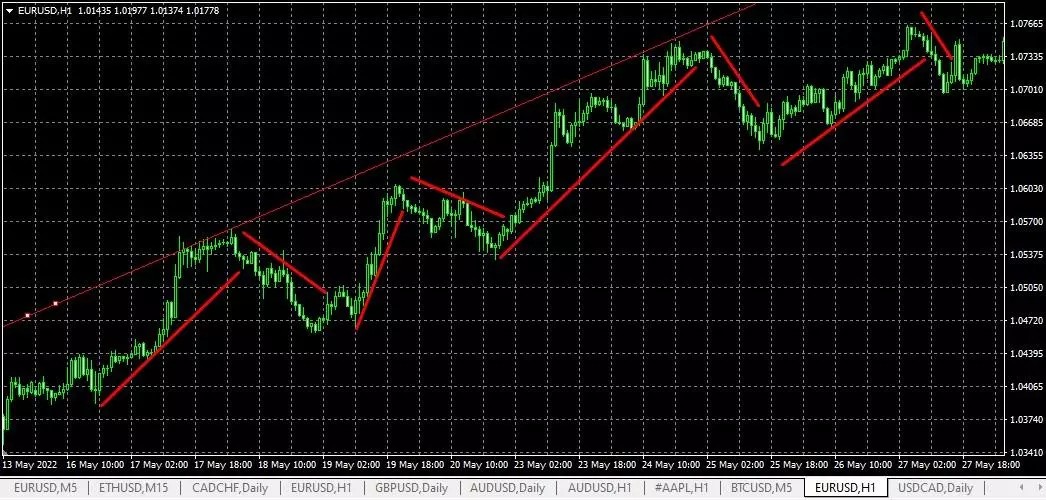
On the H1 timeframe for 12 days, there is a strong upward trend with many corrections. The average length of the candle body is 20-25 points, which allows you to earn 50-80 points in 1-2 days. To do this, you can open positions on reversals at the top of trend waves, enter the market at the lower extremes of corrections, or increase the volume at the end of downward corrections.
Timeframe 1 day
The daily time frame is suitable for long-term strategies. You can work out many drawdowns and rises on one trend, and the stability of the trend allows you to fix even small corrections. The cost of a point is higher here, which makes such transactions profitable.
- Pros
- Cons
- It is enough to check the chart for 15-20 minutes every 3-4 hours.
- The average length of a candle is 50-80 points.
- The ability to work with several assets simultaneously, while monitoring their correlation.
- A large deposit is required to withstand a drawdown of 1-2 candles without violating risk management.
- Strong trends are rare, waiting for them can take several months.
- Risk of additional expenses during exchange transactions.
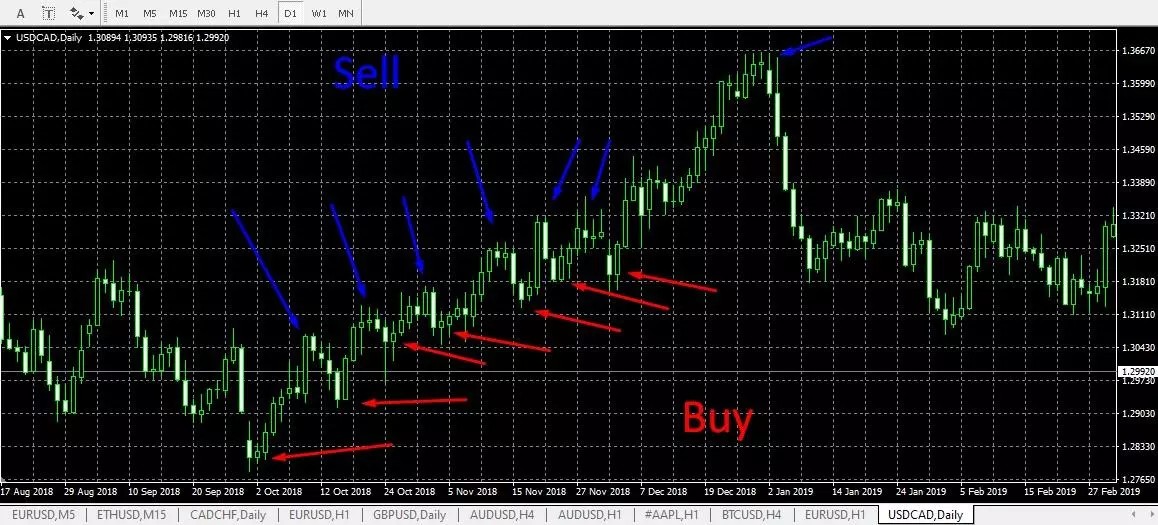
On the upward trend that lasts nearly three months, there are 7 points for buying on local correction and 7 points for closing positions. Some signals are more evident, and some less. However, on the daily time frame, even 2-3 candles of profit is a good result.
Why do swing trading time frames matter?
Swing trading is a flexible strategy that adjusts to various time frames, allowing traders to capitalize on price movements across different market conditions. The choice of time frame significantly influences profitability, signal accuracy, and the trader's involvement in monitoring the market.
Classification of trading strategies by time frame and system
By time frame:
Daily (intraday). Focuses on capturing short-term movements within a single trading session.
Medium-term. Targets trends that unfold over several days to weeks.
Long-term (investment). Aims for sustained market movements over months or years.
By trading system:
Scalping. Quick intraday trades aiming to capture minimal price movements.
Swing trading. Exploits trend corrections for medium-term gains.
Position trading. Relies on strong directional trends over extended periods.
The importance of time frames in swing trading
The selected time frame affects both the size of potential profits and the complexity of execution. For example:
On an M15 (15-minute) chart, a single candle often represents a price movement of 10–15 pips.
On a D1 (daily) chart, a single candle may span 80–100 pips.
While the movement from the end of a correction to the nearest extreme (high or low) typically spans 3–7 candles, the scale differs significantly. On the D1 time frame, this process might take several days, allowing traders more time for analysis and decision-making. On an M15 chart, these opportunities may occur multiple times within a day but require constant monitoring.
The optimal time frame depends on individual trading goals, risk tolerance, and the specific market being traded. Many swing traders prefer daily charts, as they provide a balance between detail and broader trend analysis. Daily charts reduce market noise and allow for more informed decision-making without the need for constant monitoring. However, some traders may use multiple time frames to gain a comprehensive view, such as combining daily charts for trend analysis with 4-hour charts for precise entry and exit points.
How to choose the right time frame?
The choice of time interval depends on the answers to three questions:
How much time are you willing to devote to trading?
If trading is an additional income, the daily time frame will do.
For active trading, it is better to choose M15-M30.
What type of swing trading do you prefer?
On short intervals, positions are opened in the direction of the trend after corrections.
On long intervals, you can also earn on corrections by opening trades against the trend.
What are your profitability goals?
Long-term trends are less risky, but signals appear less frequently.
Short-term trends can be more profitable if you fix positions correctly.
Timeframes H1-H4 combine the advantages of short and long intervals, providing a balance between stability and frequency of signals. The choice depends on your trading style.
How to use multiple timeframes in swing trading
This strategy involves analyzing the trend on a higher timeframe and opening positions on a lower one. First, the trend is determined on the daily interval - a breakout of support or resistance levels, the formation of reversal patterns or other signals confirmed by 3-4 candles of directional movement. Such a trend usually includes 36-48 candles on H1 with corrections suitable for entry.
An example of swing trading efficiency:
On a daily time frame, you open a trade of one candle (50 points) and fix 50 points of profit.
On an hourly time frame, there are 24 candles. The price first rises by 35 points, and you close the position. Then it falls by 20 points, where you enter again. By the time the 24th candle closes, the price gives another 50 points (minus 15 points of correction).
Total profit: 35 + (50 - 15) = 70 points.
Using lower time frames allows you to earn more by working with corrections within the trend.
Now you know a few things about swing trading. Are you ready to practice on a demo account? Below are brief reviews of swing trading brokers that offer the best trading conditions and full features.
| Demo | Min. deposit, $ | Max. leverage | ECN | ECN Commission, $ per lot | Investor protection | Open an account | |
|---|---|---|---|---|---|---|---|
| Yes | 100 | 1:500 | Yes | 3,5 | £85,000 €20,000 | Open an account Your capital is at risk. |
|
| Yes | 5 | 1:1000 | Yes | 3,5 | £85,000 €20,000 | Open an account Your capital is at risk. |
|
| Yes | 10 | 1:2000 | Yes | 2 | €20,000 | Open an account Your capital is at risk. |
|
| Yes | 10 | 1:2000 | Yes | 3 | €20,000 £85,000 | Open an account Your capital is at risk.
|
|
| Yes | 100 | 1:500 | Yes | 3 | No | Open an account Your capital is at risk. |
The choice of time frame depends on the trading style

The choice of timeframe for swing trading should take into account your trading style and the nature of the asset being traded. For example, for highly volatile currency pairs such as GBP/JPY, the H4-D1 timeframes are more appropriate, as they allow you to filter out noise and focus on sustainable movements. For less volatile assets, such as commodities, the H1-H4 timeframes can provide more entry opportunities.
Another aspect that is often forgotten is the synchronization of timeframes. Analysis of a higher timeframe, such as D1, helps to determine the long-term trend, while a lower one, such as H1, is used to find entry points. This reduces the risk of opening a deal against the trend, which is especially important when working with stocks or cryptocurrencies, where fundamental factors can suddenly change the market dynamics.
To improve efficiency, I recommend using indicators adapted to the selected timeframe. Moving averages and RSI work well on H1 to determine short-term corrections. On D1, it is better to use Fibonacci levels and the MACD indicator to find global reversals. This approach allows you to flexibly adapt to changing market conditions and get the most out of swing trading.
Conclusion
The choice of the appropriate time frame for swing trading depends on your trading style, available time, and profitability goals. Short time frames provide more opportunities for trades, but require high concentration and reaction speed. Long time frames allow you to focus on stable trends, reducing emotional stress. The best option for most traders may be intermediate intervals, such as H1-H4, which combine the frequency of signals and their reliability. Use a combined analysis of several time frames to find entry and exit points with maximum accuracy. This approach will help you achieve stable profits and effectively manage risks.
FAQs
Can swing trading be used for all asset types?
Swing trading is suitable for most assets with strong trends, such as stocks, forex, and commodities. However, for assets with low volatility or narrow ranges, the strategy may be less effective.
How to combine swing trading with fundamental analysis?
Fundamental analysis helps to identify long-term trends that can be used for swing trading. For example, the release of macroeconomic data or seasonal price fluctuations can indicate the direction of the trend, while technical analysis can provide specific entry points.
What additional risks are associated with swing trading?
The main risk is sharp market changes outside the trader's working hours, especially when using daily time frames. To minimize this risk, set stop losses and monitor the news background that can affect the selected asset.
What approach to use for swing trading in low-liquidity markets?
In low liquidity markets, it is better to use longer timeframes, such as H4 or D1. This allows you to avoid market noise and reduce the likelihood of false signals, which are typical for short-term intervals.
Related Articles
Team that worked on the article
Parshwa is a content expert and finance professional possessing deep knowledge of stock and options trading, technical and fundamental analysis, and equity research. As a Chartered Accountant Finalist, Parshwa also has expertise in Forex, crypto trading, and personal taxation. His experience is showcased by a prolific body of over 100 articles on Forex, crypto, equity, and personal finance, alongside personalized advisory roles in tax consultation.
Chinmay Soni is a financial analyst with more than 5 years of experience in working with stocks, Forex, derivatives, and other assets. As a founder of a boutique research firm and an active researcher, he covers various industries and fields, providing insights backed by statistical data. He is also an educator in the field of finance and technology.
As an author for Traders Union, he contributes his deep analytical insights on various topics, taking into account various aspects.
Mirjan Hipolito is a journalist and news editor at Traders Union. She is an expert crypto writer with five years of experience in the financial markets. Her specialties are daily market news, price predictions, and Initial Coin Offerings (ICO).
A trading system is a set of rules and algorithms that a trader uses to make trading decisions. It can be based on fundamental analysis, technical analysis, or a combination of both.
An investor is an individual, who invests money in an asset with the expectation that its value would appreciate in the future. The asset can be anything, including a bond, debenture, mutual fund, equity, gold, silver, exchange-traded funds (ETFs), and real-estate property.
A long position in Forex, represents a positive outlook on the future value of a currency pair. When a trader assumes a long position, they are essentially placing a bet that the base currency in the pair will appreciate in value compared to the quote currency.
Fundamental analysis is a method or tool that investors use that seeks to determine the intrinsic value of a security by examining economic and financial factors. It considers macroeconomic factors such as the state of the economy and industry conditions.
Volatility refers to the degree of variation or fluctuation in the price or value of a financial asset, such as stocks, bonds, or cryptocurrencies, over a period of time. Higher volatility indicates that an asset's price is experiencing more significant and rapid price swings, while lower volatility suggests relatively stable and gradual price movements.


-
 Afghanistan
-
 Albania
-
 Algeria
-
 Argentina
-
 Armenia
-
 Australia
-
 Austria
-
 Azerbaijan
-
 Bahamas
-
 Bahrain
-
 Bangladesh
-
 Belgium
-
 Botswana
-
 Brazil
-
 Brunei
-
 Bulgaria
-
 Burma
Burma
-
 Cambodia
-
 Cameroon
-
 Canada
-
 Chile
Chile
-
 China
China
-
 Colombia
-
 Costa Rica
-
 Cote d'Ivoire
-
 Croatia
-
 Cyprus
-
 Czech Republic
-
 Denmark
-
 Dominican Republic
-
 Ecuador
-
 Egypt
Egypt
-
 Estonia
-
 Eswatini
-
 Ethiopia
-
 Finland
-
 France
-
 Georgia
-
 Germany
-
 Ghana
Ghana
-
 Greece
-
 Haiti
Haiti
-
Hong Kong
-
 Hungary
-
 India
India
-
 Indonesia
-
 Iran, Islamic republic
-
 Iraq
Iraq
-
 Ireland
-
 Israel
-
 Italy
Italy
-
 Jamaica
-
 Japan
Japan
-
 Jordan
-
 Kazakhstan
-
 Kenya
Kenya
-
 Korea
Korea
-
 Kuwait
-
 Kyrgyzstan
-
 Laos
Laos
-
 Latvia
-
 Lebanon
-
 Libyan Arab Jamahiriya
-
 Lithuania
-
 Luxembourg
-
 Macedonia
-
 Madagascar
-
 Malaysia
-
 Malta
Malta
-
 Mauritius
-
 Mexico
-
 Moldova
-
 Mongolia
-
 Montenegro
-
 Morocco
-
 Mozambique
-
 Namibia
-
 Nepal
Nepal
-
 Netherlands
-
 Nigeria
-
 Norway
-
 Oman
Oman
-
 Pakistan
-
 Palestine
-
 Papua New Guinea
-
 Peru
Peru
-
 Philippines
-
 Poland
-
 Portugal
-
 Puerto Rico
-
 Qatar
Qatar
-
 Romania
-
 Rwanda
-
 Saudi Arabia
-
 Serbia
-
 Singapore
-
 Slovakia
-
 Slovenia
-
 Somalia
-
 South Africa
-
 Spain
Spain
-
 Sri Lanka
-
 Sweden
-
 Switzerland
-
 Syrian Arab Republic
-
 Taiwan
-
 Tajikistan
-
 Tanzania, United Republic Of
-
 Thailand
-
 Trinidad and Tobago
-
 Tunisia
-
 Turkey
-
 UAE
UAE
-
 Uganda
-
 Ukraine
-
 United Kingdom
-
 United States
-
 Uzbekistan
-
 Venezuela
-
 Vietnam
-
 Yemen
Yemen
-
 Zambia
-
 Zimbabwe
- Forex
- Crypto
