How To Use The Diamond Chart Pattern In Your Trading Strategy


Editorial Note: While we adhere to strict Editorial Integrity, this post may contain references to products from our partners. Here's an explanation for How We Make Money. None of the data and information on this webpage constitutes investment advice according to our Disclaimer.

The diamond pattern appears when the ascending and descending channels cross. This happens quite often, but the problem is that the obvious rhombus formation on the chart is rarely identified.
- Trade entries and exits are determined by clear breakout points.
- Confirmatory indicators and volume spikes increase trade reliability.
- Misidentification and false breakouts are notable risks.
While rich with potential, the diamond pattern is a complex configuration that is often misunderstood or overlooked due to its rarity in perfect form. Its intricate structure can lead to misinterpretation, thus misleading the untrained eye.
This article endeavors to explain the diamond pattern, providing traders with a discerning lens through which to identify and exploit this configuration. Armed with this knowledge, traders can approach the Forex arena with heightened confidence, ready to capture the opportunities this pattern unfolds.
What is the diamond structure in Forex?
This pattern achieves almost a mythical status because it's seldom found in its perfect form, with prices gracefully touching all its intended boundaries.
It is commonly encountered in its more nebulous, imperfect shape - a fuzzy incarnation manifesting at the intersection of ascending and descending channels, suggesting a market at a crossroads of indecision.
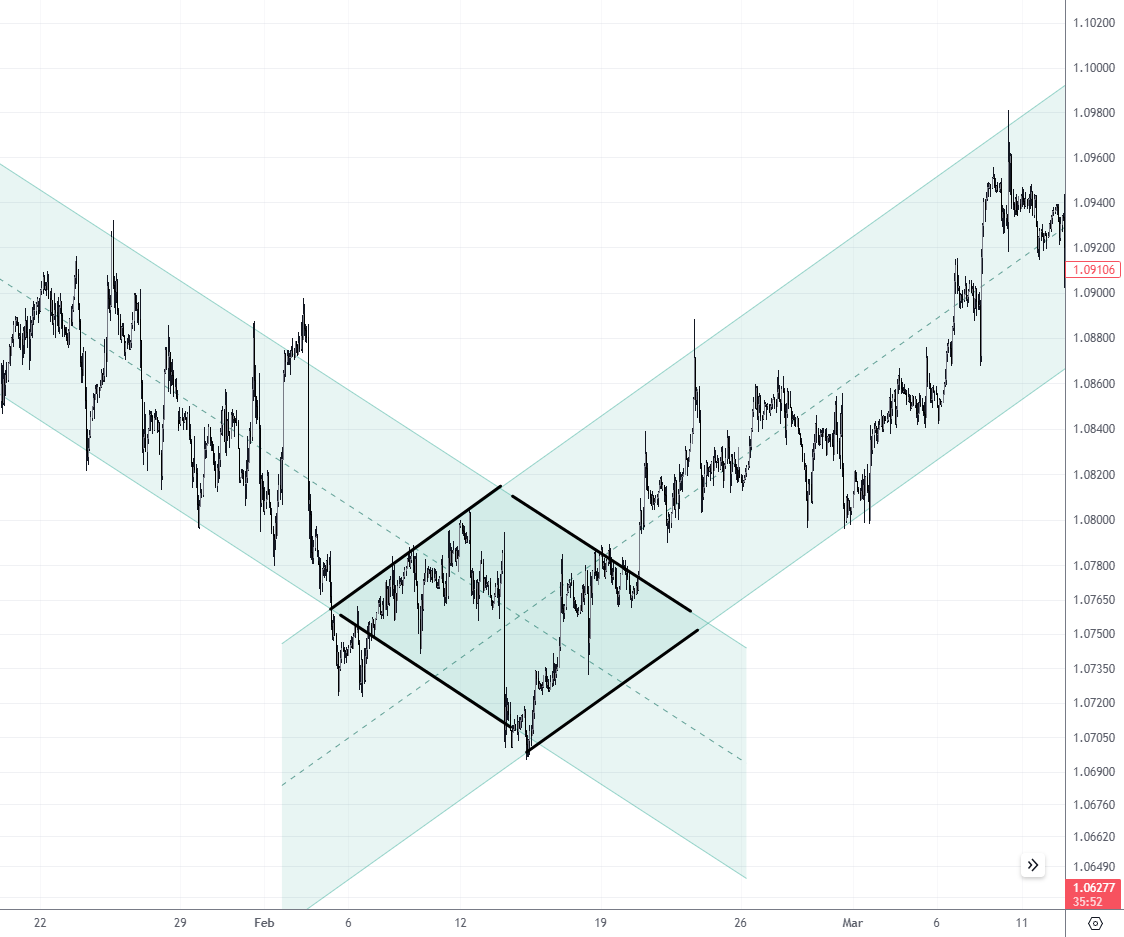 Diamond pattern forming on an EUR/USD hourly chart
For the eye trained to see beyond the obvious, the image before us on the EUR/USD 1-hour chart is a textbook example of a diamond bottom. The chart showcases a dance of peaks and troughs, intertwining to form a diamond—subtle, yet discernible. The price movement weaves a narrative of pressure and release, suggesting a potential shift from a downtrend to a promising ascent.
How do you mark out a diamond pattern?
Identifying a diamond pattern begins with observing a trend. This pattern typically manifests at crucial junctures: at the peak of an uptrend or at the nadir of a downtrend. Visually, the pattern resembles a diamond shape, starting broad at the center and tapering at the ends.
To delineate this pattern, a trader plots a series of higher peaks and lower troughs, tracing the initial expansion phase followed by a contraction phase. The expansion denotes volatility and uncertainty as prices reach wider highs and lows, while the contraction indicates the consolidation of price movement.
The convergence of these lines towards the pattern's culmination point is the critical juncture that traders keenly anticipate. In essence, the diamond marks a zone of contention where buyers and sellers are in a tug-of-war, before a decisive breakout occurs.
What does a diamond pattern represent?
The diamond pattern, observed on charts, represents a unique intersection of market psychology and price action, where two channels - typically one ascending and one descending - cross paths. This interplay is not overtly conspicuous but can be discerned by a studied eye.
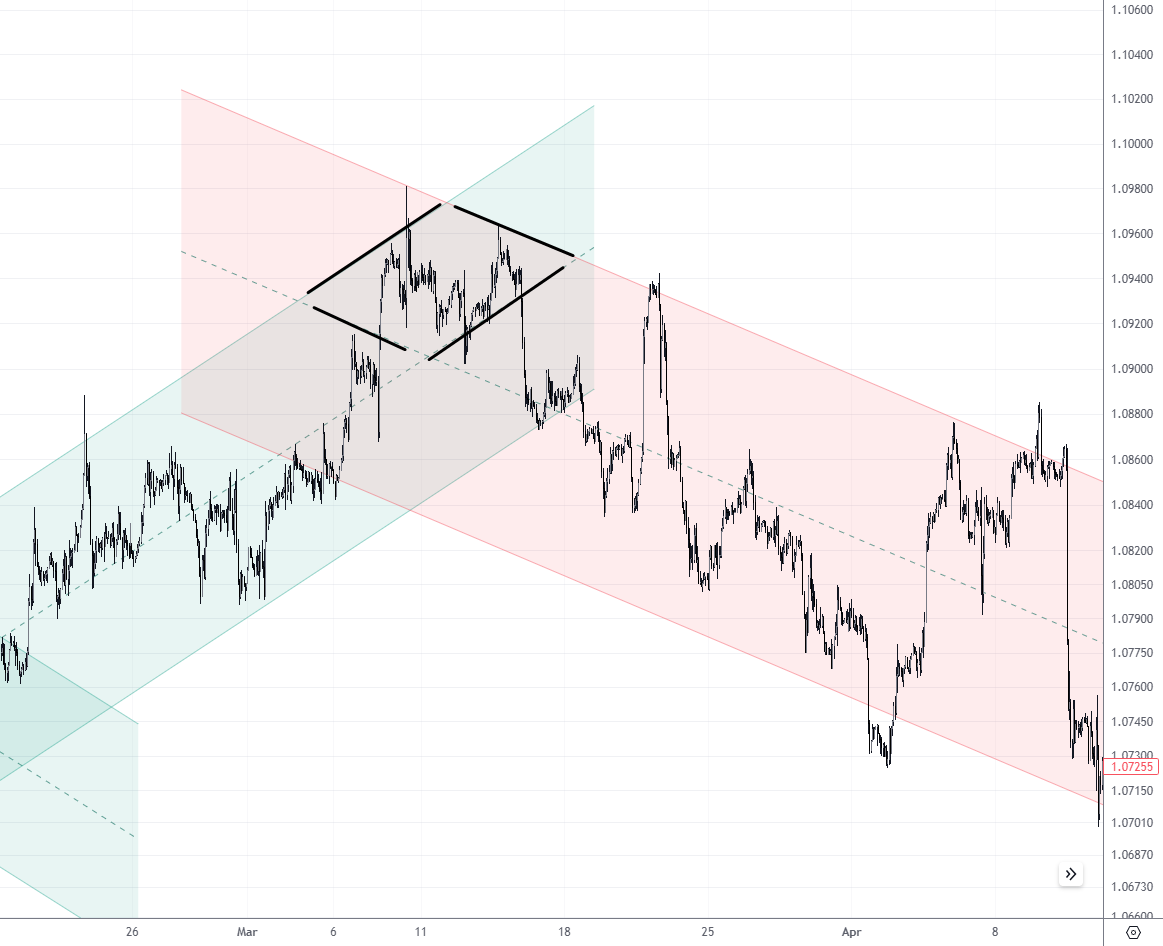 Diamond pattern depicting crossover of ascending and descending channels on a chart
The pattern is a battleground where bullish and bearish sentiments are equally matched for a time, leading to a price compression that ultimately culminates in a significant breakout. It symbolizes a period of indecision where the market is evaluating its next dominant move.
While it does not predict direction with certainty, it sets the stage for a sharp move in either direction. Thus, the diamond pattern is a prelude to volatility, hinting at a substantial shift in market dynamics once a conclusive breakout has occurred.
Best Forex brokers

How do diamond patterns work?
Trading diamond patterns requires patience and an eye for decisive confirmation. The confirmation comes when the price penetrates the support or resistance line defining one of the rhombus's borders. This breakout is the trader's green light, but it should not stand alone.
As confirmatory signals, traders can use:
volume spikes;
chart patterns on the background;
indicators;
signals from higher timeframes.
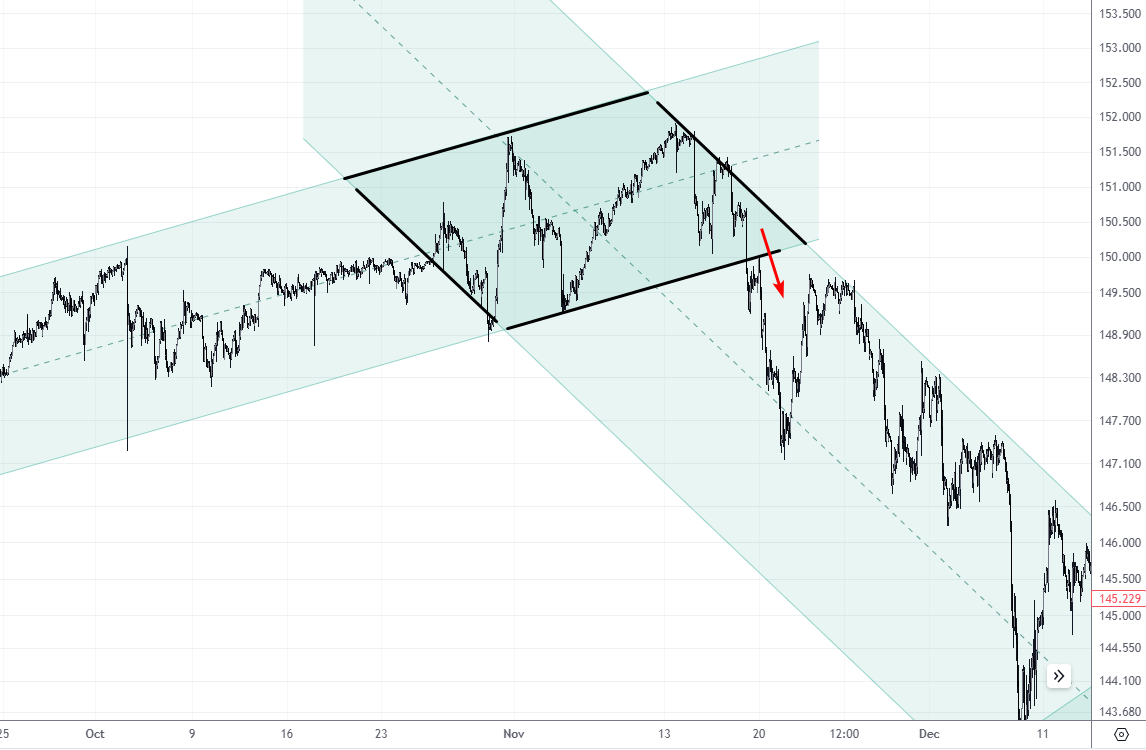 A USD/JPY hourly chart showing a diamond pattern
Take the example of a USD/JPY 1-hour chart. It might exhibit a diamond pattern formed at the zenith of an uptrend. A breakout below the lower trendline is a clarion call to sell. The red arrow indicates a breakout of the diamond pattern. By this time, the trader should already have a plan for entering the trade ready.
When it comes to managing risk, placing a stop loss is essential. A prudent placement is just outside the diamond pattern's boundary, opposite the breakout. In the case under consideration, the price is falling accelerating under the psychological level of 150 yen per dollar, so the trader may decide to set a stop loss above the psychological level.
How do you take profit in diamond pattern trading?
Taking profit in diamond pattern trading is an art that hinges on strategic exit points. Even before a trader enters a position, he or she must identify a clear target where the anticipated price move is likely to pause or reverse. Typically, this target is set by projecting the maximum height of the diamond pattern from the breakout point.
For a more conservative approach, traders may look to previous levels of significant support or resistance within the trend that preceded the diamond formation. It’s important to monitor momentum and adjust expectations based on price action, potentially securing profits incrementally as the price reaches intermediate milestones.
Oleg Pylypenko, Analyst and Contributor of TradersUnion assumes that the price enters a new trend channel after the breakdown. And the shape of the diamond can give clues as to what it will be like. The contours of a new trend channel can be used to set targets, but this is a difficult practice due to subjectivity and the need for extensive experience in chart studies.
Example 1. Diamond pattern in stocks
The 4-hour chart below presents a classic diamond pattern within the Dow Jones ETF market. In this scenario, the diamond serves as a consolidation phase following a marked uptrend. A trader eyeing this pattern would anticipate a breakout to the upside, given the prevailing bullish context. The prudent entry level would align with the breakout point, positioned just above the diamond's upper boundary to catch the upward momentum.
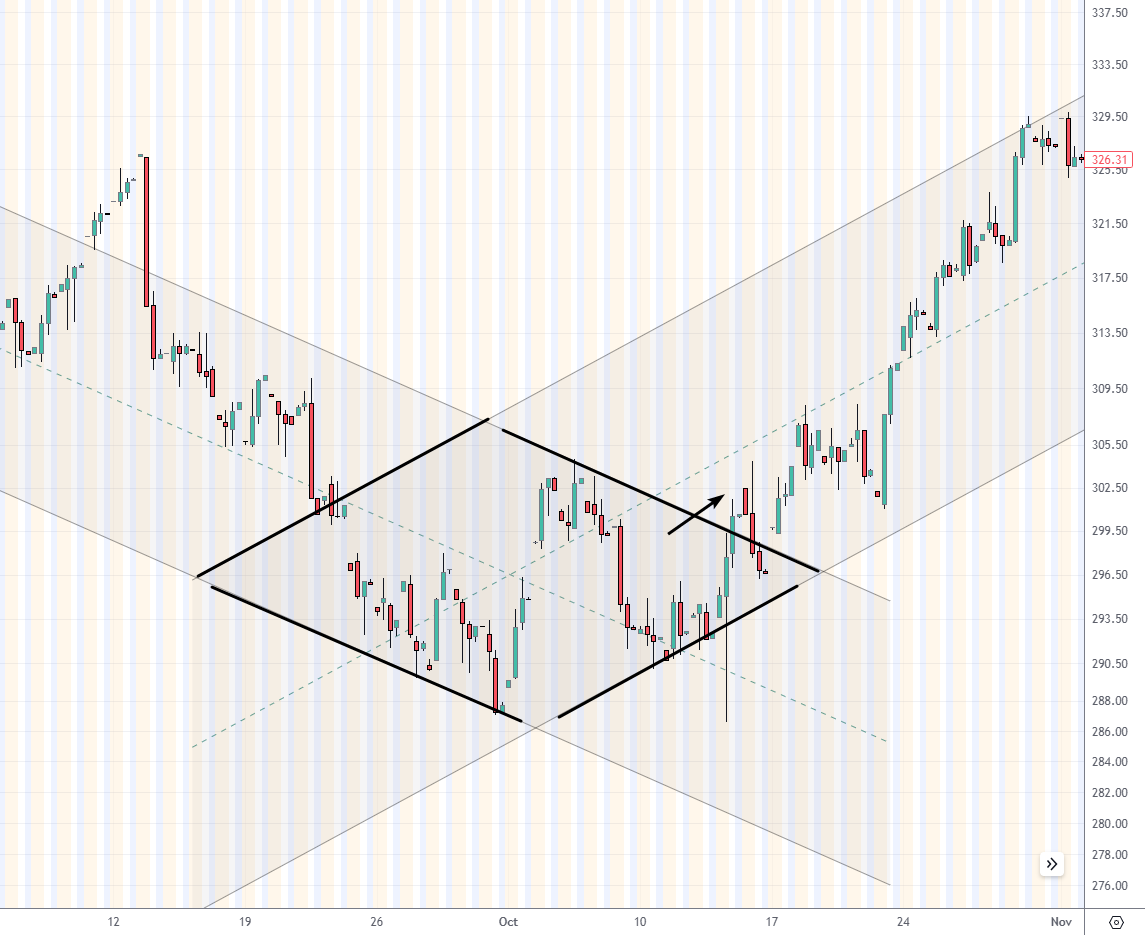 Dow Jones 4-hour chart showcasing a diamond pattern
A conservative stop loss would be placed slightly below the last swing low within the diamond, minimizing potential losses if the breakout falters. For profit-taking, one might set an initial target at a previous high or a significant resistance level, considering a partial close to secure gains while allowing the remainder of the position to capitalize on continued upward movement.
If the price approached the upper channel around 329, a complete position closure would be advised due to the convergence of the channel resistance and the psychological round-number effect, both likely to incite a price retraction or plateau.
Example 2. Diamond pattern in crypto
Take a look at the displayed crypto chart, where the diamond pattern has emerged after a period of price consolidation. As the pattern unfolds, the price action signifies indecision among traders, wavering around the significant psychological threshold of 30,000 dollars per Bitcoin. This level acts as a crucial pivot point, reflecting the market's hesitation to establish a trend beyond this round figure.
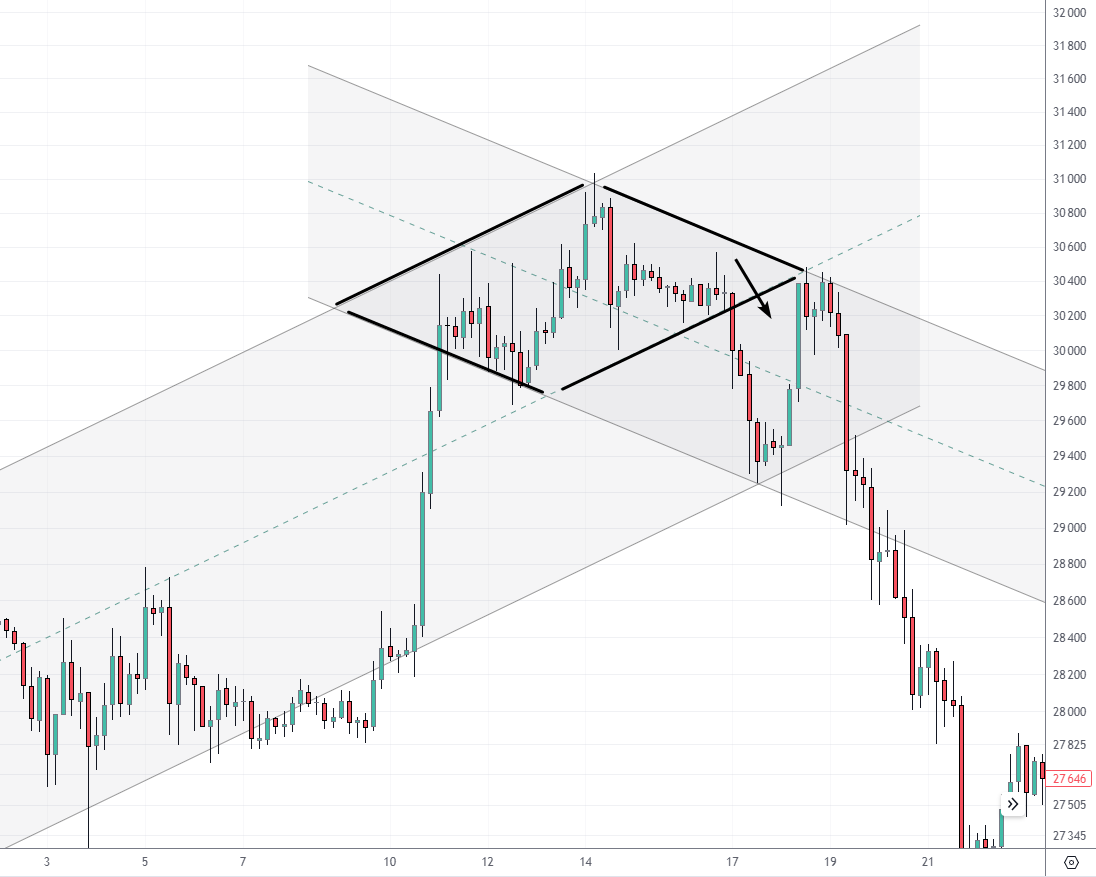 Crypto chart showing a diamond pattern
As we analyze the chart, it becomes evident that the upper boundary of the diamond has capped upward momentum, forming a resistance that the bulls have struggled to breach. A breakout, in this case, should be confirmed with robust trading volume as the price attempts to cross the formidable 30,000-dollar mark. A prudent trader would wait for a decisive candle close above the diamond's apex to validate an upward breakout, signaling a potential long entry.
On the flip side, the lower boundary of the diamond pattern suggests a gathering of bearish sentiment. A downward breakout, especially under the weight of heavy sell volumes, suggests the market is not ready to sustain the 30,000-dollar mark, offering a strategic entry for a short position just beneath the diamond's lower boundary. A bearish engulfment-like chart pattern right in the center of the diamond adds weight to ideas to short Bitcoin.
For managing risk, a well-placed stop-loss order would be just above the recent swing high within the diamond for a short position, or just below the recent swing low for a long position, ensuring a tight control over potential losses should the breakout falter.
In terms of profit-taking strategies, a conservative approach would involve measuring the height of the diamond and projecting it from the breakout point to set a primary target. Additionally, traders might refine their exits by examining historical levels where the price has previously stalled, allowing for partial profit captures while guarding against retracements.
Lastly, as the price approaches the projected upper channel line, caution is warranted. This line could act as a strong counter-trend resistance, prompting a complete position liquidation to secure accrued gains before the market potentially turns.
Example 3. Diamond pattern in Forex
In the chart before us, the pattern has been meticulously formed, indicating volatility and potential trend reversal points.
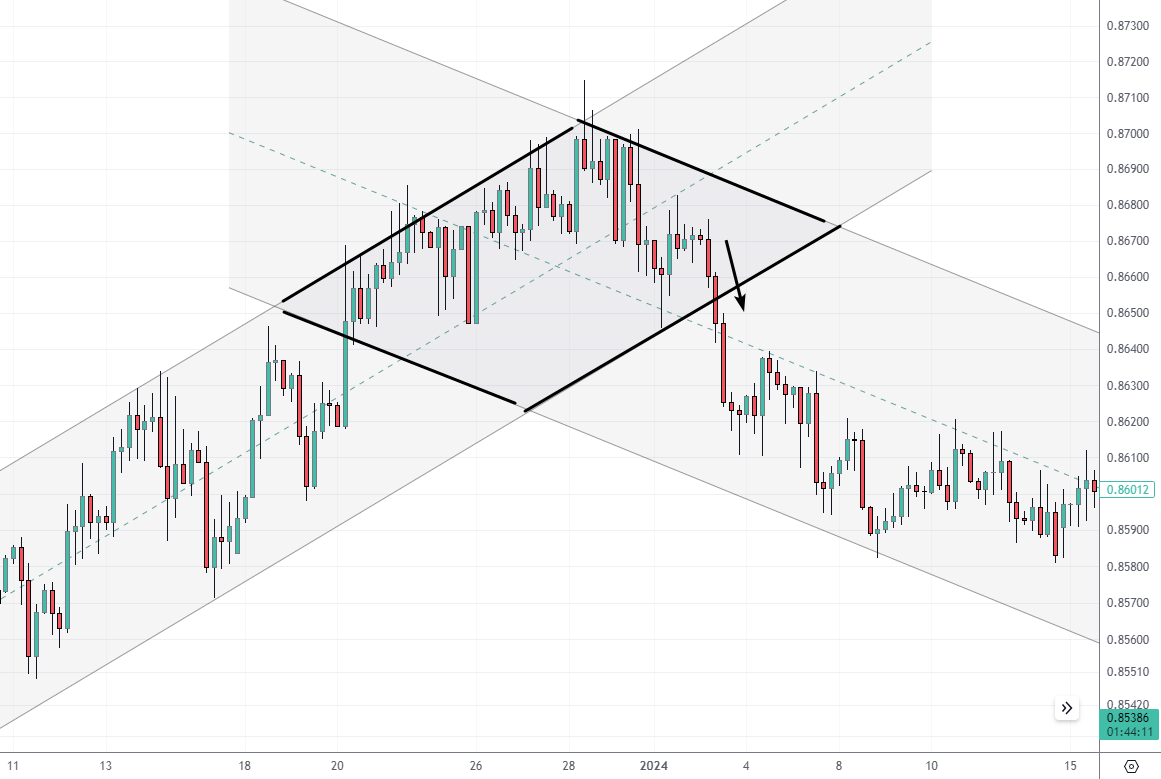 Forex chart showcasing a diamond pattern
A noticeable downward breakout through the pattern's lower boundary at approximately 0.8660 signals a potential bearish continuation. In this scenario, a trader would consider an entry just below this level, at around 0.8650, after ensuring the breakout is confirmed with a definitive candle close below the diamond's perimeter.
Given this setup, a reasonable stop loss could be positioned just above the most recent swing high within the diamond, at about 0.8680. This placement protects against the volatility within the formation and potential false breakouts.
Traders could consider taking partial profits here and then reassess to potentially allow the remainder of the position to pursue further gains, with the next logical target being at a significant support level observed previously on the chart.
In the presented Forex chart, as the price descends, traders may adapt their strategy, either taking incremental profits or adjusting their stop-loss orders to lock in gains as the price moves favorably.
Should I trade diamond patterns?
Trading the diamond pattern can be advantageous, but it comes with caveats. Not all patterns lead to clear reversals; some may fail, leading to losses if not managed properly. To mitigate this, traders should look for confirmatory indicators such as volume spikes or momentum oscillators that support the breakout direction.
Moreover, the diamond pattern's reliability increases when it aligns with fundamental analysis Economic indicators, news events, and market sentiment should corroborate the technical outlook. For example, a bullish breakout during a period of positive economic reports could reinforce a buy signal.
Finally, it's crucial to consider the context in which the pattern forms. Is the market trending or ranging? The diamond pattern's implications may differ significantly between these environments. In summary, while the diamond pattern can be a powerful tool, it should be traded with a holistic approach that encompasses technical, fundamental, and situational analysis.
Benefits of using Diamond pattern
Clear Breakout Signals: Diamond patterns often provide distinct breakout points for entry and exit.
Predictive Nature: They can forecast significant reversals or continuations in price trends.
Volume Confirmation: Increased trading volume can validate the pattern, offering a higher success rate.
Defined Risk Management: Stop loss and take profit levels are straightforward to set based on the pattern's boundaries.
Why not to trade Diamond pattern
Complex Recognition: Identifying diamond patterns accurately requires experience and can be subjective.
False Breakouts: There is a risk of false signals leading to premature or erroneous trades.
Rarity: Perfect diamond patterns are rare, potentially leading to missed opportunities or overanalysis.
Market Noise: In highly volatile markets, the pattern can be disrupted by noise, undermining its reliability.
Summary
The Diamond pattern, with its distinctive shape and actionable signals, offers traders a strategic edge. However, successful navigation of this pattern demands a blend of technical prowess, vigilant confirmation, and alignment with broader market trends. While not without its challenges, the Diamond pattern remains a valuable facet of a trader's analytical arsenal.
FAQs
What is a diamond shape pattern?
A diamond pattern is a technical chart formation that usually suggests a potential trend reversal. If failed, it indicates a continuation of the market trend.
Is a diamond pattern bullish?
A diamond bottom pattern typically indicates bullish potential, while a diamond top suggests bearish outcomes.
Is pattern trading effective?
Pattern trading can be effective when combined with other analytical tools, offering structured entry and exit points in the markets. Careful testing of patterns on history can provide confirmation as to whether a pattern is indeed effective for use in trading.
What is the most profitable trading pattern?
The most profitable trading pattern varies with market conditions and trader expertise, but patterns like the head and shoulders and double tops/bottoms are renowned for their reliability.
Related Articles
Team that worked on the article
Vuk stands at the forefront of financial journalism, blending over six years of crypto investing experience with profound insights gained from navigating two bull/bear cycles. A dedicated content writer, Vuk has contributed to a myriad of publications and projects. His journey from an English language graduate to a sought-after voice in finance reflects his passion for demystifying complex financial concepts, making him a helpful guide for both newcomers and seasoned investors.
Dr. BJ Johnson is a PhD in English Language and an editor with over 15 years of experience. He earned his degree in English Language in the U.S and the UK. In 2020, Dr. Johnson joined the Traders Union team. Since then, he has created over 100 exclusive articles and edited over 300 articles of other authors.
Mirjan Hipolito is a journalist and news editor at Traders Union. She is an expert crypto writer with five years of experience in the financial markets. Her specialties are daily market news, price predictions, and Initial Coin Offerings (ICO).
Cryptocurrency is a type of digital or virtual currency that relies on cryptography for security. Unlike traditional currencies issued by governments (fiat currencies), cryptocurrencies operate on decentralized networks, typically based on blockchain technology.
Forex trading, short for foreign exchange trading, is the practice of buying and selling currencies in the global foreign exchange market with the aim of profiting from fluctuations in exchange rates. Traders speculate on whether one currency will rise or fall in value relative to another currency and make trading decisions accordingly. However, beware that trading carries risks, and you can lose your whole capital.
Forex leverage is a tool enabling traders to control larger positions with a relatively small amount of capital, amplifying potential profits and losses based on the chosen leverage ratio.
Copy trading is an investing tactic where traders replicate the trading strategies of more experienced traders, automatically mirroring their trades in their own accounts to potentially achieve similar results.
Algorithmic trading is an advanced method that relies on advanced coding and formulas based on a mathematical model. However, compared to traditional trading methods, the process differs by being automated.

-
 Afghanistan
-
 Albania
-
 Algeria
-
 Argentina
-
 Armenia
-
 Australia
-
 Austria
-
 Azerbaijan
-
 Bahamas
-
 Bahrain
-
 Bangladesh
-
 Belgium
-
 Botswana
-
 Brazil
-
 Brunei
-
 Bulgaria
-
 Burma
Burma
-
 Cambodia
-
 Cameroon
-
 Canada
-
 Chile
Chile
-
 China
China
-
 Colombia
-
 Costa Rica
-
 Cote d'Ivoire
-
 Croatia
-
 Cyprus
-
 Czech Republic
-
 Denmark
-
 Dominican Republic
-
 Ecuador
-
 Egypt
Egypt
-
 Estonia
-
 Eswatini
-
 Ethiopia
-
 Finland
-
 France
-
 Georgia
-
 Germany
-
 Ghana
Ghana
-
 Greece
-
 Haiti
Haiti
-
 Hong Kong
-
 Hungary
-
 India
India
-
 Indonesia
-
 Iran, Islamic republic
-
 Iraq
Iraq
-
 Ireland
-
 Israel
-
 Italy
Italy
-
 Jamaica
-
 Japan
Japan
-
 Jordan
-
 Kazakhstan
-
 Kenya
Kenya
-
 Korea
Korea
-
 Kuwait
-
 Kyrgyzstan
-
 Laos
Laos
-
 Latvia
-
 Lebanon
-
 Libyan Arab Jamahiriya
-
 Lithuania
-
 Luxembourg
-
 Macedonia
-
 Madagascar
-
 Malaysia
-
 Malta
Malta
-
 Mauritius
-
 Mexico
-
 Moldova
-
 Mongolia
-
 Montenegro
-
 Morocco
-
 Mozambique
-
 Namibia
-
 Nepal
Nepal
-
 Netherlands
-
 Nigeria
-
 Norway
-
 Oman
Oman
-
 Pakistan
-
 Palestine
-
 Papua New Guinea
-
 Peru
Peru
-
 Philippines
-
 Poland
-
 Portugal
-
 Puerto Rico
-
 Qatar
Qatar
-
 Romania
-
 Rwanda
-
 Saudi Arabia
-
 Serbia
-
 Singapore
-
 Slovakia
-
 Slovenia
-
 Somalia
-
 South Africa
-
 Spain
Spain
-
 Sri Lanka
-
 Sweden
-
 Switzerland
-
 Syrian Arab Republic
-
 Taiwan
-
 Tajikistan
-
 Tanzania, United Republic Of
-
 Thailand
-
 Trinidad and Tobago
-
 Tunisia
-
 Turkey
-
 UAE
UAE
-
 Uganda
-
 Ukraine
-
United Kingdom
-
 United States
-
 Uzbekistan
-
 Venezuela
-
 Vietnam
-
 Yemen
Yemen
-
 Zambia
-
 Zimbabwe
- Forex
- Crypto