How to Use Volume Profile in Trading

Volume Profile is a market analysis indicator in the form of a histogram on a chart that represents trading volumes at different price levels on a given timeframe. Traders can make decisions based on the information given by the profile:
-
Volume profile is arched. Supply and demand are balanced. The market is flat
-
Volume profile is thin. Either supply or demand prevails. The market is trending
-
The highest volume level on a profile is often an important level of support or resistance
The problem that many traders encounter in financial markets is that it’s hard to identify support and resistance levels and determine which trend prevails.
My article offers a review of a market analysis tool, known as Volume Profile, that enables traders to visualize and analyze trading volumes by price levels. I will provide easy-to-understand information on how the use of volume profiles can help interpret price movements and make informed trading decisions.
-
What is Volume Profile?
Volume Profile is a market analysis indicator in the form of a histogram on a chart that shows trading volumes at different price levels in a specified time period. Essentially, it displays price levels at which most transactions were made and price levels at which trading was underactive.
-
What is the best indicator for volume?
It depends on the trader’s style and preferences. However, Volume Profile is highly practical and versatile, and therefore it is widely used and can be considered one of the best for volume analysis
-
Does TradingView have a Volume Profile?
Yes, TradingView provides the Volume Profile tool that allows users to analyze the distribution of trading volumes across different price levels. But its application can be limited depending on the plan.
-
Which is better: Volume Profile or Market Profile?
There is a slight difference between these two terms and they are sometimes confused. I define Market Profile as the TPO (Time Price Opportunity) concept offered by Peter Steidlmayer in the 1980s for trading on the Chicago Mercantile Exchange. Volume Profile is a more developed, contemporary version that focuses on trading volumes, while Market Profile puts emphasis on price levels and the time of their formation. Both tools are useful and can complement each other.
What is the Volume Profile indicator?
As you know, every trade on an exchange is made between a seller and a buyer, and has a size (amount of cryptocurrency, number of stocks or Forex lots, etc.) and a price.
The Volume Profile indicator takes all trades conducted in a certain period and collects the following information about them:
-
Price levels
-
Trading volumes
Then it sums up the trading volumes for each price level and presents the results as a histogram on the price chart.
Let’s look at an example. Below are three volume profiles on a EUR futures price chart. The profiles are displayed in semi-transparent blue.
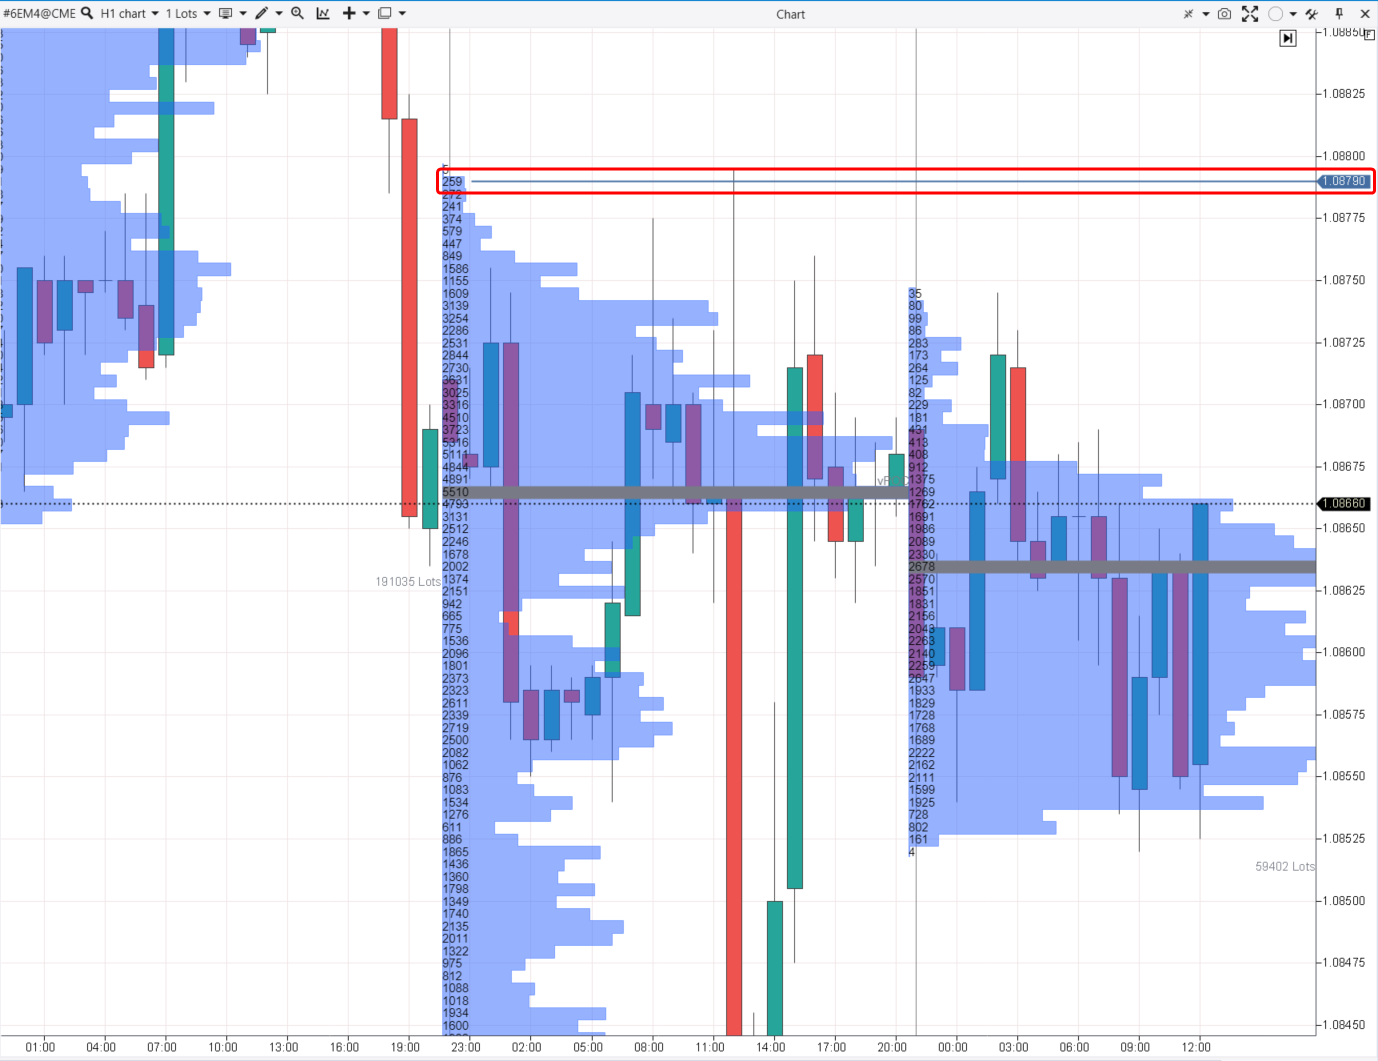
Volume profiles on a chart
The more volume is traded at a level, the longer the bar on the profile histogram. For example, 259 futures contracts were traded at 1.08790 (marked with a frame).
The level at which the largest number of contacts, namely 5510, were traded that day is highlighted in gray. It’s called Point of Control (POC).
Another important term is Value Area. It’s an area where 90% of trades took place.
Best Forex brokers


How do you read the Volume Profile indicator?
Volume Profile provides important information about the distribution of intraday trading activity:
-
Levels at which trading is more active. In such cases, the profile is wide
-
Levels at which buyers or sellers predominate. In such cases, the profile is narrow (thin)
-
How trading volume is distributed in the Value Area – evenly or not; in its upper or lower part
For example, the above chart shows three profiles. The highest volume levels on the middle and right-hand profiles are almost identical. It could mean that the consensus of buyers and sellers hardly changed during these two days, which is a sign of a flat market where the price moves within a range.
The next example is a profile in the S&P-500 futures market.
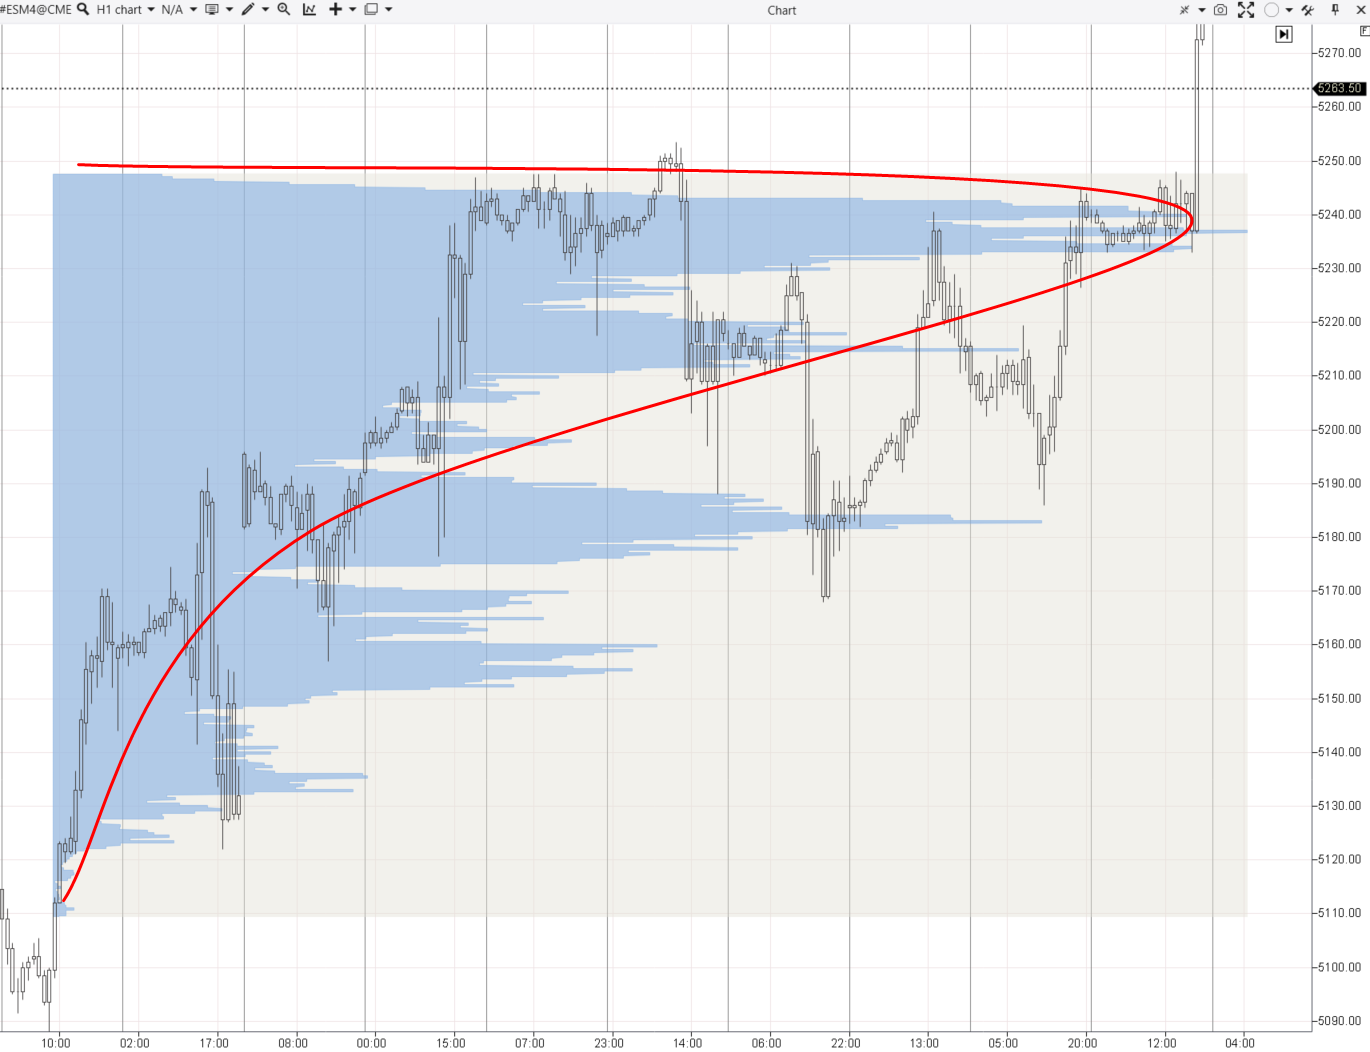
Volume profile on an S&P-500 chart
The P-like shape of the profile indicates that most trades were conducted in its upper part. This uneven distribution suggests that buyers were more active.
If the profile showed a uniform distribution (Gaussian bell curve), it would be a sign of a flat market. But in the above case, there was a rapid upward breakout, as a greater number of buyers clustered near the 5250 level. They absorbed all sellers’ volumes and the price went up quickly.
Volume Profile trading strategy with examples
Volume Profile is often used as a component in complex strategies.
Below, I will show simple usage of the Volume Profile indicator as the only source of information for assessing market situations and making trading decisions.
Example 1. A bounce off a thin profile level
The thin profile indicates an evident superiority of one of the parties. The chart below (EUR futures) shows that when the price went up quickly, almost no trades were made, which means there were very few sellers. This spot is circled. Such levels often serve as support zones.
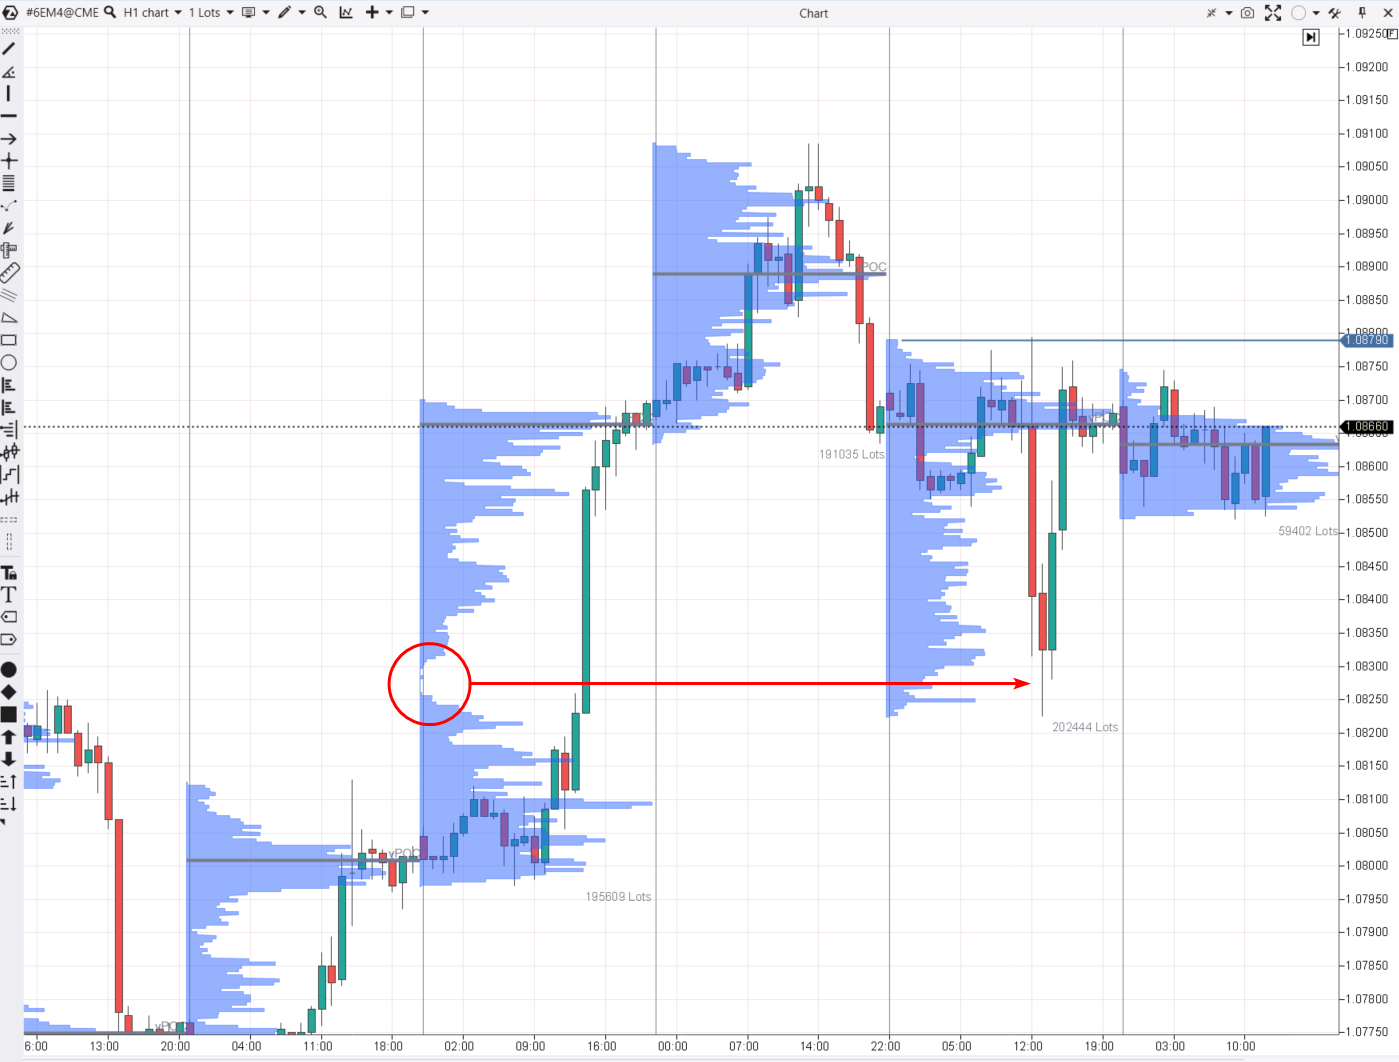
A bounce off a thin profile level
Next day, the price returned to the thin profile level (shown by an arrow) and bounced off it upward. Using the Volume Profile indicator, traders could buy near the low that day.
Example 2. A bounce off a high volume level
Below is an example from the Bitcoin futures market on Binance.
The red rectangle marks the area where most contracts were traded for 2 days. The market was in a temporary balance.
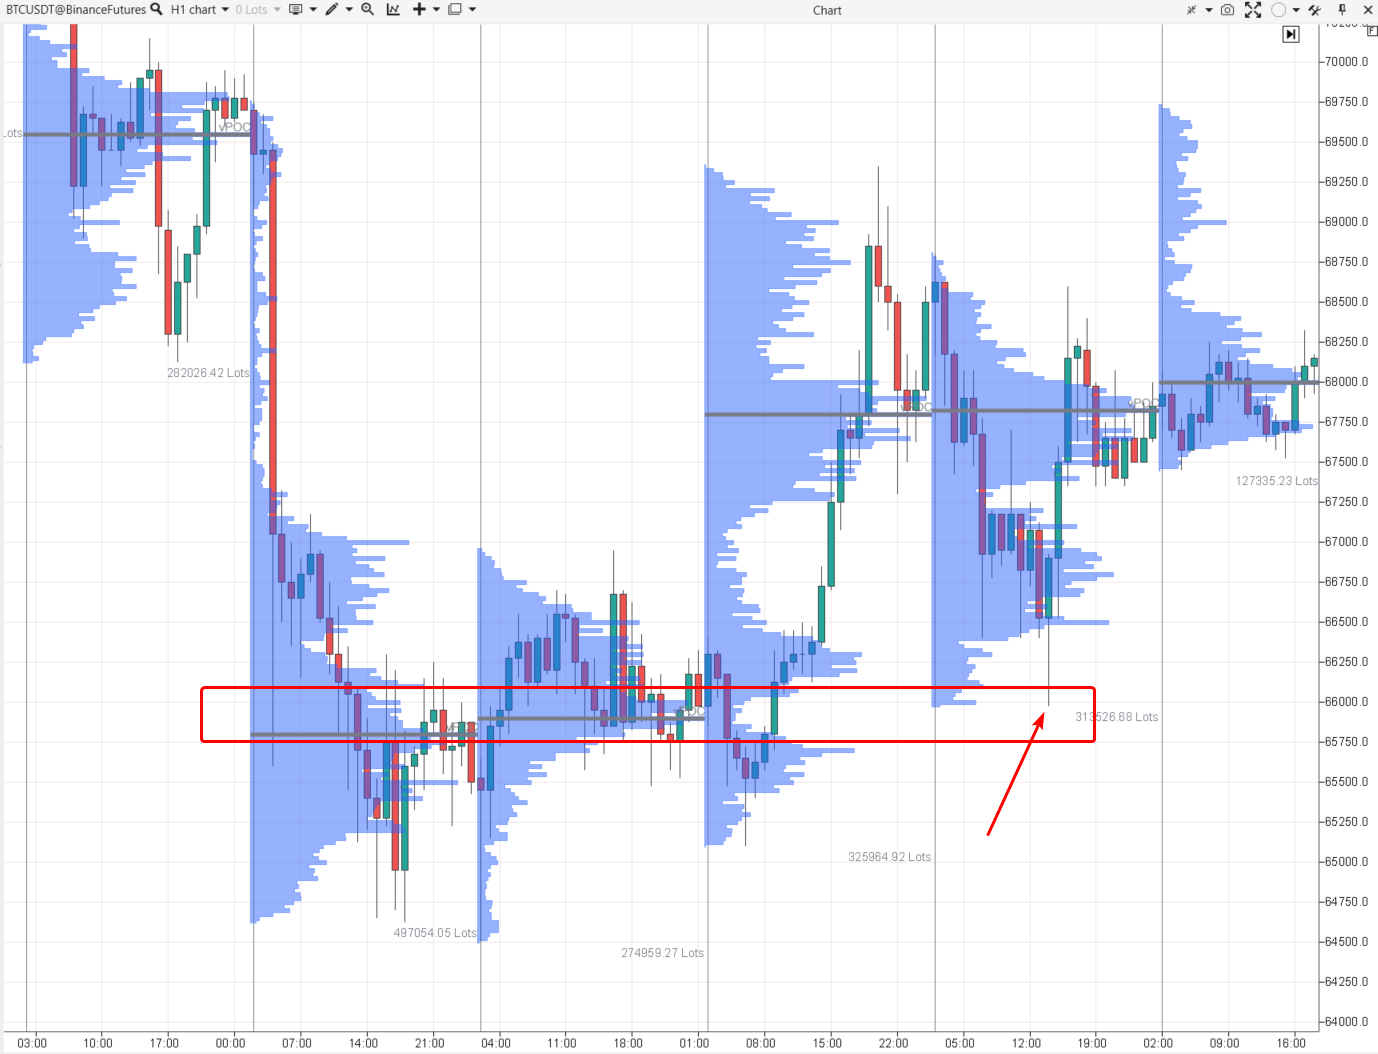
A bounce off a high volume level
On the third day, the price went up, which was a signal that a bullish trend could form in the market.
On the fourth day, a high volume level was tested (shown by an arrow). That moment could be used by Volume Profile readers to enter long positions in expectation of an uptrend.
The S&P-500 futures chart below gives even more examples of how high volume levels can work as support or resistance.
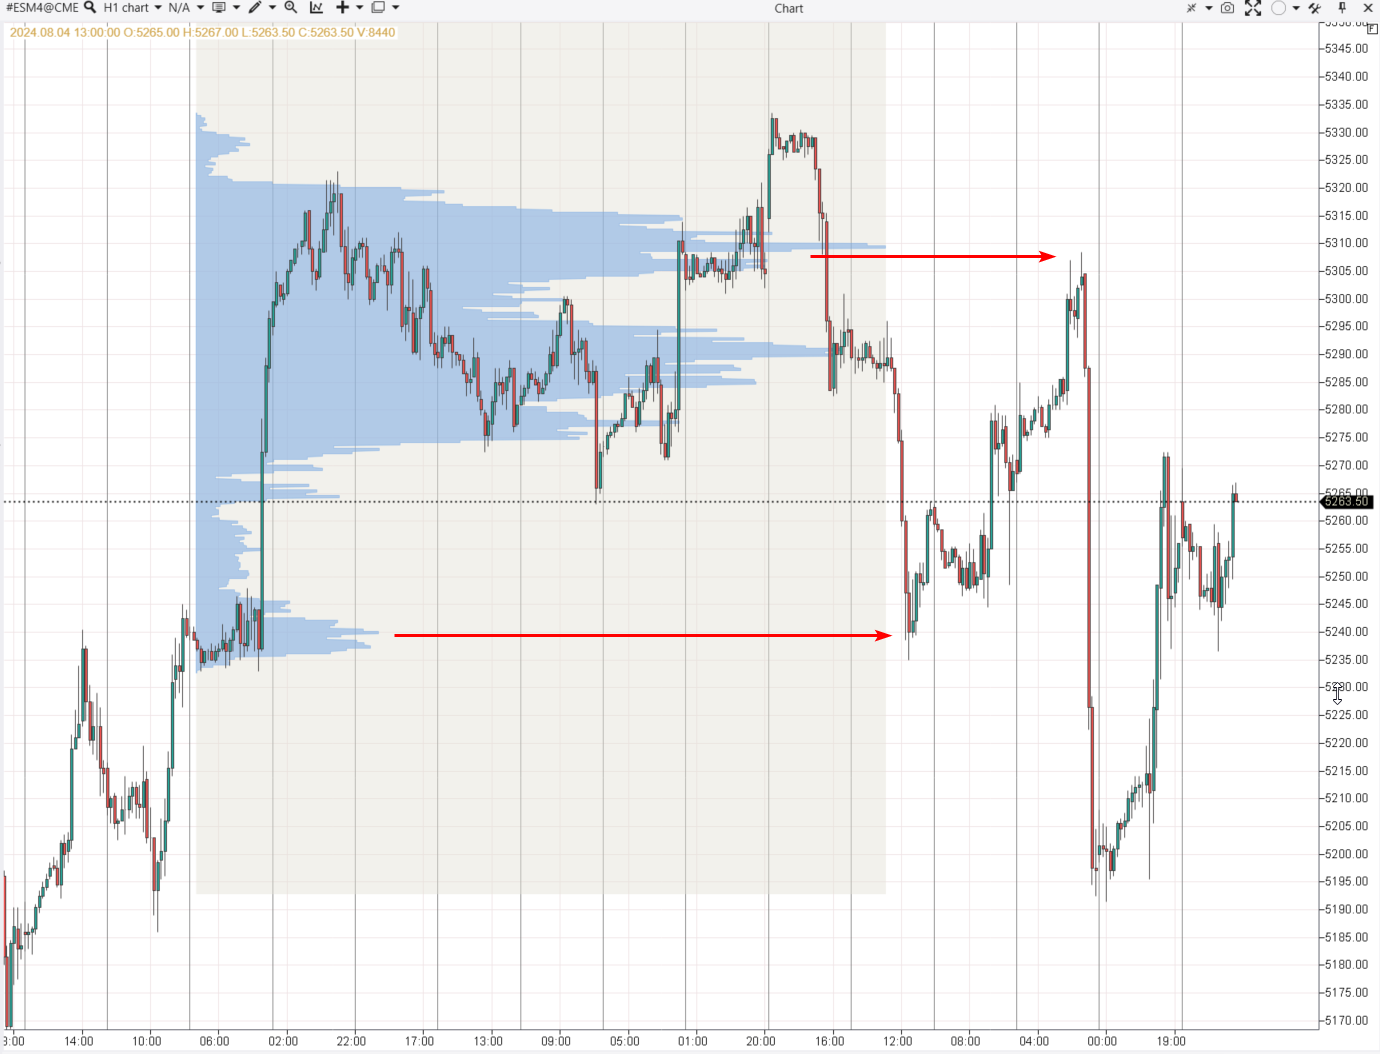
Bounces off high volume levels
When the price goes back to the level where many trades were conducted, it means that many participants are either reducing or increasing their positions in accordance with their strategies. That’s my explanation. There may be other reasons, but in any case, bounces off Point of Control levels occur too often to be considered accidental.
Is Volume Profile a good indicator?
The use of Volume Profile does not guarantee advantages.
👍 Volume Profile strengths:
• Valuable information for market analysis. Volume Profile enables traders to see the price levels where the highest/lowest volumes were traded, which can indicate key zones of support and resistance
• Improved understanding of market contexts. The indicator helps to analyze market activity and changes in market stages – from balance (flat) to imbalance (trend) and back
• Help in making decisions about entries and exits. Understanding where trading volumes are concentrated, traders can find optimal points for entering or exiting positions
• Versatility. The indicator can be applied for various timeframes and assets, such as stocks, cryptocurrencies, and currency futures
👎 Volume Profile weaknesses:
• Complexity of use for beginners. Effective application of Volume Profile requires that traders understand market structures and have experience in analyzing volume data, which can be difficult for beginners
• Dependence on data quality. The indicator’s effectiveness is highly dependent on the quality and accuracy of trading volume data. Inaccurate or delayed data can lead to incorrect analytical conclusions
• Dependence on software. Work with volume profiles usually requires advanced market analysis tools
How do you use volume profiles?
I use the Volume Profile indicator featured by ATAS.
This indicator helps determine the levels where corrections end and new balances begin.
For example:
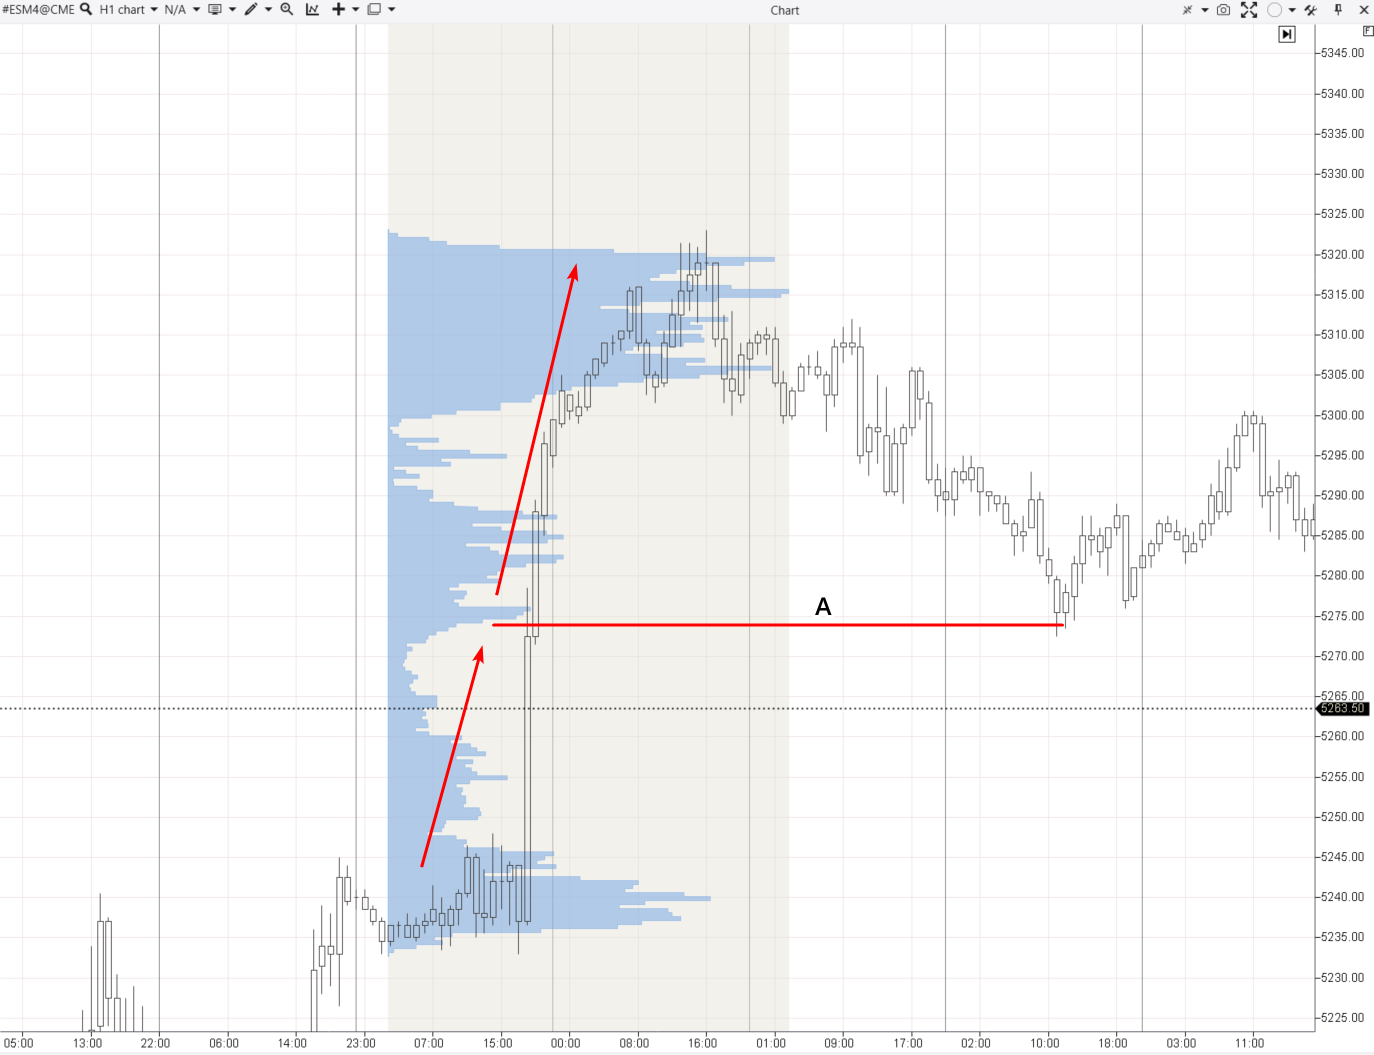
How to determine a correction end level using a volume profile
The arrows show that the price moved upward actively, indicating an imbalance and a lack of sellers. A convex formed near level “A”. Such a level often becomes the end of a downward correctional movement after an upward impulse and marks the beginning of a new balance of supply and demand.
If you have questions regarding this article, contact me on LinkedIn.
Summary
Volume Profile is a powerful tool for a deep understanding of market structures and dynamics of supply and demand at different price levels. While it is somewhat difficult to master and dependent on data quality, its ability to find key zones of activity makes this tool irreplaceable for experienced market participants and necessary to master for beginners.


Team that worked on the article

For over 15 years, Oleg worked as a copywriter and journalist at advertising and marketing agencies, as well as radio and television companies. His writing style is aimed at using simple terms to explain only those things that matter to the reader – benefits, risks, and realizable ideas. During the 2008 financial crisis, Oleg got interested in the stock and Forex markets and thoroughly explored price action to start working as an independent expert in 2018.

Dr. BJ Johnson is a PhD in English Language and an editor with over 15 years of experience. He earned his degree in English Language in the U.S and the UK. In 2020, Dr. Johnson joined the Traders Union team. Since then, he has created over 100 exclusive articles and edited over 300 articles of other authors.

Mirjan Hipolito is a journalist and news editor at Traders Union. She is an expert crypto writer with five years of experience in the financial markets. Her specialties are daily market news, price predictions, and Initial Coin Offerings (ICO).