How To Use Stock Trading Tools And Indicators?


Editorial Note: While we adhere to strict Editorial Integrity, this post may contain references to products from our partners. Here's an explanation for How We Make Money. None of the data and information on this webpage constitutes investment advice according to our Disclaimer.
How to use stock trading tools and indicators:
Understand the basics about scanners, strategy builders, calendars, etc.
Choose a trading platform.
Set up your charts.
Apply indicators.
Combine indicators.
Analyze patterns.
Develop a strategy.
Traders use various tools to improve their performance, such as scanners, strategy builders, calendars, condition signals, oscillators, and fundamental reports . Using stock trading tools and indicators effectively requires a combination of understanding their functions and integrating them into a comprehensive trading strategy. Utilize charting tools to visually analyze stock price movements and patterns. Combine different tools and indicators to confirm signals and avoid relying on a single tool for trading decisions. Today, we'll explore how to use these trading tools and indicators effectively.
How to use stock trading tools and indicators?
Using stock trading tools and indicators effectively involves a systematic approach to analyzing market data and making informed trading decisions. Here’s a step-by-step guide to help you get started:
Understand the basics: Before diving into the use of trading tools and indicators, make sure you understand basic stock market concepts and the purpose of each tool. Traders use various tools to improve their performance, such as scanners, strategy builders, calendars, condition signals, oscillators, and fundamental reports. Common indicators include moving averages, Relative Strength Index (RSI), MACD, Bollinger Bands, tick and exchange volume indicators.
Choose a trading platform: Select a reliable trading platform that offers a wide range of tools and indicators. Popular platforms include MetaTrader 4, MetaTrader 5, TradingView, Thikorswim, Ninjatrader and others. These platforms provide charting capabilities and access to various technical indicators.
Also you need to choose a reliable stock broker. This table provides a comparison of the best stock brokers for trading, highlighting their key features, trading platforms, commission fees, minimum deposit requirements:
| Broker | Demo account | Minimum deposit, $ | Interest rate | Android App | iOS App | Stocks/ETFs Fee per share basic | Foundation year | Open an account |
|---|---|---|---|---|---|---|---|---|
YES | $0 | $0 | YES | YES | $0 | 2007 | Open an account Your capital is at risk.
| |
YES | £500 | 4.56% | YES | YES | U.S. Stocks: start from $1. European Stocks: start from €3/ UK Stocks: start from £5. | 1992 | Open an account Your capital is at risk. | |
YES | $2000 | 3.8% | YES | YES | US Stocks: $0.01 per share; min fee of $2, max of 1% of the trade value. EU Stocks: 0.1% of trade value with a min fee of €4 and a max of €99. | 2001 | Open an account Your capital is at risk.
| |
YES | $0 | 0,15-1% | YES | YES | After exceeding the free trades, the fee is 0.25% of the order amount, with a min fee of £1.00 (or equivalent in other currencies) | 2015 |
Set up your charts: Start by setting up your charts with the relevant stock or asset you want to analyze. Customize the time frames based on your trading style — whether you’re a day trader, swing trader, or long-term investor.
Apply indicators: Add your chosen indicators to the charts. For example, you can add moving averages to identify trends, RSI to gauge overbought or oversold conditions, MACD for trend confirmation and momentum, and Bollinger Bands for volatility and price range analysis.
Combine indicators: Use a combination of indicators to get a more comprehensive view of the market. For instance, combine moving averages with MACD to confirm trend direction, or use RSI with Bollinger Bands to identify potential reversal points.
Analyze patterns: Look for chart patterns such as head and shoulders, double tops and bottoms, triangles, and flags. These patterns can provide insights into potential market movements and help you make more informed trading decisions.
Develop a strategy: Based on your analysis, develop a trading strategy that incorporates the signals from your indicators. Define entry and exit points, set stop-loss levels to manage risk, and determine your position size.
By understanding and effectively using stock trading tools and indicators, you can enhance your ability to analyze the market, make informed decisions, and improve your overall trading performance.
Basics of using tools and indicators for stock trading
Technical indicators and tools are crucial for predicting stock or asset movements. Typically mathematical, they help traders analyze past data to forecast future price trends and patterns. Traders rely on charts and indicators to interpret price moves, while fundamentalists focus on economic data and corporate reports.
Key tools and indicators for stock trading
Economic calendars: An economic calendar lists important events that may impact security prices or the overall market. Traders use these calendars to plan trades and adjust portfolios based on future and past financial events.
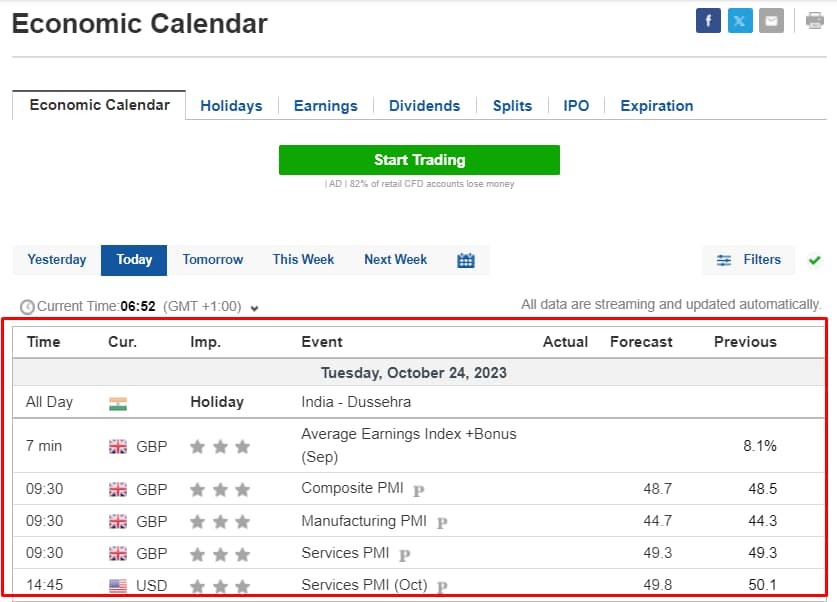 Economic calendar
Fundamental stock analysis focuses on the company that issued the stock. The company's financial performance, its management, competitive advantages, the market in which it operates, and other internal factors are analyzed.
In addition to the standard economic calendar, you should use the company reporting calendar:
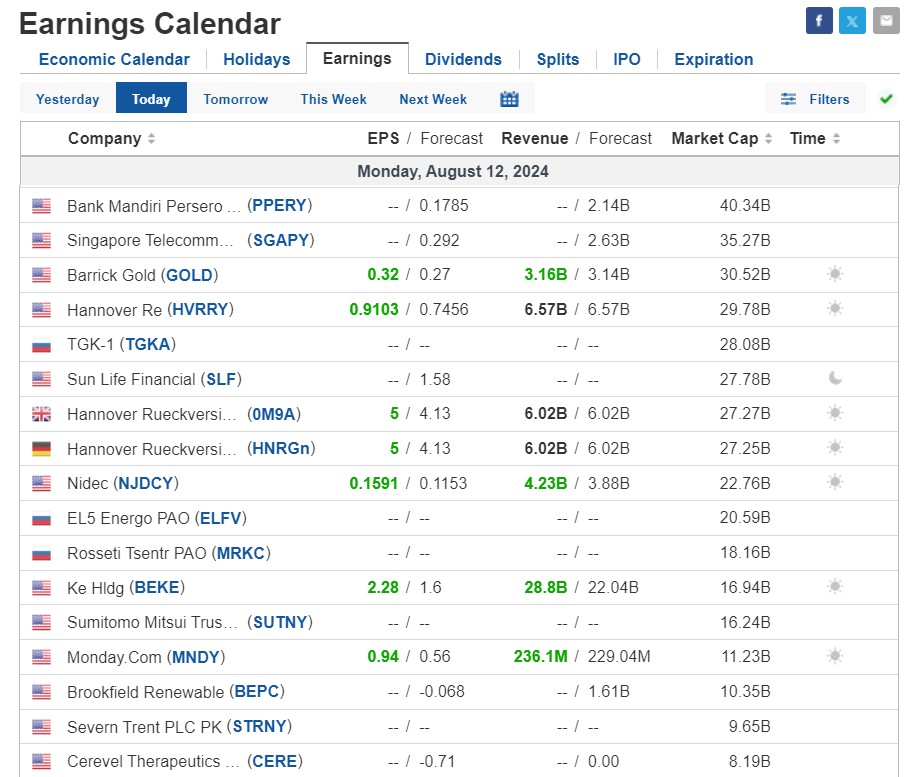 Earnings Calendar
and dividend calendar to trade stocks:
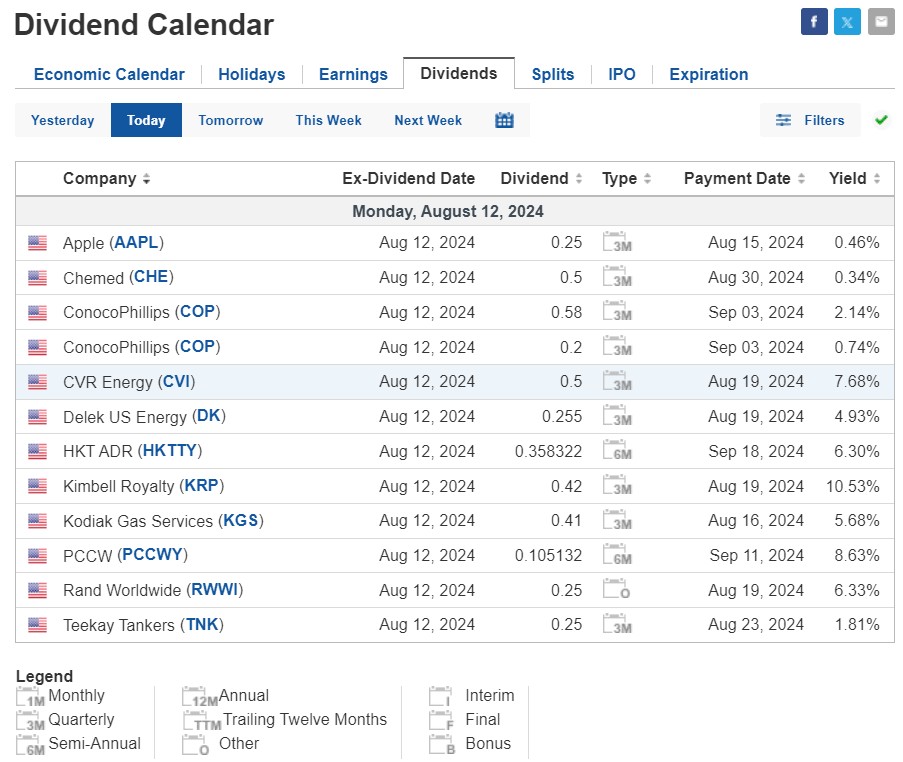 Official Dividend Payment Schedule
Condition-based signals: These signals trigger buy or sell actions based on set criteria, helping to reallocate portfolios or take new positions. They offer objectivity and consistency but can also produce false signals and bias.
Filters and scanners: With over 60,000 global stocks, filters and scanners narrow choices based on specific criteria. They provide detailed data but can delay decisions and miss potential trades.
Strategy builders and testers: These tools allow traders to create and test strategies, improving risk management and trade efficiency. However, backtesting may not guarantee future success.
Following tools: Tools like Commitments of Traders reports and trade copiers help source market-impacting information, optimizing portfolios.
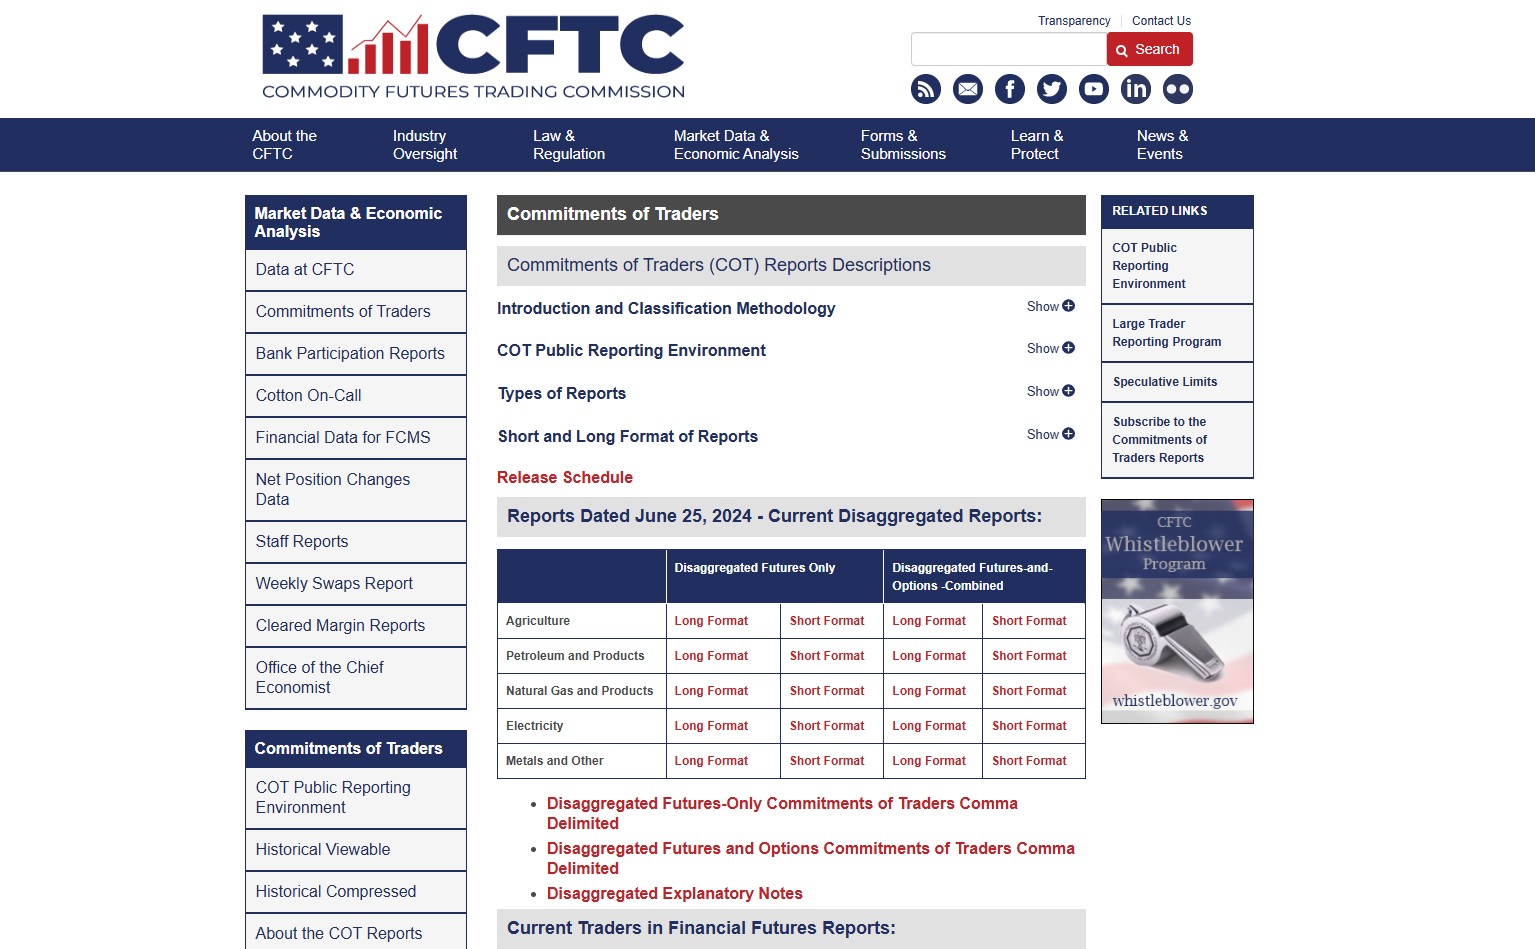 CFTC website
Organizers: Trading journals organize chart work across different sectors and timeframes, aiding in portfolio management.
Tools for technical analysis: These tools analyze market data to assist in investment decisions, using chart patterns and indicators.
Fundamental reviews and statistics: These reviews determine a stock's fair market value, analyzing ratios like P/B, Debt/Equity, EPS, P/E, and RoE. While they provide value insights, they may not predict future trends accurately.
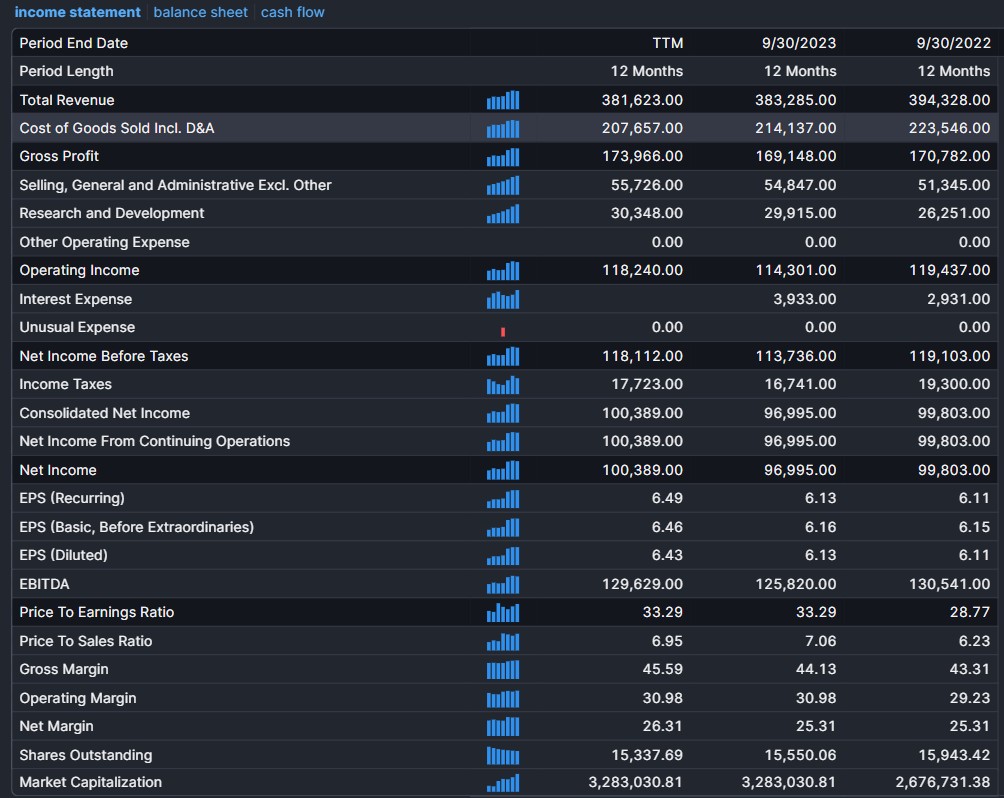 AAPL fundamental analysis
Tools for sentiment analysis: Sentiment analysis tools evaluate the emotional tone of digital texts, using indicators like the Greed Fear Indicator and Social Media Scanners.
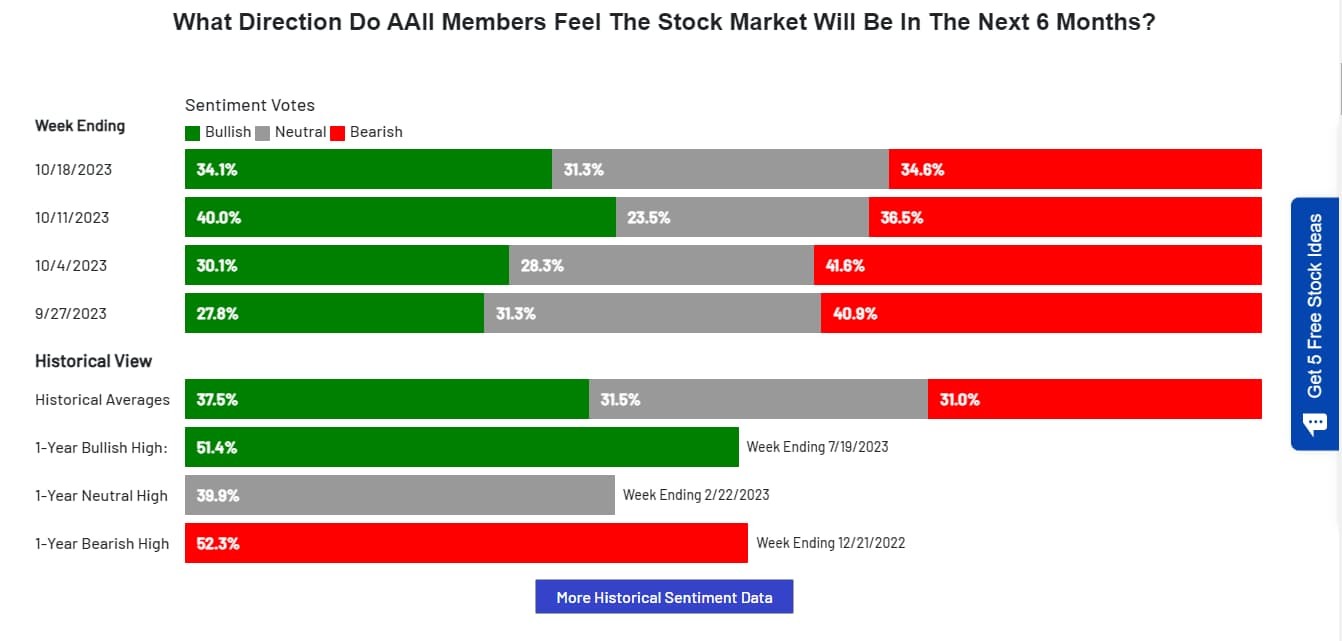 Tools for sentiment analysis
Technical indicators and oscillators
Technical indicators and oscillators are essential tools for traders to understand market dynamics, including trends, momentum, and volatility. These tools use mathematical formulas based on historical data like price, volume, and time to generate signals on charts.
Technical indicators help traders analyze past price data to predict future price movements. They can be categorized into several types:
Trend Indicators: These help identify the market direction. Examples include Moving Averages (MA), Moving Average Convergence Divergence (MACD), and Average Directional Index (ADX). A simple moving average smooths out price data, while MACD uses two moving averages to gauge momentum.
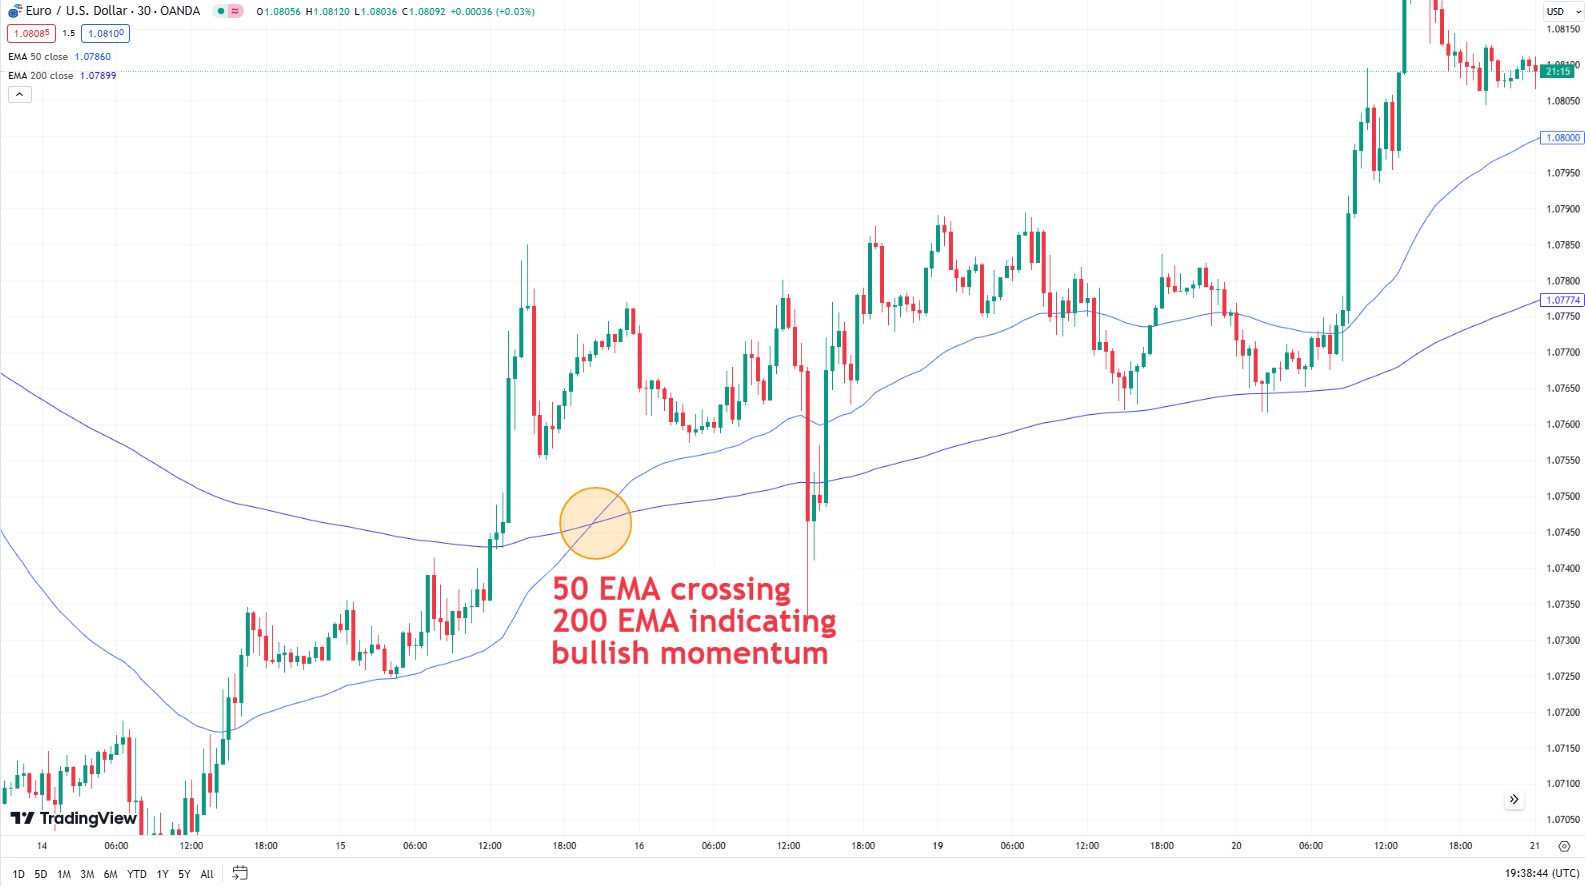 Use of Moving average on charts
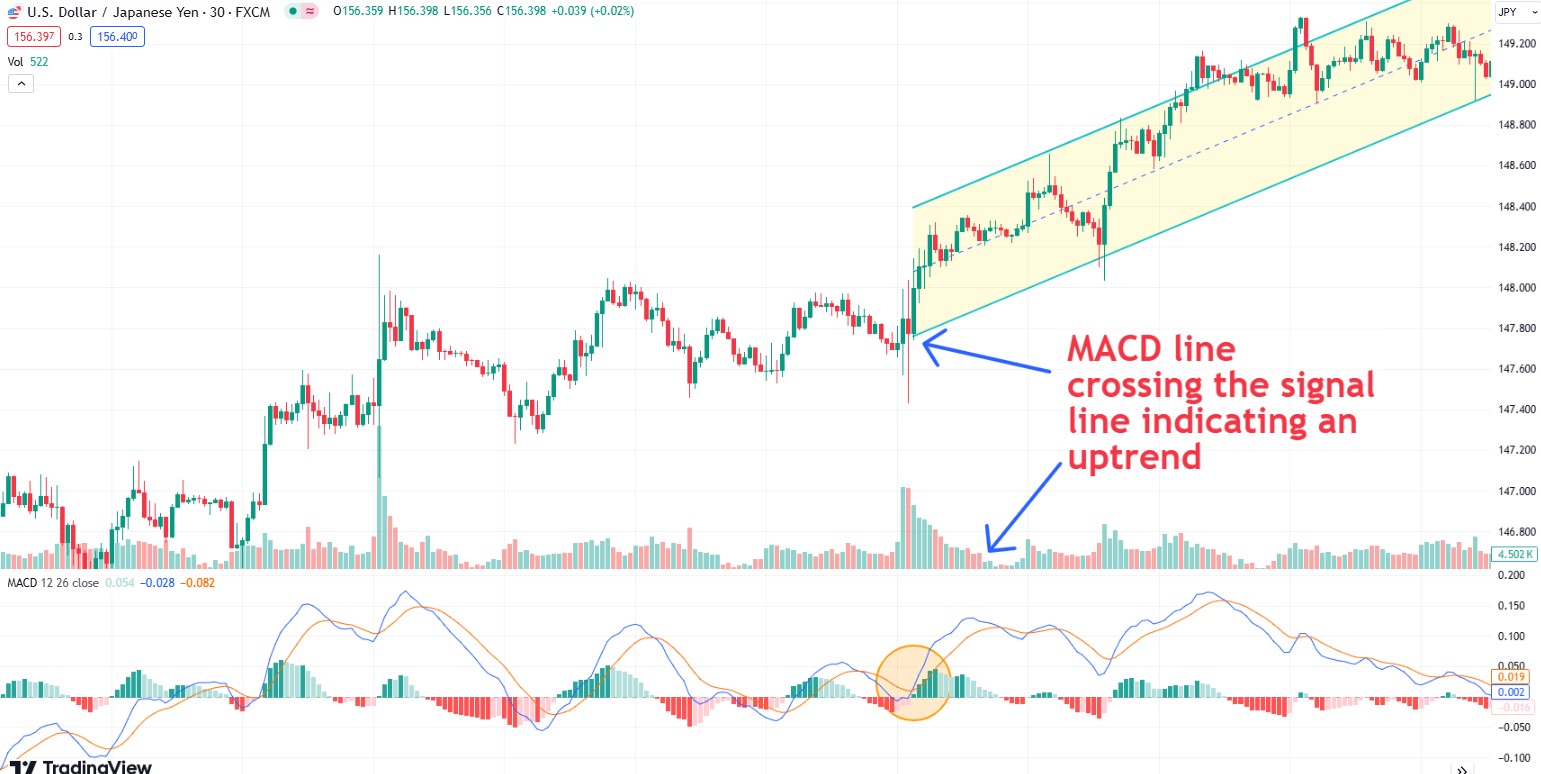 Use of MACD on charts
Momentum Indicators: These measure the speed of price changes and help identify overbought or oversold conditions. Examples include the Relative Strength Index (RSI) and Stochastic Oscillator. RSI compares recent gains to recent losses to determine if a stock is overbought or oversold.
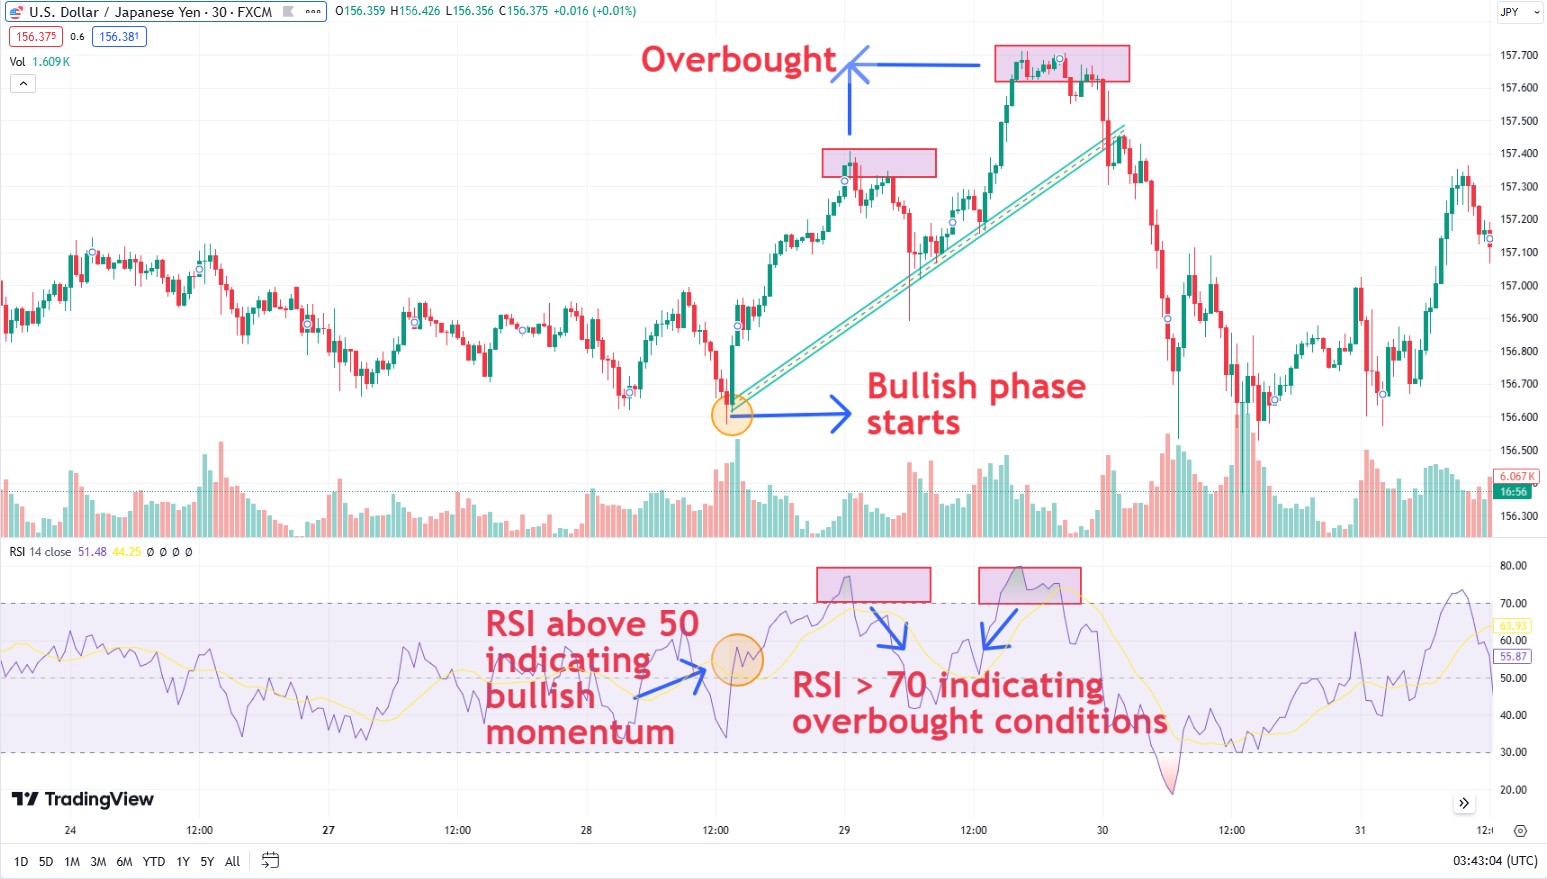 Use of RSI on charts
Volatility Indicators: These measure price fluctuations. Bollinger Bands and Average True Range ( ATR ) are common volatility indicators. Bollinger Bands adjust according to market volatility, indicating overbought or oversold conditions.
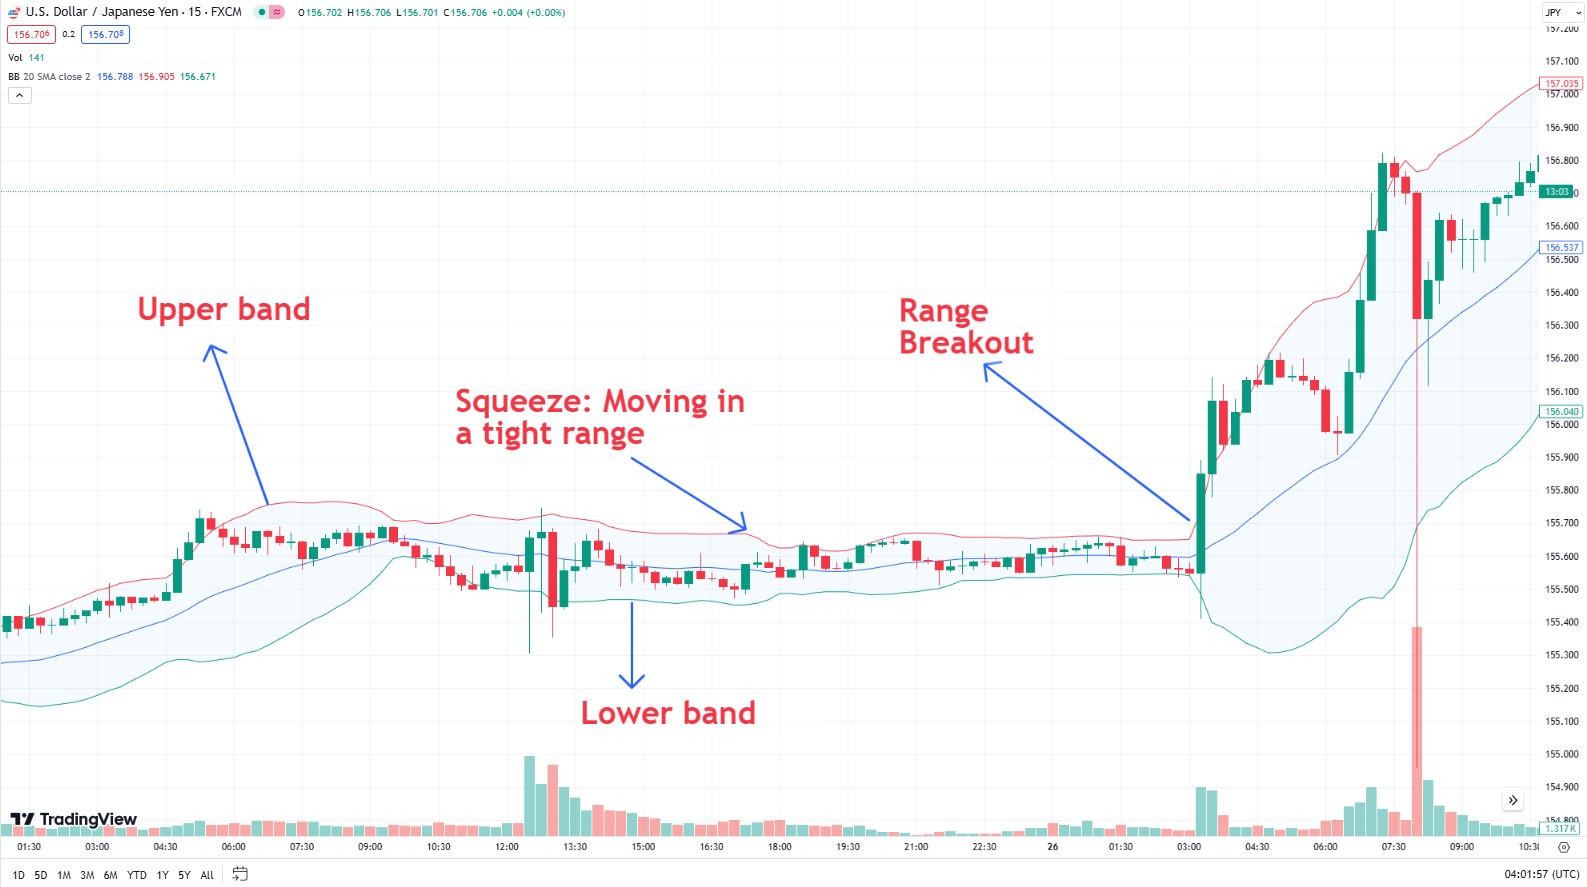 Use of Bollinger bands on chart
Volume Indicators: These analyze the strength of price movements by looking at trading volumes. On-Balance Volume (OBV) combines price and volume to show how volume changes affect the price.
Oscillators are a type of technical indicator that fluctuate within a fixed range, typically between 0 and 100. They help identify short-term overbought or oversold conditions.
Relative Strength Index (RSI): RSI ranges from 0 to 100, with levels above 70 indicating overbought conditions and below 30 indicating oversold conditions. It helps identify potential reversal points.
Stochastic Oscillator: This compares a closing price to a range of prices over a specific period, also ranging from 0 to 100. Values above 80 are overbought, and below 20 are oversold.
MACD: Although primarily a trend-following indicator, MACD also functions as an oscillator, fluctuating above and below a zero line. The MACD histogram shows the difference between the MACD line and the signal line, providing buy and sell signals.
Using technical indicators and oscillators together
Combining multiple indicators can provide a comprehensive analysis. For example, using RSI alongside MACD can help confirm signals. If both indicate an overbought condition, it may be a stronger signal to sell.
Example strategy:
RSI and Bollinger Bands: When RSI indicates an overbought condition and the price touches the upper Bollinger Band, it can be a strong signal to consider selling.
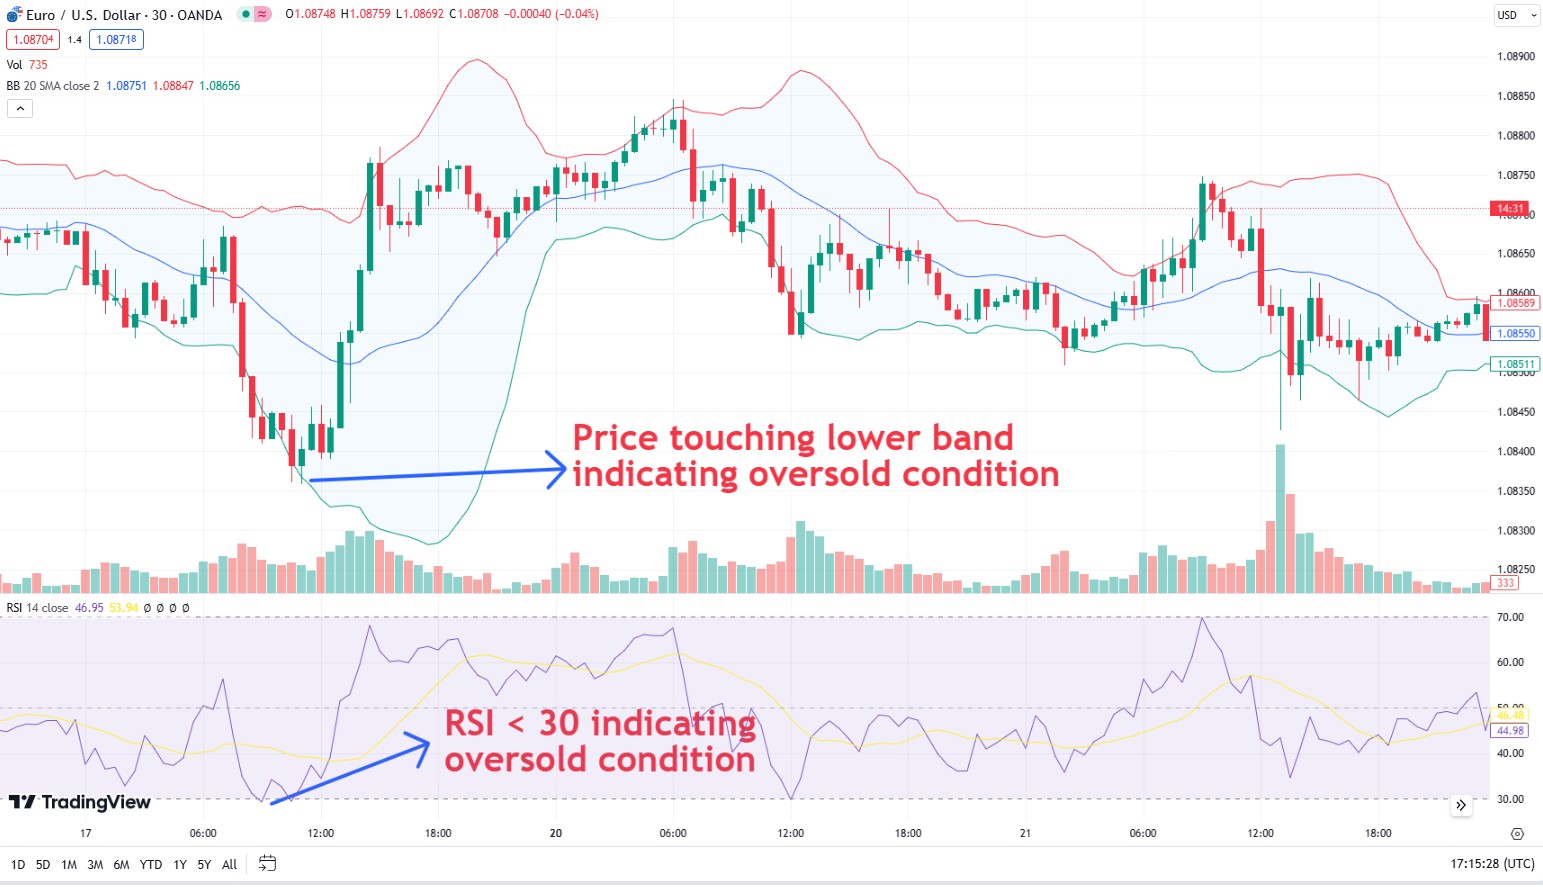 Combined use of RSI with Bollinger bands
MACD and Moving Averages: If the MACD line crosses above the signal line while the price is above the moving average, it can indicate a strong buy signal.
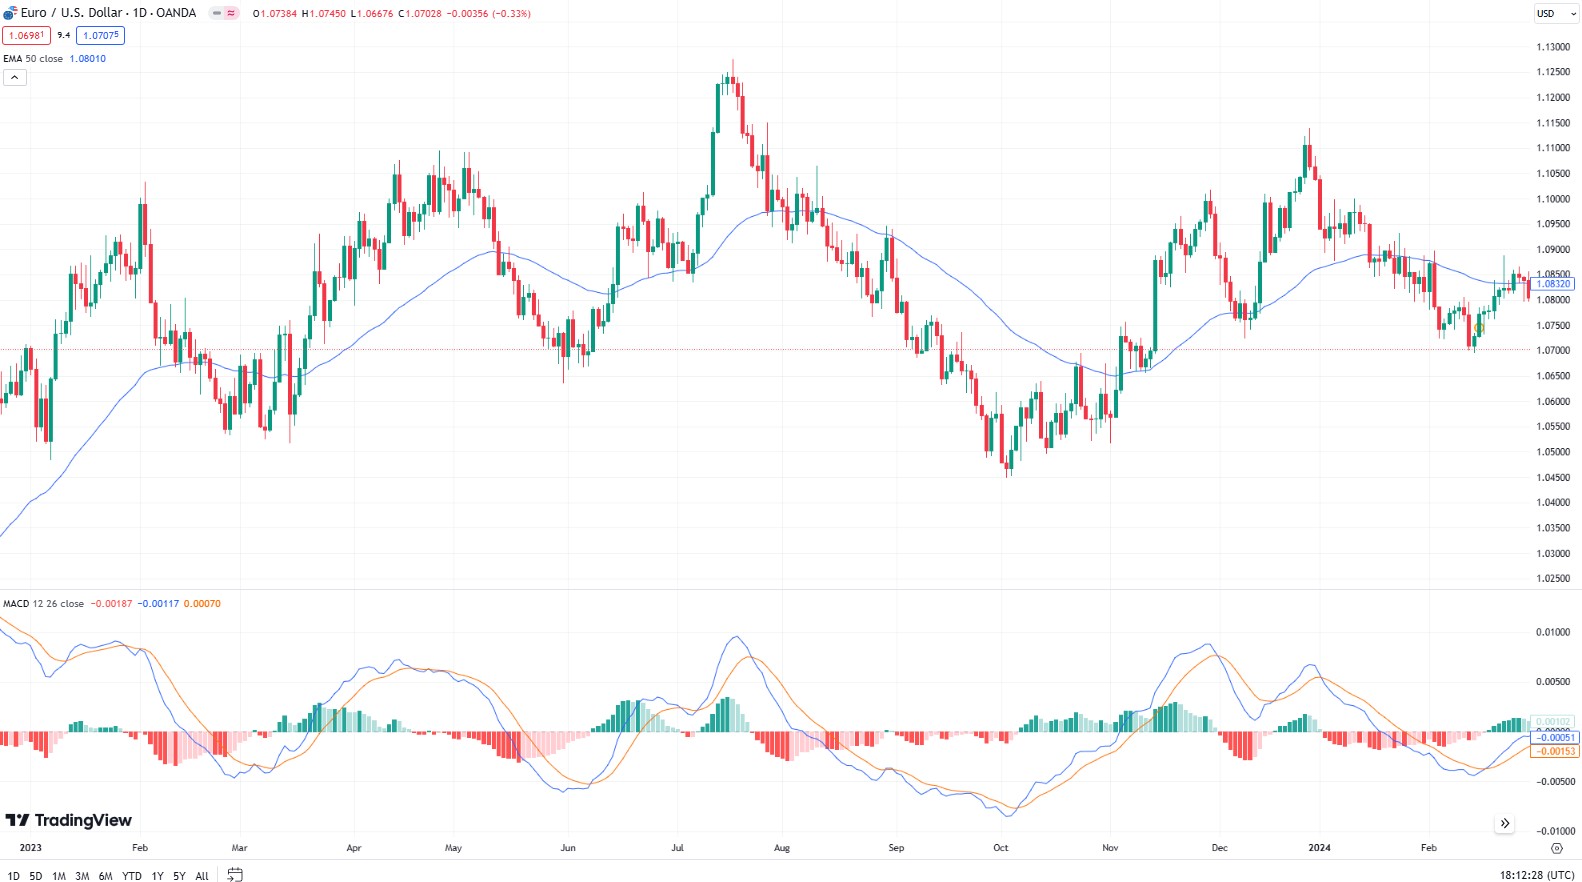 Use of MACD and MA together
 Using technical indicators and oscillators
Tips on using tools and indicators for stocks
Understanding how to use various tools and indicators for stock trading is crucial. Here are some beginner tips:
Use multiple indicators: Relying on just one tool is not enough. Using different indicators together can confirm trends and signals.
Avoid similar tools: Don't use indicators that provide the same type of data. Diverse tools give a broader perspective.
Optimize your indicators: Customize indicators to suit your trading style. Don't ignore stock fundamentals; they are also important.
Keep learning: Continually expand your knowledge and try new tools and indicators for more detailed data.
Read documentation: Understand each tool thoroughly by reading its documentation. This helps you utilize its full potential and avoid limitations.
Customize each tool to match the specific stock

When using stock market tools and indicators, I focus on integrating multiple, complementary indicators to get a comprehensive view of market conditions.
I customize each tool to match the specific stock or market I'm analyzing, ensuring relevance and accuracy. I also incorporate fundamental analysis to provide context beyond technical signals. Regularly updating my knowledge and exploring new tools keeps my strategies effective.
By understanding each tool's full capabilities through thorough documentation review, I can make well-informed trading decisions.
Summary
Stock market tools and indicators are crucial for investors and traders to analyze market data, make informed decisions, and optimize trading strategies. These tools offer functionalities such as charting, which visualizes historical and real-time data to identify trends, patterns, and price movements. By leveraging these tools and indicators, traders can enhance their market analysis, improve their timing, and increase their potential for profitable trades.
FAQs
What are chart indicators?
Chart indicators are tools that can be applied to a trading chart. Their goal is to help make the market far clearer to the trader in question. They can confirm if it's trending or ranging, for example.
Is it profitable to trade with indicators?
To be profitable, traders must conduct different strategies and utilize different tools. While indicators are convenient, they are just a derivative of price. They simply indicate what has happened but not what will happen.
Which indicators show support and resistance?
Traders and analysts use numerous indicators, including trend lines, moving averages, and pivot points. However, to truly utilize them, traders will first need to know what the best indicator for support and resistance is.
How do you choose technical indicators for stock trading?
Choosing the right technical indicators can be a challenge. However, this task can be achieved if traders focus on the effects within five categories of market research. These include trend, mean reversion, momentum, volume, and relative strength.
Related Articles
Team that worked on the article
Parshwa is a content expert and finance professional possessing deep knowledge of stock and options trading, technical and fundamental analysis, and equity research. As a Chartered Accountant Finalist, Parshwa also has expertise in Forex, crypto trading, and personal taxation. His experience is showcased by a prolific body of over 100 articles on Forex, crypto, equity, and personal finance, alongside personalized advisory roles in tax consultation.
Chinmay Soni is a financial analyst with more than 5 years of experience in working with stocks, Forex, derivatives, and other assets. As a founder of a boutique research firm and an active researcher, he covers various industries and fields, providing insights backed by statistical data. He is also an educator in the field of finance and technology.
As an author for Traders Union, he contributes his deep analytical insights on various topics, taking into account various aspects.
Mirjan Hipolito is a journalist and news editor at Traders Union. She is an expert crypto writer with five years of experience in the financial markets. Her specialties are daily market news, price predictions, and Initial Coin Offerings (ICO).
Risk management is a risk management model that involves controlling potential losses while maximizing profits. The main risk management tools are stop loss, take profit, calculation of position volume taking into account leverage and pip value.
Backtesting is the process of testing a trading strategy on historical data. It allows you to evaluate the strategy's performance in the past and identify its potential risks and benefits.
Volatility refers to the degree of variation or fluctuation in the price or value of a financial asset, such as stocks, bonds, or cryptocurrencies, over a period of time. Higher volatility indicates that an asset's price is experiencing more significant and rapid price swings, while lower volatility suggests relatively stable and gradual price movements.
Forex trading, short for foreign exchange trading, is the practice of buying and selling currencies in the global foreign exchange market with the aim of profiting from fluctuations in exchange rates. Traders speculate on whether one currency will rise or fall in value relative to another currency and make trading decisions accordingly. However, beware that trading carries risks, and you can lose your whole capital.
An investor is an individual, who invests money in an asset with the expectation that its value would appreciate in the future. The asset can be anything, including a bond, debenture, mutual fund, equity, gold, silver, exchange-traded funds (ETFs), and real-estate property.

-
 Afghanistan
-
 Albania
-
 Algeria
-
 Argentina
-
 Armenia
-
 Australia
-
 Austria
-
 Azerbaijan
-
 Bahamas
-
 Bahrain
-
 Bangladesh
-
 Belgium
-
 Botswana
-
 Brazil
-
 Brunei
-
 Bulgaria
-
 Burma
Burma
-
 Cambodia
-
 Cameroon
-
 Canada
-
 Chile
Chile
-
 China
China
-
 Colombia
-
 Costa Rica
-
 Cote d'Ivoire
-
 Croatia
-
 Cyprus
-
 Czech Republic
-
 Denmark
-
 Dominican Republic
-
 Ecuador
-
 Egypt
Egypt
-
 Estonia
-
 Eswatini
-
 Ethiopia
-
 Finland
-
 France
-
 Georgia
-
 Germany
-
 Ghana
Ghana
-
 Greece
-
 Haiti
Haiti
-
 Hong Kong
-
 Hungary
-
 India
India
-
 Indonesia
-
 Iran, Islamic republic
-
 Iraq
Iraq
-
 Ireland
-
 Israel
-
 Italy
Italy
-
 Jamaica
-
 Japan
Japan
-
 Jordan
-
 Kazakhstan
-
 Kenya
Kenya
-
 Korea
Korea
-
 Kuwait
-
 Kyrgyzstan
-
 Laos
Laos
-
 Latvia
-
 Lebanon
-
 Libyan Arab Jamahiriya
-
 Lithuania
-
 Luxembourg
-
 Macedonia
-
 Madagascar
-
 Malaysia
-
 Malta
Malta
-
 Mauritius
-
 Mexico
-
 Moldova
-
 Mongolia
-
 Montenegro
-
 Morocco
-
 Mozambique
-
 Namibia
-
 Nepal
Nepal
-
 Netherlands
-
 Nigeria
-
 Norway
-
 Oman
Oman
-
 Pakistan
-
 Palestine
-
 Papua New Guinea
-
 Peru
Peru
-
 Philippines
-
 Poland
-
 Portugal
-
 Puerto Rico
-
 Qatar
Qatar
-
 Romania
-
 Rwanda
-
 Saudi Arabia
-
 Serbia
-
 Singapore
-
 Slovakia
-
 Slovenia
-
 Somalia
-
 South Africa
-
 Spain
Spain
-
 Sri Lanka
-
 Sweden
-
 Switzerland
-
 Syrian Arab Republic
-
 Taiwan
-
 Tajikistan
-
 Tanzania, United Republic Of
-
 Thailand
-
 Trinidad and Tobago
-
 Tunisia
-
 Turkey
-
 UAE
UAE
-
 Uganda
-
 Ukraine
-
 United Kingdom
-
United States
-
 Uzbekistan
-
 Venezuela
-
 Vietnam
-
 Yemen
Yemen
-
 Zambia
-
 Zimbabwe
- Forex
- Crypto

