How To Use RSI Indicator To Trade Stocks

Over 50K supported assets, advanced trading platform
Here is how you can use RSI to trade stocks:
By analyzing recent price movements, RSI reveals when a stock might be overbought (ripe for a correction) or oversold (potentially ready to bounce back). However, using RSI effectively goes beyond just these basic signals. In this review, the experts at TU will explore how to use RSI's potential alongside other technical analysis strategies to make informed stock trading decisions.
-
Where can I find RSI for stocks?
You can find RSI (Relative Strength Index) on most trading platforms under the technical analysis tools section.
-
Do professional stock traders use RSI?
Yes, many professional stock traders use RSI as part of their technical analysis toolkit to assess market conditions and identify potential trading opportunities.
-
What is the best stock RSI settings?
The best RSI settings for stocks often include the default 14-day period. However, some traders may adjust the settings based on their trading style and the specific stocks they're analyzing.
-
How do you use RSI in stock trading?
RSI is used in stock trading to identify overbought and oversold conditions in the market. Traders look for RSI readings below 30 for potential buying opportunities and above 70 for potential selling opportunities, in conjunction with other technical indicators and analysis methods for confirmation.
Understanding RSI in stock trading
The Relative Strength Index (RSI) is like a tool that helps traders figure out if stocks are worth buying or selling. It works by looking at how prices have been changing recently, giving a score between 0 and 100. This score can tell traders if a stock is either overbought or oversold. When the RSI is below 30, it suggests that a stock might be oversold, meaning it could be a good time to buy. On the flip side, if the RSI is above 70, it suggests that a stock might be overbought, indicating it could be a good time to sell. If the RSI is around 50, it means the market is pretty neutral. Traders often use the RSI alongside other tools to decide when to buy or sell stocks.
The formula for calculating RSI is: 100 – [100 / ( 1 + (Average Gain During Up Periods / Average Loss During Down Periods ))]
Sometimes, though, RSI scores above 70 or below 30 don't always mean a definite buy or sell. Here's why:
Firstly, the RSI works best when the market is moving within a certain range, not shooting up or down too quickly. If the market is going strongly in one direction, the RSI might stay in the overbought or oversold zone for a long time, which makes it less reliable.
Secondly, traders often use other tools alongside the RSI to get a clearer picture. Things like moving averages or support and resistance levels can help confirm whether it's a good time to buy or sell.
Lastly, sometimes there's a difference between what the RSI says and what the stock price is doing. For example, if the stock price keeps going up but the RSI doesn't, it might mean that the uptrend is getting weaker.
To make the most of the RSI, TU expert Mikhail Vnuchkov suggests that traders should keep a few things in mind:
-
Watch for RSI changes: If the RSI crosses above 30 or below 70, it could be a sign that it's time to buy or sell.
-
Think about the bigger picture: It's important to look at what's happening in the overall market and consider other tools before making decisions based solely on the RSI.
Best Stock Brokers


How to apply and read the RSI indicator in stock trading?
Here's a step-by-step guide on how to use and understand RSI:
Choose your trading platform
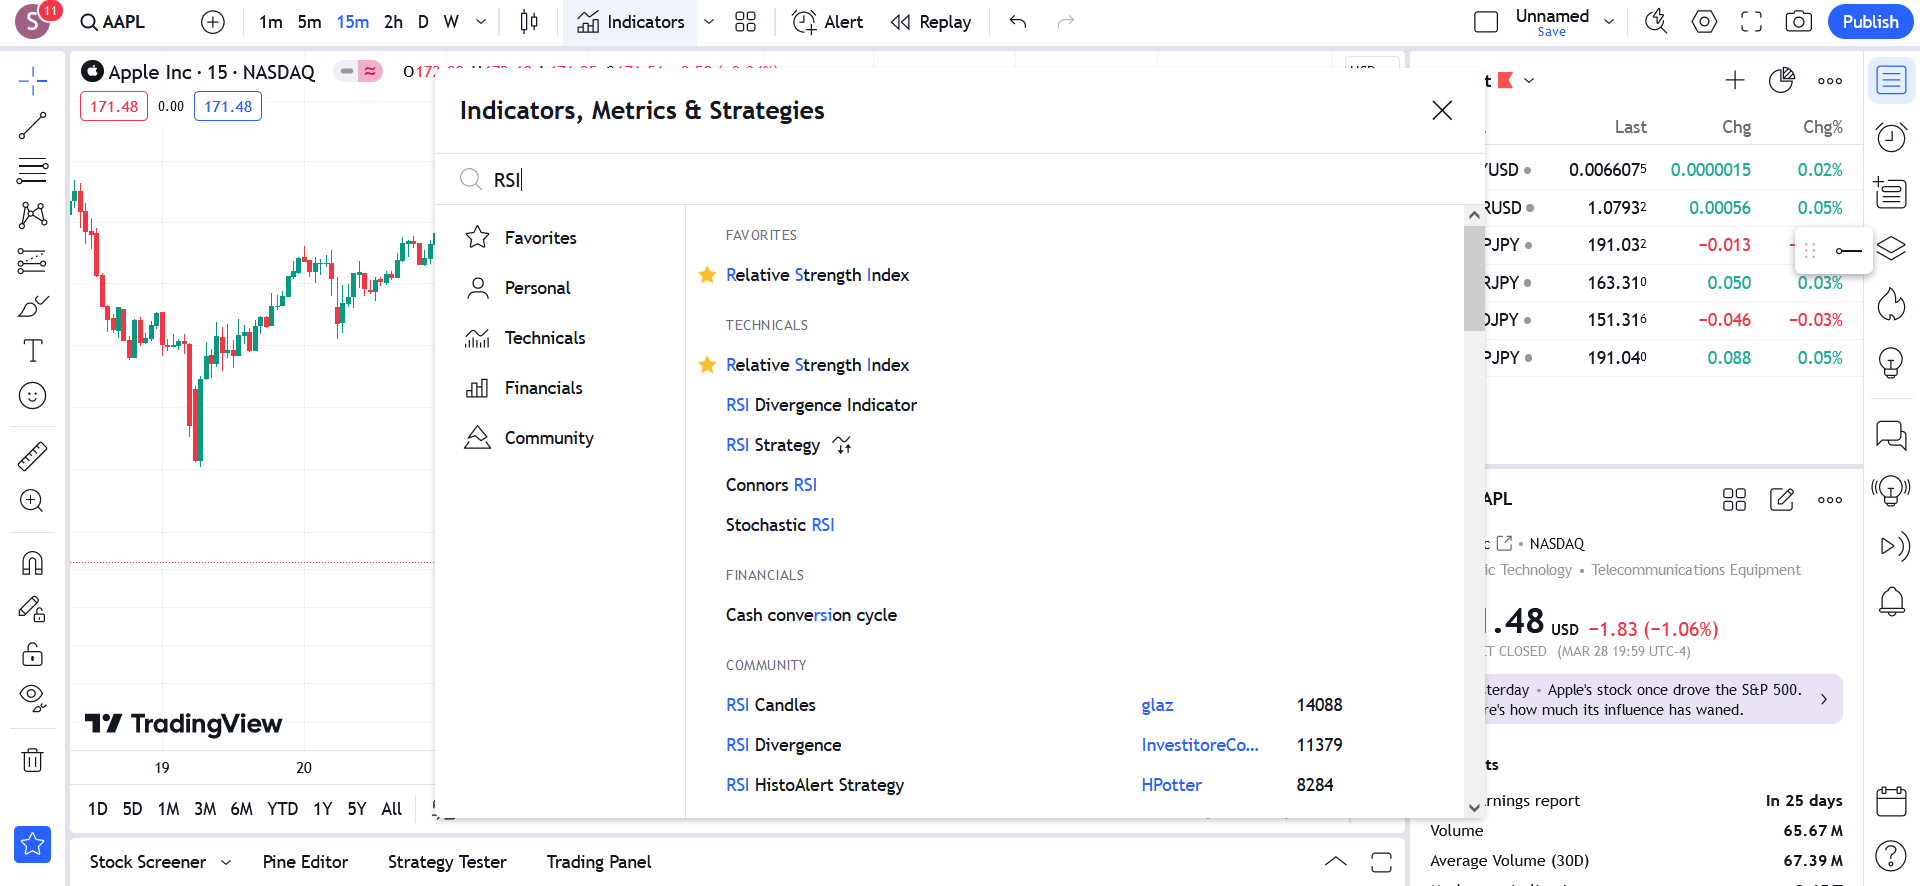
Selecting the RSI indicator
First, make sure your trading platform has the RSI indicator. Most platforms offer this tool as part of their technical analysis options.
Set your RSI parameters
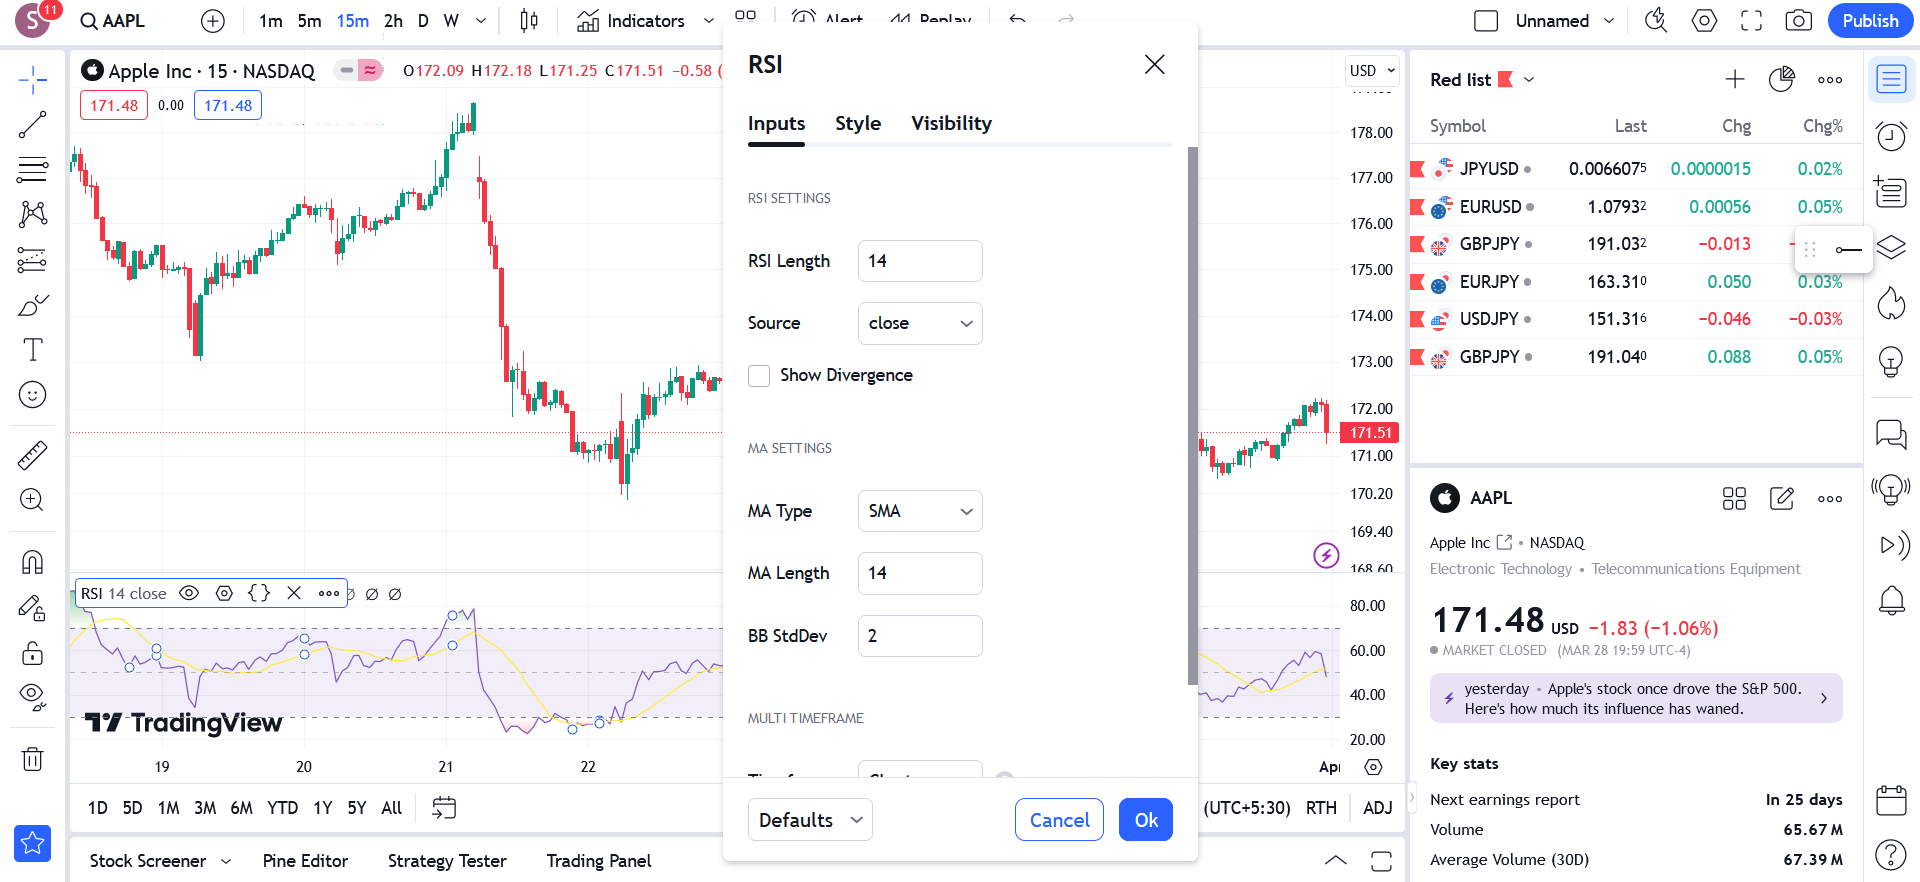
Setting RSI parameters
The standard calculation for RSI looks at a 14-day period, but you can adjust this based on your trading style and the specific stock you're analyzing. Shorter periods react more quickly to recent price changes, while longer periods give a smoother picture.
Identify the RSI levels
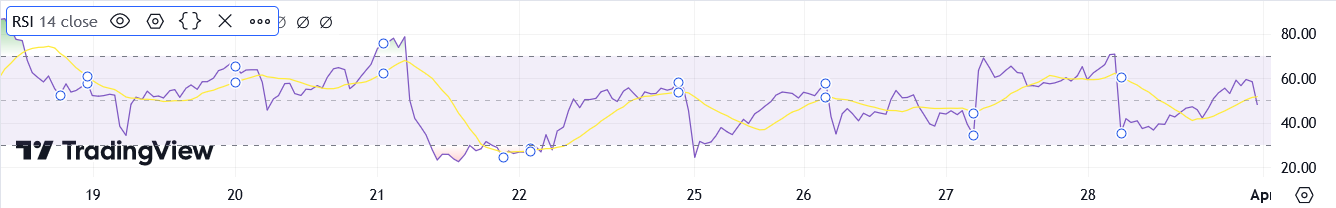
Identifying RSI Levels
The common RSI levels to watch are 30 for oversold and 70 for overbought. Some traders also use 20 and 80 for more extreme readings. These levels are usually shown as lines on the RSI chart.
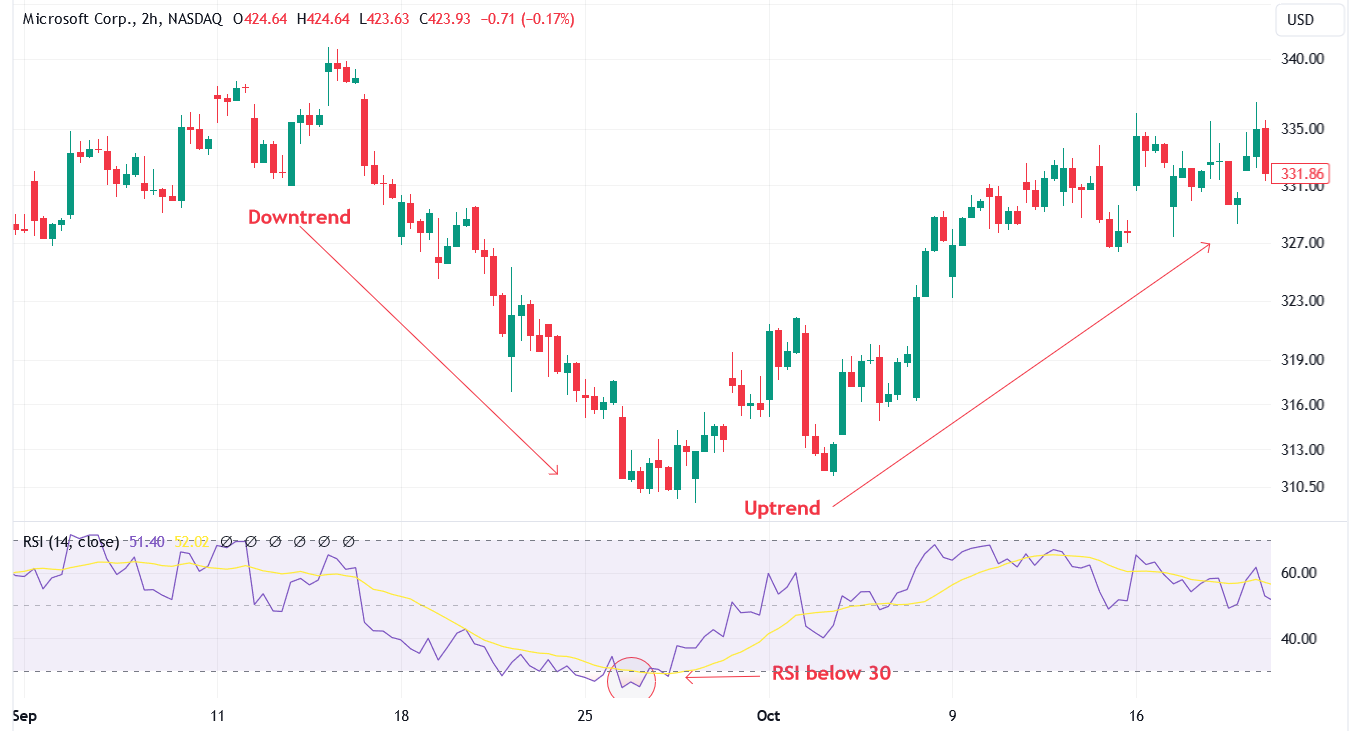
Analyze the RSI line
The RSI line moves between 0 and 100. Here's what it means:
-
Overbought: If the RSI goes above 70, it might mean the stock is overbought and could see a price drop.
-
Oversold: If the RSI falls below 30, it could mean the stock is oversold and might be due for a price increase.
Consider the trend
RSI readings work best when the market is moving in a range. In strong trends, like big upswings or downswings, the RSI might stay over 70 or under 30 for a long time. So, think about the overall market trend too.
Look for RSI reversals
When the RSI crosses above 30 (from below) or below 70 (from above), it could signal a change in trend.
Combine with other indicators
Don't rely only on RSI. Use it along with other tools like moving averages or support/resistance levels to confirm your trading decisions.
Divergence
Keep an eye out for differences between the RSI and the price chart. For instance, if the price keeps going up but the RSI doesn't, it might mean the uptrend is weakening.
Practice and refine
Like with any trading tool, practice using RSI with past data to see how it works in different situations. This will help you improve your trading strategy over time.
RSI trading strategies for stock trading
The RSI (Relative Strength Index) provides a variety of strategies for stock traders. Here's an explanation of the main approaches:
Basic overbought/oversold strategy
Overbought/oversold strategy
This strategy involves entering a long position (buy) when the RSI falls below 30 (considered oversold) and exiting the position when the RSI rises above 70 (considered overbought). The goal is to take advantage of potential price reversals after the stock reaches extreme levels.
RSI divergence strategy
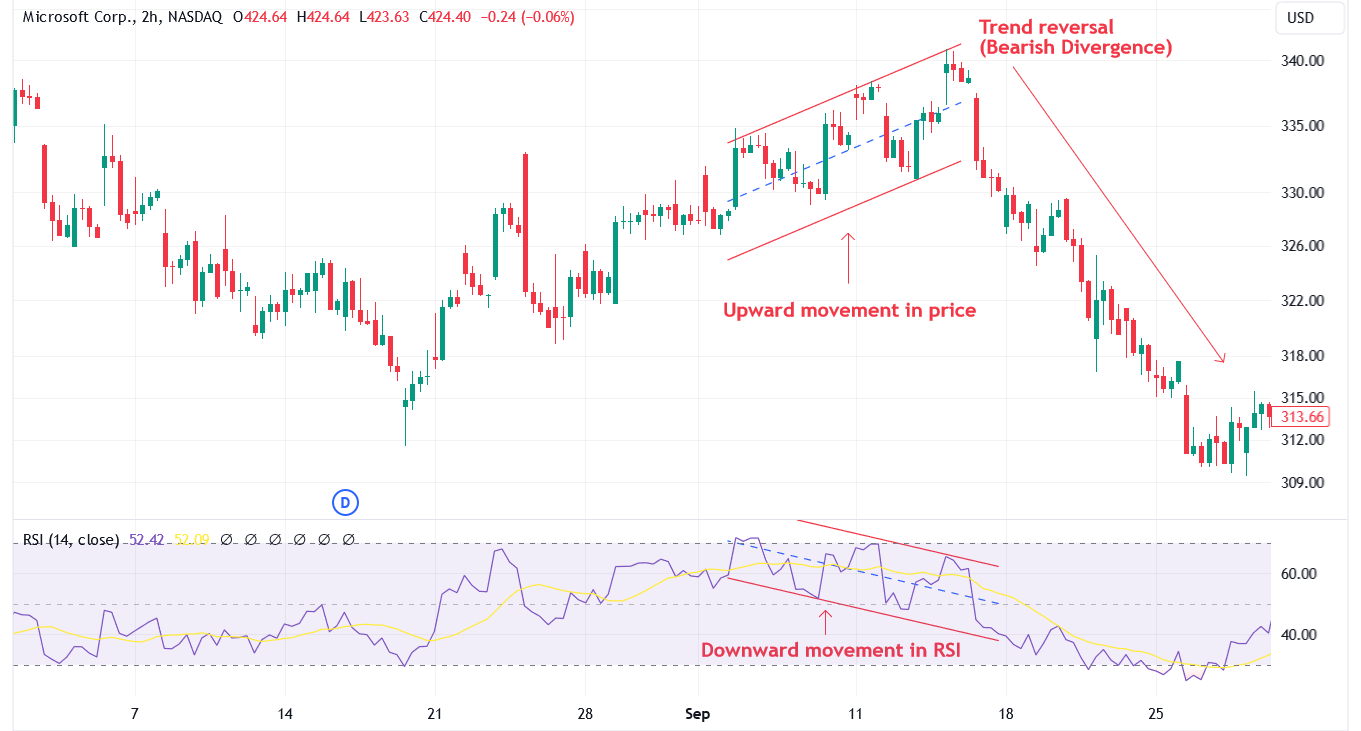
RSI divergence strategy
Traders using this strategy look for a difference between the RSI and the stock price. If the price keeps reaching new highs but the RSI doesn't follow (bearish divergence), it could signal a potential sell opportunity. Conversely, if the price keeps hitting new lows but the RSI doesn't (bullish divergence), it could indicate a potential buy signal. Divergence suggests a weakening momentum in the current trend, possibly signaling a reversal.
RSI trendline breakout strategy (for swing trading)
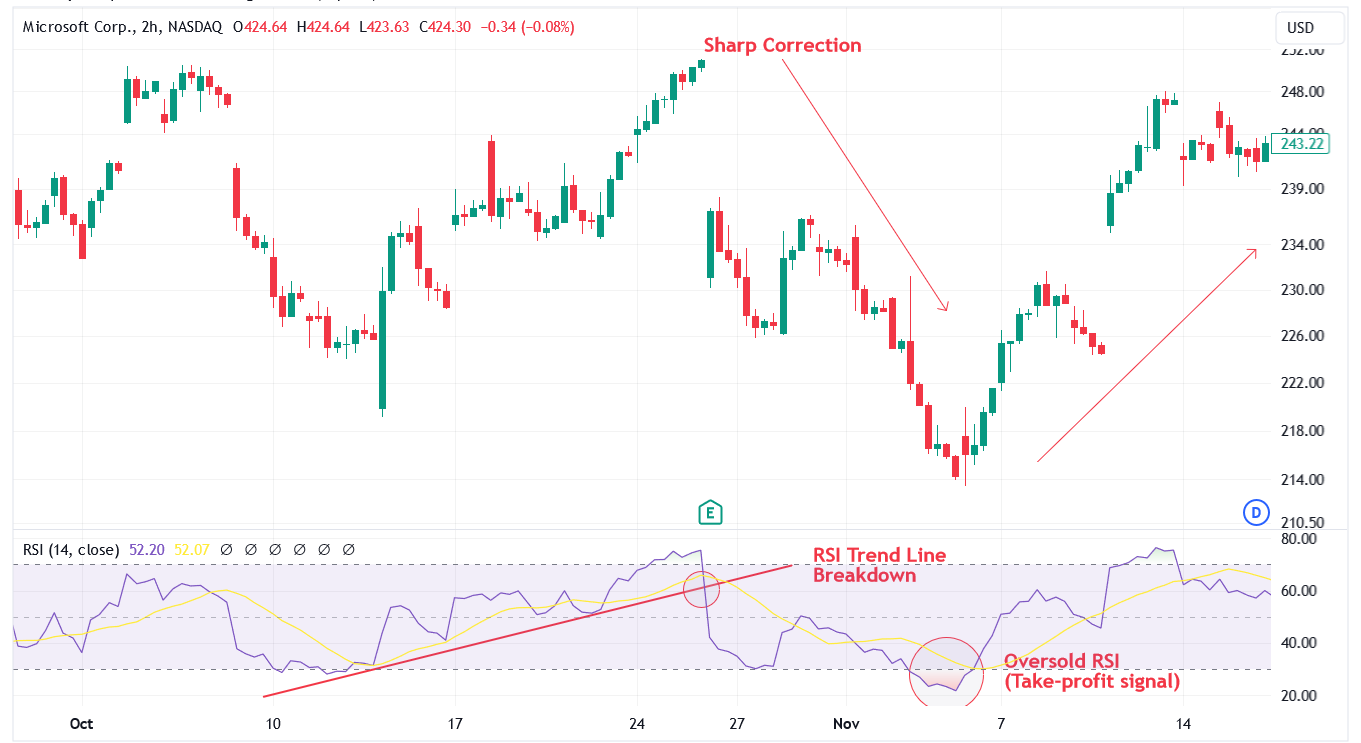
RSI trendline breakout strategy
This strategy involves identifying the direction of the trend (either up or down) and drawing a trendline on the RSI chart connecting swing highs (in an uptrend) or swing lows (in a downtrend). Traders enter a long position (buy) when the RSI breaks above a downtrend line in an uptrend and enter a short position (sell) when the RSI breaks below an uptrend line in a downtrend. The focus here is on identifying trend continuations by using the RSI to spot breakouts from trendlines.
RSI with support/resistance (for day trading)
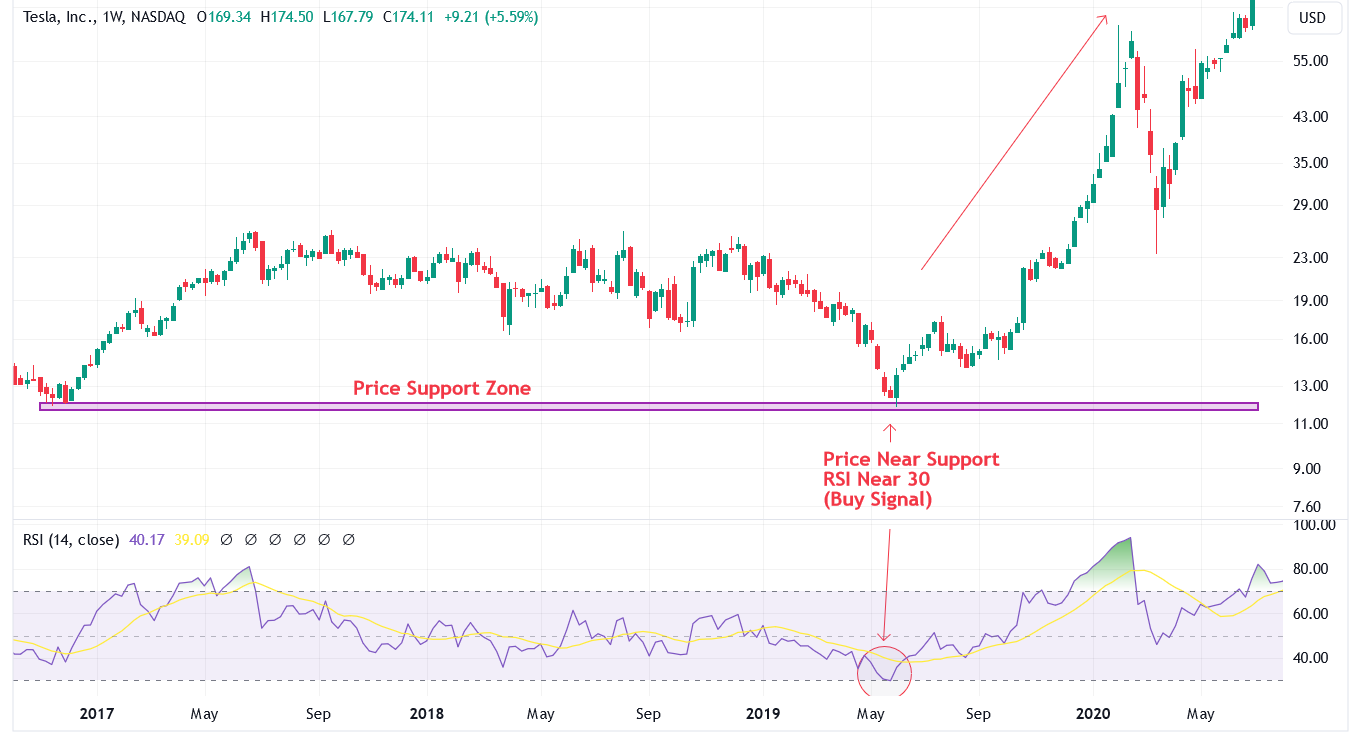
RSI with support/resistance
In this strategy, traders identify support and resistance levels on the price chart and combine the RSI with these levels for entry and exit signals. They look to buy near support zones when the RSI is oversold (around 30) and sell near resistance zones when the RSI is overbought (around 70). By using the agreement between RSI signals and established support/resistance levels, this strategy aims for potentially higher accuracy, particularly in day trading scenarios.
Other RSI strategies
Two additional strategies are the RSI 60-40 Strategy and the 50-Crossover Strategy. The RSI 60-40 Strategy involves using the 60 line as overbought and the 40 line as oversold, entering short trades when RSI is above 60 and long trades when RSI drops below 40. The 50-Crossover Strategy utilizes the RSI 50 level as confirmation of a price trend, confirming a downward trend when RSI crosses from above 50 to below 50, and vice versa for an upward trend.
Is RSI good for stock trading?
The Relative Strength Index (RSI) holds potential as a tool for stock trading, but it's not a standalone solution. It serves to identify overbought or oversold conditions in the market, aiding traders in making informed decisions. RSI offers a straightforward calculation and provides a clear visual representation of momentum through historical price movements. Additionally, it can offer valuable insights through divergence patterns, signaling potential trend reversals.
However, RSI has its limitations. It doesn't guarantee future price movements, and overbought or oversold readings may not always result in immediate price changes. Moreover, its effectiveness diminishes in trending markets, where it can remain in extreme territory for extended periods, thereby producing signals less reliable. RSI relies on historical data, which may not always reflect future market conditions accurately.
Expert opinion
As an expert in the field, I believe that while the RSI holds merit in identifying overbought and oversold conditions, it should be approached with caution and complemented with other analysis methods.
The RSI's ability to gauge momentum and provide visual representations of historical price movements can be beneficial for traders seeking entry and exit points. However, it's essential to recognize its limitations, particularly in trending markets where signals may be less reliable. Moreover, RSI readings should not be viewed as absolute guarantees of future price movements, as market dynamics can be unpredictable.
To maximize the effectiveness of the RSI, traders should consider incorporating it into a comprehensive trading strategy that encompasses other technical indicators, fundamental analysis, and market sentiment. By combining multiple tools and approaches, traders can gain a more holistic understanding of market conditions and make more informed trading decisions.

Conclusion
In conclusion, the Relative Strength Index (RSI) stands as a valuable tool for stock traders, offering insights into overbought and oversold conditions and aiding in decision-making processes. While it provides a straightforward calculation and visual representation of momentum, traders must approach it cautiously, recognizing its limitations, particularly in trending markets. It is advisable to complement RSI analysis with other technical indicators, fundamental analysis, and market sentiment for a more comprehensive trading strategy. By incorporating multiple tools and approaches, traders can enhance their understanding of market dynamics and make more informed trading decisions, ultimately increasing their chances of success in the stock market.
Glossary for novice traders
-
1
Day trading
Day trading involves buying and selling financial assets within the same trading day, with the goal of profiting from short-term price fluctuations, and positions are typically not held overnight.
-
2
Cryptocurrency
Cryptocurrency is a type of digital or virtual currency that relies on cryptography for security. Unlike traditional currencies issued by governments (fiat currencies), cryptocurrencies operate on decentralized networks, typically based on blockchain technology.
-
3
SIPC
SIPC is a nonprofit corporation created by an act of Congress to protect the clients of brokerage firms that are forced into bankruptcy.
-
4
CFD
CFD is a contract between an investor/trader and seller that demonstrates that the trader will need to pay the price difference between the current value of the asset and its value at the time of contract to the seller.
-
5
Swing trading
Swing trading is a trading strategy that involves holding positions in financial assets, such as stocks or forex, for several days to weeks, aiming to profit from short- to medium-term price swings or "swings" in the market. Swing traders typically use technical and fundamental analysis to identify potential entry and exit points.


Team that worked on the article

Chinmay Soni is a financial analyst with more than 5 years of experience in working with stocks, Forex, derivatives, and other assets. As a founder of a boutique research firm and an active researcher, he covers various industries and fields, providing insights backed by statistical data. He is also an educator in the field of finance and technology.
As an author for Traders Union, he contributes his deep analytical insights on various topics, taking into account various aspects.

Dr. BJ Johnson is a PhD in English Language and an editor with over 15 years of experience. He earned his degree in English Language in the U.S and the UK. In 2020, Dr. Johnson joined the Traders Union team. Since then, he has created over 100 exclusive articles and edited over 300 articles of other authors.

Mirjan Hipolito is a journalist and news editor at Traders Union. She is an expert crypto writer with five years of experience in the financial markets. Her specialties are daily market news, price predictions, and Initial Coin Offerings (ICO).
