Best Day Trading Indicators You Should Know


Editorial Note: While we adhere to strict Editorial Integrity, this post may contain references to products from our partners. Here's an explanation for How We Make Money. None of the data and information on this webpage constitutes investment advice according to our Disclaimer.
Best day trading indicators:
Moving averages - show the price value averaged according to different formulas for the selected period.
RSI - shows the overbought and oversold zones of an asset.
Volume - shows vertical trading volumes on a given candle.
If you are involved in stock trading or Forex trading or virtually any other type of market, you’ve probably heard of technical indicators in the context of day trading.
This guide highlights seven essential technical indicators every trader should consider for day trading. We have based this list on key factors like functionality, signal types, setup methods, and the unique benefits these tools offer to traders. Additionally, we’ll discuss which indicators are most effective for day trading, the value of using them, and practical tips for incorporating indicators into your trading strategy.
Best technical analysis Indicators for day trading
Trading in the stock market, FX, and other markets relies heavily on analyzing charts and recognizing patterns. Indicators play a key role for both beginners and experts, providing valuable insights to navigate the market's dynamic nature. They help predict market trends, movements, and patterns like averages and accumulation, making them essential tools for maximizing profits.
The following technical analysis indicators are the most ideal for day trading. These include moving averages, relative strength, volume, Stochastic Oscillator, average directional index, Aroon Indicators, and accumulation and distribution line.
Moving Averages or Moving Average Convergence Divergence
The moving average indicator aids traders in determining the trend's direction as well as its momentum. It also offers a variety of trading indications. The price is in an upward phase when the moving average indicator is above zero. It has entered a negative period if the moving average indicator is below zero.
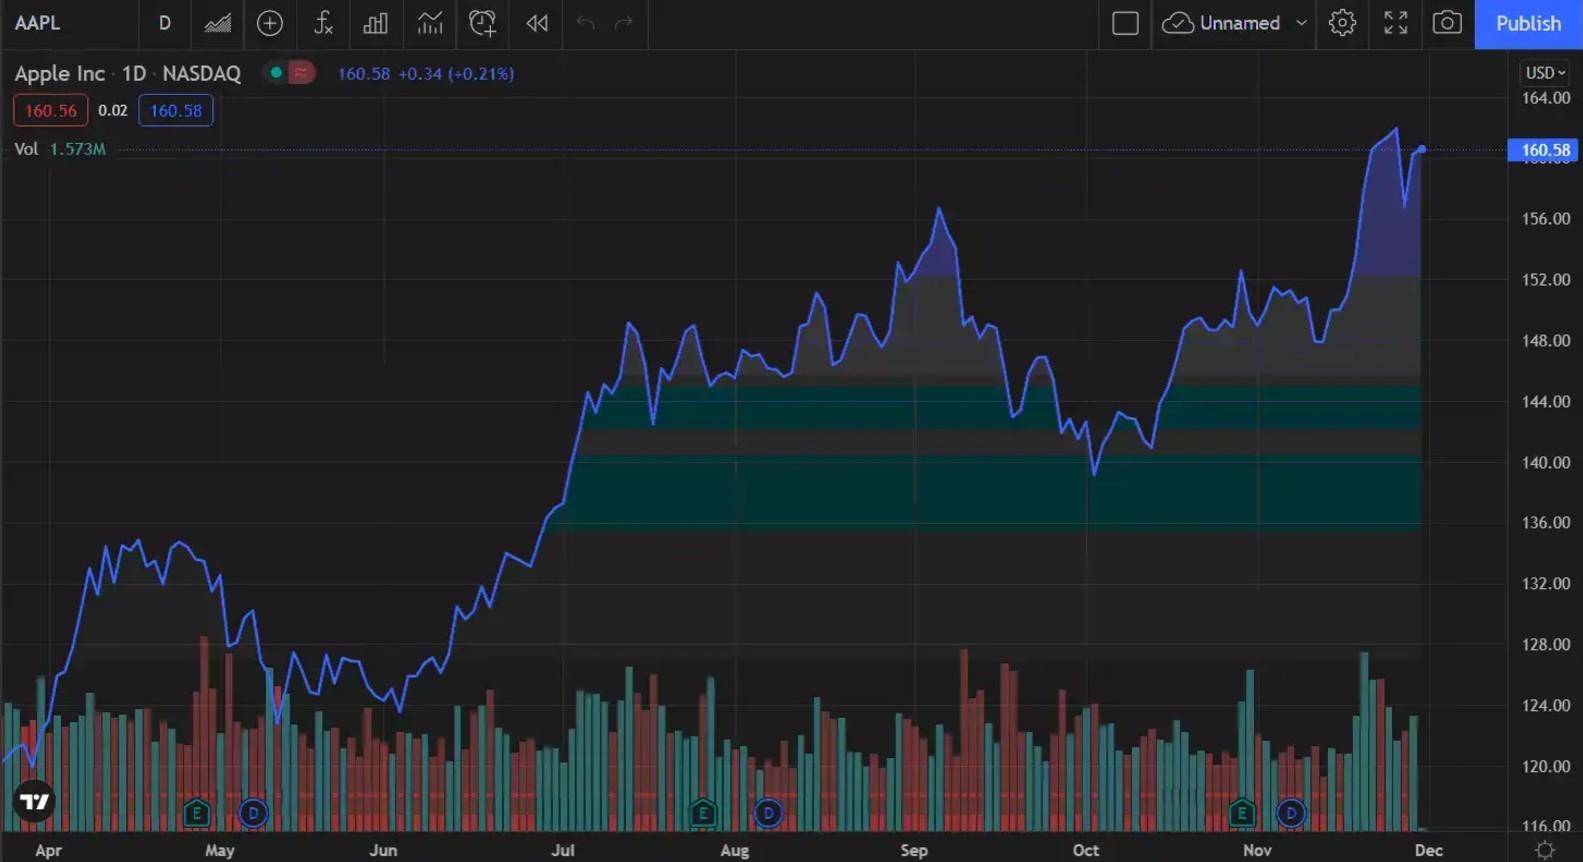
The indicator is made up of two lines: a moving average indicator line and a slower moving signal line. It signifies that the price is declining when the moving average indicator passes below the signal line. The price is rising when the moving average indicator line passes over the signal line.
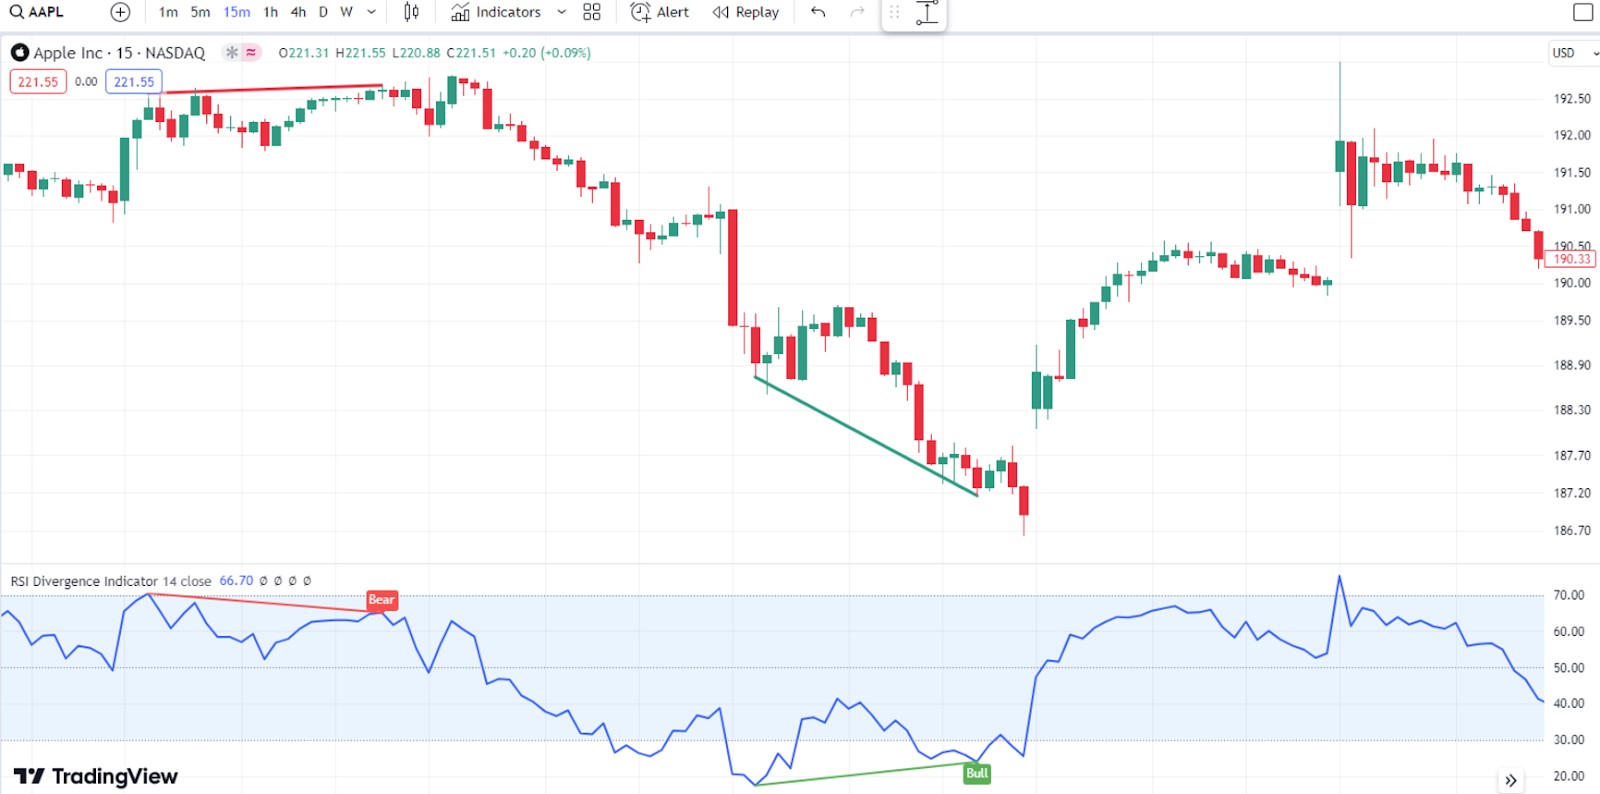
Relative Strength (RSI)
The Relative Strength Index (RSI) is an essential oscillator for technical traders. It measures the speed and change of price movements, signaling overbought conditions above 70 and oversold levels below 30 on a scale of 0 to 100.
RSI excels in identifying potential trend reversals through divergences:
Bullish Divergence: The price hits a lower low, but RSI forms a higher low, indicating easing selling pressure and potential upside.
Bearish Divergence: The price reaches a higher high, but RSI makes a lower high, signaling weakening buying momentum and possible trend reversal.
Mastering RSI and its divergences, combined with other analyses, can uncover valuable trading opportunities.
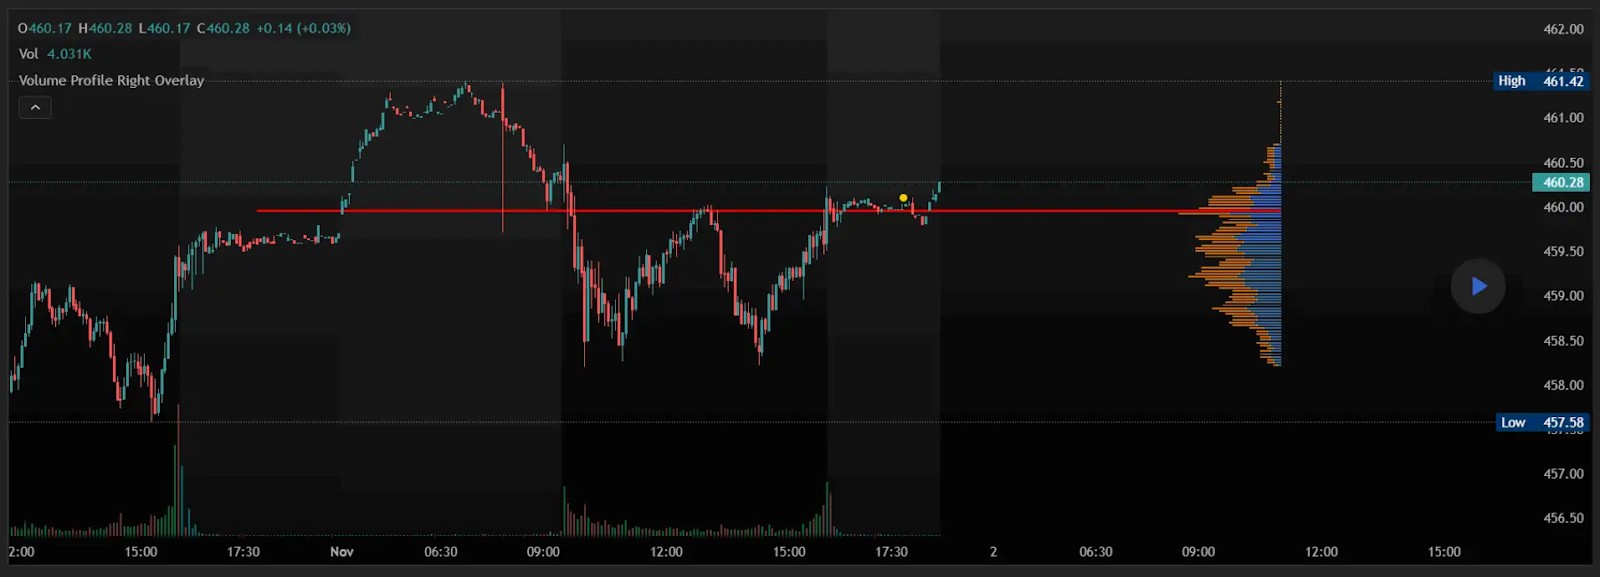
Volume
Measure the positive and negative flow of volume in a security over time using the on-balance volume indicator (or OBV). A running sum of up volume minus down volume is used to calculate risk with this indicator. The amount of volume on a day when the price rallied is known as up volume. The volume on a day when the price declines is known as down volume. Depending on whether the price moved up or down, each day's volume is added or deducted from the indication.
Stochastic Oscillator
The stochastic oscillator is a stock and Forex technical indicator that compares the current price to the price range over time. When the trend is up, the price must be setting new highs, according to the chart, which is shown between zero and one hundred. Because the price tends to make fresh lows in a decline, the stochastic determines whether or not this is the case. Since it is uncommon for the price to achieve continuous highs, we recommend keeping the stochastic around 100.

Average Directional Index
The average directional index (ADX) is a trend indicator that is used to determine a trend's strength and momentum. When the ADX rises above 40, the trend is thought to have a lot of directional power, either up or down, depending on the price movement. The trend is deemed weak or non-trending when the ADX indicator is below 20.

The ADX is the indicator's primary line, which is normally black. There are two more lines that can be displayed if desired. DI+ and DI- are the two types. These lines are frequently red and green in hue. All three lines work together to display the trend's direction as well as its momentum.
Aroon indicator
The Aroon oscillator is a type of technical indicator that determines if a security is currently in a trend and, more specifically, whether the price is making new highs or lows throughout the calculation period.
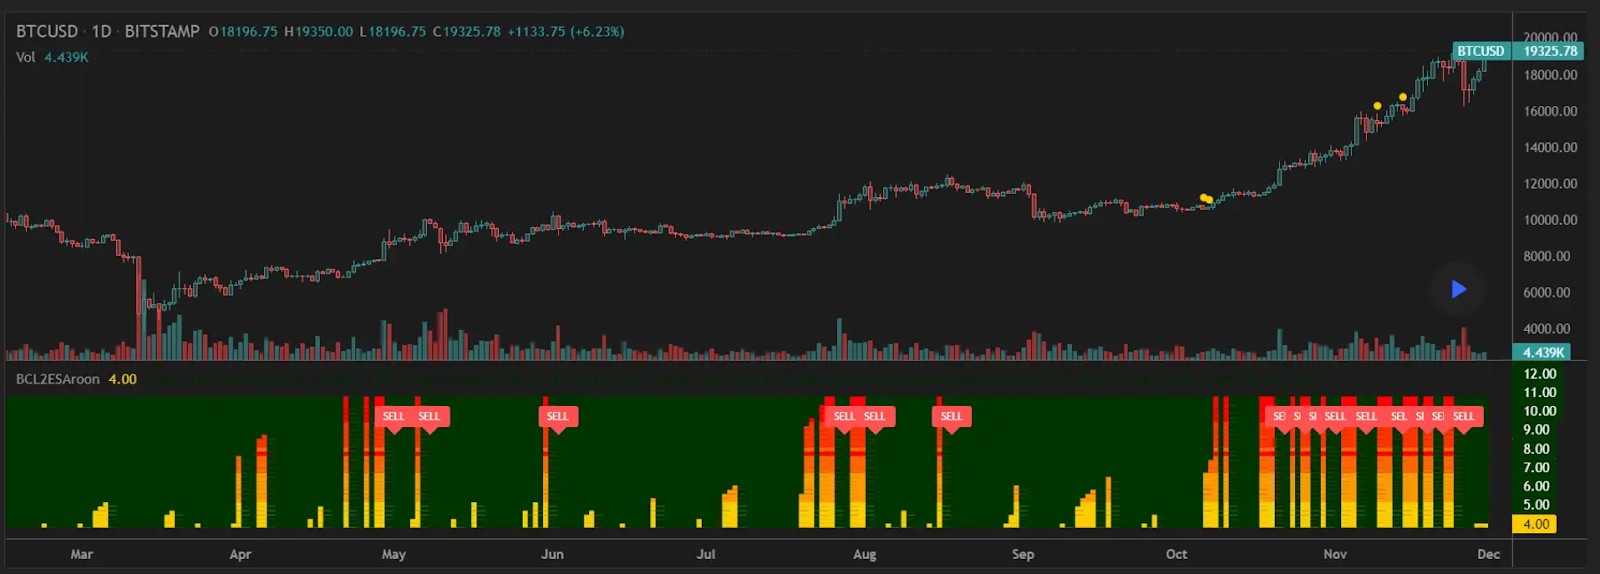
The indicator may also be used to predict the start of a new trend. There are two lines in the Aroon indicator: an Aroon-up line and an Aroon-down line. The first hint of a likely trend shift is when the Aroon-up crosses above the Aroon-down. If the Aroon-up reaches 100 and remains very close to that level while the Aroon-down remains near zero, it indicates that an uptrend is underway.
Accumulation and Distribution Line
The accumulation/distribution line is used to assess the money movement in and out of an asset. It focuses on the security's closing price for the period and considers the period's trading range and where the closure falls within that range. The indicator gives volume more weight if a stock closes near its high than if it closes at the midpoint of its range.
Because the stock is closing over the range's midway point, the indicator line is going up, indicating purchasing activity. This aids in the confirmation of an upward trend. If A/D is decreasing, on the other hand, it suggests the price is closing in the lower half of its daily range, and hence volume is negative. This aids in the confirmation of a downward trend.
How to choose trading indicators?
Avoid common mistakes like using too many or conflicting indicators, which can lead to confusion and false signals. Instead, select indicators that complement each other and provide diverse insights. Key factors to consider:
Volatility. Use tools like ATR (Average True Range) or Bollinger Bands for volatile assets.
Overbought/Oversold. RSI and Stochastic Oscillator signal potential reversals.
Pattern recognition. Look for indicators that identify chart patterns.
Trends. Moving Averages help identify market direction.
Volume. Volume indicators reveal momentum and market interest.
Choose wisely to enhance your decision-making and trading success. Also using trading platforms offers numerous advantages for day traders across markets such as stocks, foreign exchange, and options.
| Day Trading | Demo | Min. deposit, $ | Max. leverage | Min Spread EUR/USD, pips | Max Spread EUR/USD, pips | Scalping | Max. Regulation Level | Open an account | |
|---|---|---|---|---|---|---|---|---|---|
| Yes | Yes | 100 | 1:300 | 0,5 | 0,9 | Yes | Tier-1 | Open an account Your capital is at risk. |
|
| Yes | Yes | No | 1:500 | 0,5 | 1,5 | Yes | Tier-1 | Open an account Your capital is at risk.
|
|
| Yes | Yes | No | 1:200 | 0,1 | 0,5 | Yes | Tier-1 | Open an account Your capital is at risk. |
|
| Yes | Yes | 100 | 1:50 | 0,7 | 1,2 | Yes | Tier-1 | Study review | |
| Yes | Yes | No | 1:30 | 0,2 | 0,8 | Yes | Tier-1 | Open an account Your capital is at risk. |
Should I use indicators in day trading?
Technical indicators are used by day traders constantly. Think of them as a vital tool for predicting market movements and volume. With just fundamental facts, there is no possibility to generate money on short time frames in Forex or binary options. As traders, we must employ tools that present price activity and market data to aid in the formation of profitable analyses.
So, how exactly do indications assist you in becoming profitable? Which ones do you choose? There are thousands of technical indicators available, so it’s understandable why traders might get overwhelmed and consider not using them. However, technical indicators in day trading are vital. As long as you employ the proper sorts of indicators for your selected market, indicators may be quite useful for day traders.
How to use the best day trading indicators?
There are many best practices for using day trading indicators. To start, keep your charts clean. Because a trader's charting platform serves as his or her doorway to the markets, it's critical that the charts aid rather than hinder market research.
Charts and workspaces that are easy to read (the full screen, including charts, news feeds, order input windows, etc.) can increase a trader's situational awareness, helping them to quickly comprehend and respond to market events. From the background color to the style and color of a moving average to the size, color, and font of the words that display on the chart, most trading platforms allow for a considerable deal of flexibility when it comes to chart color and design. Traders can more efficiently employ indicators if they set up clean and aesthetically attractive charts and workstations.
We also recommend avoiding overloading yourself with data, especially if you are just starting out as a day trader. Today's traders frequently employ numerous monitors to display various charts and order input windows, as well as indicator notifications. Even if six monitors are employed, it is not a good idea to use every square inch of screen real estate for technical indications.
When a trader tries to comprehend so much data that it all becomes lost, this is known as information overload. This is known as analysis paralysis; if a trader is confronted with too much information, he or she will most likely be unable to reply. Eliminating superfluous signs from a workstation is one way to minimize information overload; if you're not using it, get rid of it. This will help to reduce clutter. If there are numerous indicators of the same type on the same chart, one or more of them can be deleted.
How to combine trading indicators?
One indicator is unlikely to be sufficient for a successful trade. This is due to the complexity of the financial markets. A single indicator can't linearly capture such complexity. Therefore, reinforcement is needed to elaborate a robust trading strategy.
Combining indicators requires a structured approach to filter out noises and create more accurate signals. The following is a step-by-step guide for effective combination:
Select your primary indicator. Start with a powerful foundational indicator. The indicator should align with your trading strategy. For reversal strategies, oscillators like RSI (Relative Strength Index) can be effective. On the other hand, Moving Averages suit trend-following strategies.
Choose a secondary indicator. Choose a complementary trading indicator. This indicator should provide additional trading insights. For instance, you can combine a trend-following Moving Average with a momentum indicator such as the MACD (Moving Average Convergence/Divergence) indicator to confirm trends.
Filter Out conflicting signals. Assess signals from both indicators. If the signals conflict, exercise caution since conflicting signals show unpredictable market conditions. You should wait for clearer confirmation.
Consider the timeframe. Ensure that the primary and secondary indicators are aligned across various timeframes.
Confirm the volume analysis. Integrate volume-based indicators to confirm the strength of price movements.
Use anchored VWAP and MFI to make more precise trading decisions

Day trading success isn’t about using dozens of indicators but about how well they work together. Skip the usual trading tips and try pairing the Volume Weighted Average Price (VWAP) with the Relative Volume (RVOL) indicator. VWAP shows fair value, while RVOL highlights unusual activity, making it easier to spot breakouts that regular moving averages miss. Another pro-level approach is combining the Keltner Channel with the MACD Histogram. The Keltner Channel identifies support and resistance, while the MACD Histogram reveals momentum shifts, helping detect trend reversals early.
Most beginners stick to common indicators like the RSI, but using the Anchored VWAP can unlock hidden market insights. Attach it to key swing highs or lows to see the market’s real bias. Add the Money Flow Index (MFI) for a fuller view, as it tracks both price and volume momentum. With these less common but powerful tools, traders can stay ahead and make more precise decisions.
Summary
For day trading, we suggest focusing on moving averages, Relative Strength Index (RSI), volume, Stochastic Oscillator, Average Directional Index (ADX), Aroon Indicators, and the accumulation/distribution line as highly effective tools. Whether you’re new to trading or a seasoned professional, incorporating technical indicators into your strategy is highly recommended to enhance decision-making and trading performance.
FAQs
What technical indicators do day traders use?
Day traders rely on technical indicators to analyze price movements and identify opportunities. Commonly used tools include moving averages, Bollinger Bands, RSI, Stochastic Oscillator, MACD, Fibonacci retracements, and volume indicators.
What is the most profitable trading indicator?
No single indicator guarantees profitability. Success depends on combining indicators with effective risk management and a well-defined trading strategy.
What are the different types of technical indicators?
Indicators fall into two main categoriesю Overlay indicators placed directly on price charts to show trends, support, and resistance (e.g., moving averages, Bollinger Bands). Independent indicators shown in separate windows to provide insights like momentum and volume (e.g., RSI, MACD).
Are technical indicators completely necessary for day trading?
While some traders avoid them, most successful day traders use indicators to improve decision-making. Combining multiple indicators with thorough research enhances accuracy and helps identify and validate price patterns. Remember, indicators are tools, not guarantees—use them strategically for better results.
Related Articles
Team that worked on the article
Oleg Tkachenko is an economic analyst and risk manager having more than 14 years of experience in working with systemically important banks, investment companies, and analytical platforms. He has been a Traders Union analyst since 2018. His primary specialties are analysis and prediction of price tendencies in the Forex, stock, commodity, and cryptocurrency markets, as well as the development of trading strategies and individual risk management systems. He also analyzes nonstandard investing markets and studies trading psychology.
Also, Oleg became a member of the National Union of Journalists of Ukraine (membership card No. 4575, international certificate UKR4494).
Chinmay Soni is a financial analyst with more than 5 years of experience in working with stocks, Forex, derivatives, and other assets. As a founder of a boutique research firm and an active researcher, he covers various industries and fields, providing insights backed by statistical data. He is also an educator in the field of finance and technology.
As an author for Traders Union, he contributes his deep analytical insights on various topics, taking into account various aspects.
Mirjan Hipolito is a journalist and news editor at Traders Union. She is an expert crypto writer with five years of experience in the financial markets. Her specialties are daily market news, price predictions, and Initial Coin Offerings (ICO).
Volatility refers to the degree of variation or fluctuation in the price or value of a financial asset, such as stocks, bonds, or cryptocurrencies, over a period of time. Higher volatility indicates that an asset's price is experiencing more significant and rapid price swings, while lower volatility suggests relatively stable and gradual price movements.
A day trader is an individual who engages in buying and selling financial assets within the same trading day, seeking to profit from short-term price movements.
Forex leverage is a tool enabling traders to control larger positions with a relatively small amount of capital, amplifying potential profits and losses based on the chosen leverage ratio.
ATR (Average True Range) is a volatility indicator that helps traders assess the potential price range or volatility of a financial instrument. It calculates the average of true price ranges over a specified period, providing insight into the level of price fluctuations within that timeframe.
Index in trading is the measure of the performance of a group of stocks, which can include the assets and securities in it.


-
 Afghanistan
-
 Albania
-
 Algeria
-
 Argentina
-
 Armenia
-
 Australia
-
 Austria
-
 Azerbaijan
-
 Bahamas
-
 Bahrain
-
 Bangladesh
-
 Belgium
-
 Botswana
-
 Brazil
-
 Brunei
-
 Bulgaria
-
 Burma
Burma
-
 Cambodia
-
 Cameroon
-
 Canada
-
 Chile
Chile
-
 China
China
-
 Colombia
-
 Costa Rica
-
 Cote d'Ivoire
-
 Croatia
-
 Cyprus
-
 Czech Republic
-
 Denmark
-
 Dominican Republic
-
 Ecuador
-
 Egypt
Egypt
-
 Estonia
-
 Eswatini
-
 Ethiopia
-
 Finland
-
 France
-
 Georgia
-
 Germany
-
 Ghana
Ghana
-
 Greece
-
 Haiti
Haiti
-
 Hong Kong
-
 Hungary
-
 India
India
-
 Indonesia
-
 Iran, Islamic republic
-
 Iraq
Iraq
-
 Ireland
-
 Israel
-
 Italy
Italy
-
 Jamaica
-
 Japan
Japan
-
 Jordan
-
 Kazakhstan
-
 Kenya
Kenya
-
 Korea
Korea
-
 Kuwait
-
 Kyrgyzstan
-
 Laos
Laos
-
 Latvia
-
 Lebanon
-
 Libyan Arab Jamahiriya
-
 Lithuania
-
 Luxembourg
-
 Macedonia
-
 Madagascar
-
 Malaysia
-
 Malta
Malta
-
 Mauritius
-
 Mexico
-
 Moldova
-
 Mongolia
-
 Montenegro
-
 Morocco
-
 Mozambique
-
 Namibia
-
 Nepal
Nepal
-
 Netherlands
-
 Nigeria
-
 Norway
-
 Oman
Oman
-
 Pakistan
-
 Palestine
-
 Papua New Guinea
-
 Peru
Peru
-
 Philippines
-
 Poland
-
 Portugal
-
 Puerto Rico
-
 Qatar
Qatar
-
 Romania
-
 Rwanda
-
 Saudi Arabia
-
 Serbia
-
 Singapore
-
 Slovakia
-
 Slovenia
-
 Somalia
-
 South Africa
-
 Spain
Spain
-
 Sri Lanka
-
 Sweden
-
 Switzerland
-
 Syrian Arab Republic
-
 Taiwan
-
 Tajikistan
-
 Tanzania, United Republic Of
-
 Thailand
-
 Trinidad and Tobago
-
 Tunisia
-
 Turkey
-
 UAE
UAE
-
 Uganda
-
 Ukraine
-
 United Kingdom
-
United States
-
 Uzbekistan
-
 Venezuela
-
 Vietnam
-
 Yemen
Yemen
-
 Zambia
-
 Zimbabwe
- Forex
- Crypto
