Stock Chart of The Week - Analyst’s Pick
The Trader's Union analyst highlights a stock chart worth your attention every Friday. This analyst selects stocks that have reached a significant technical level, suggesting a possible continuation or reversal of the trend. Stay updated with our daily insights to track the most intriguing charts in the dynamic stock market.
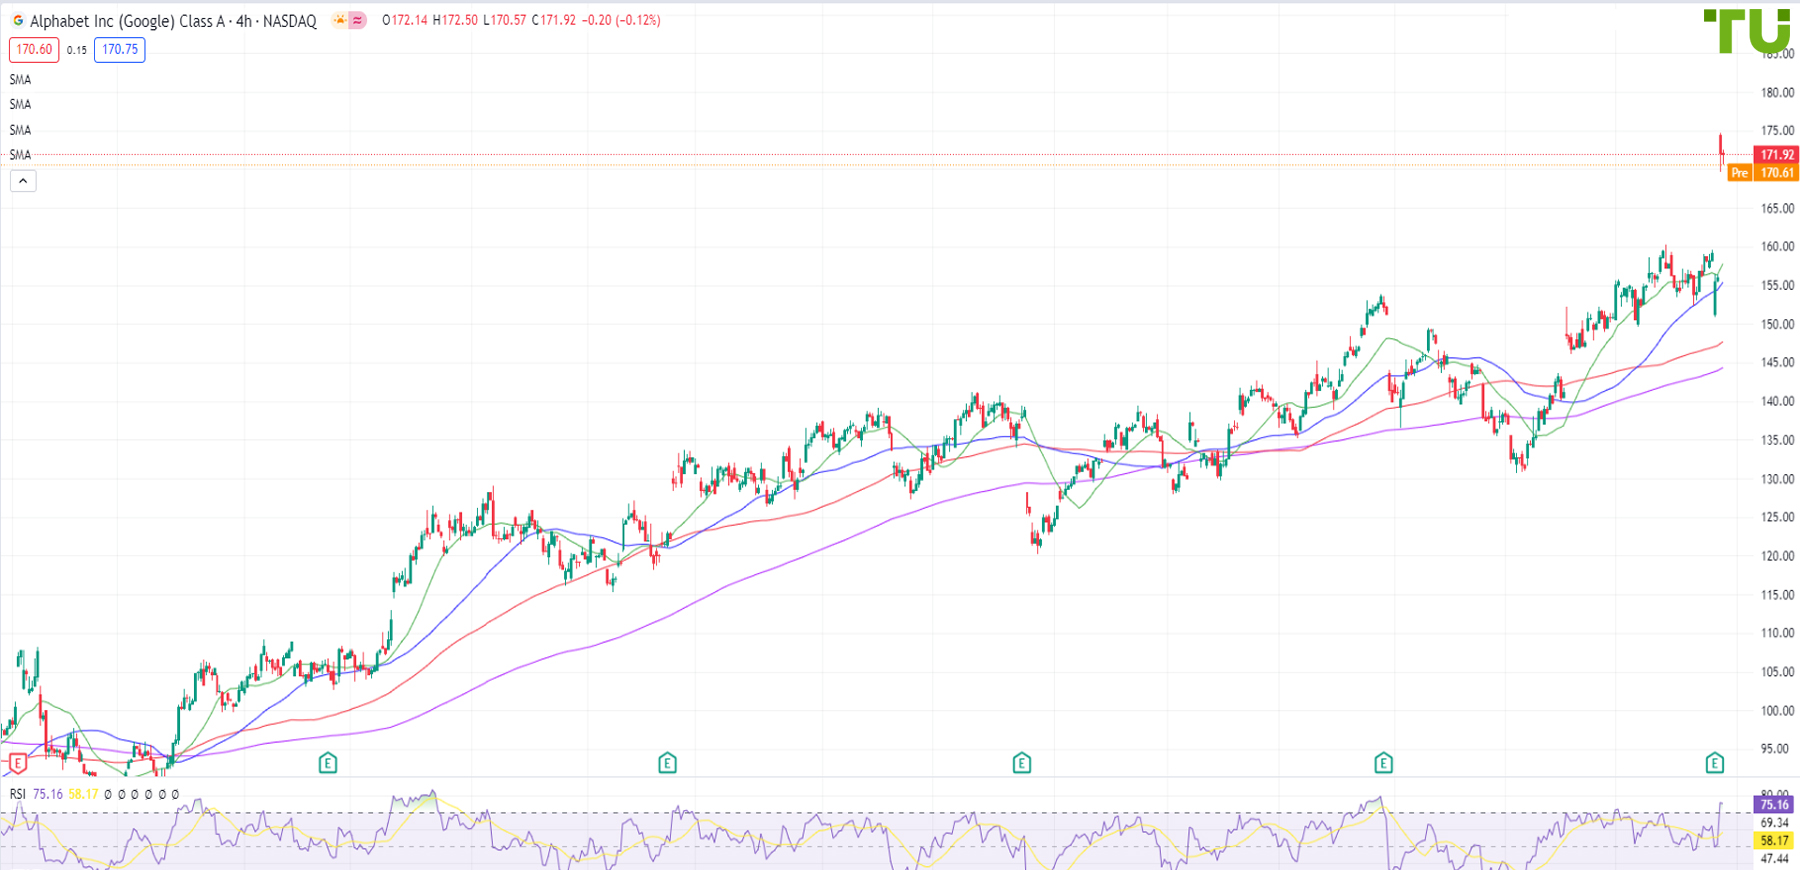
Alphabet Inc (Google) has a gap in premarket. Is it a selling opportunity?
29.04.2024
Shares of Alphabet Inc. continue to follow an upward trend, and the price retracement within the correction was limited by the $132.00 support level. Demand from this level pushed the price back to the $160.00 resistance, and at the beginning of the new trading week, the premarket opened with a gap at the $173.80 level. Thus, the uptrend remains relevant, which is also confirmed by the fact that the stock is confidently trading above the 20-, 50-, 100- and 200-day MAs and in the medium term another renewal of historical highs is possible. However, on the 4H and daily timeframes, the RSI has entered the overbought zone, which may prompt bulls to lock profits. In case of price growth at the beginning of the American trading session, consider the possibility of selling with a potential target at the support at $150.00 psychological level. If the session opens with a decline from this level, consider the possibility of buying with a target of $170.00-175.00. In terms of risk management, it is necessary to consider the probability of a decline to $135.00-120.00, where adding to long positions may be possible.
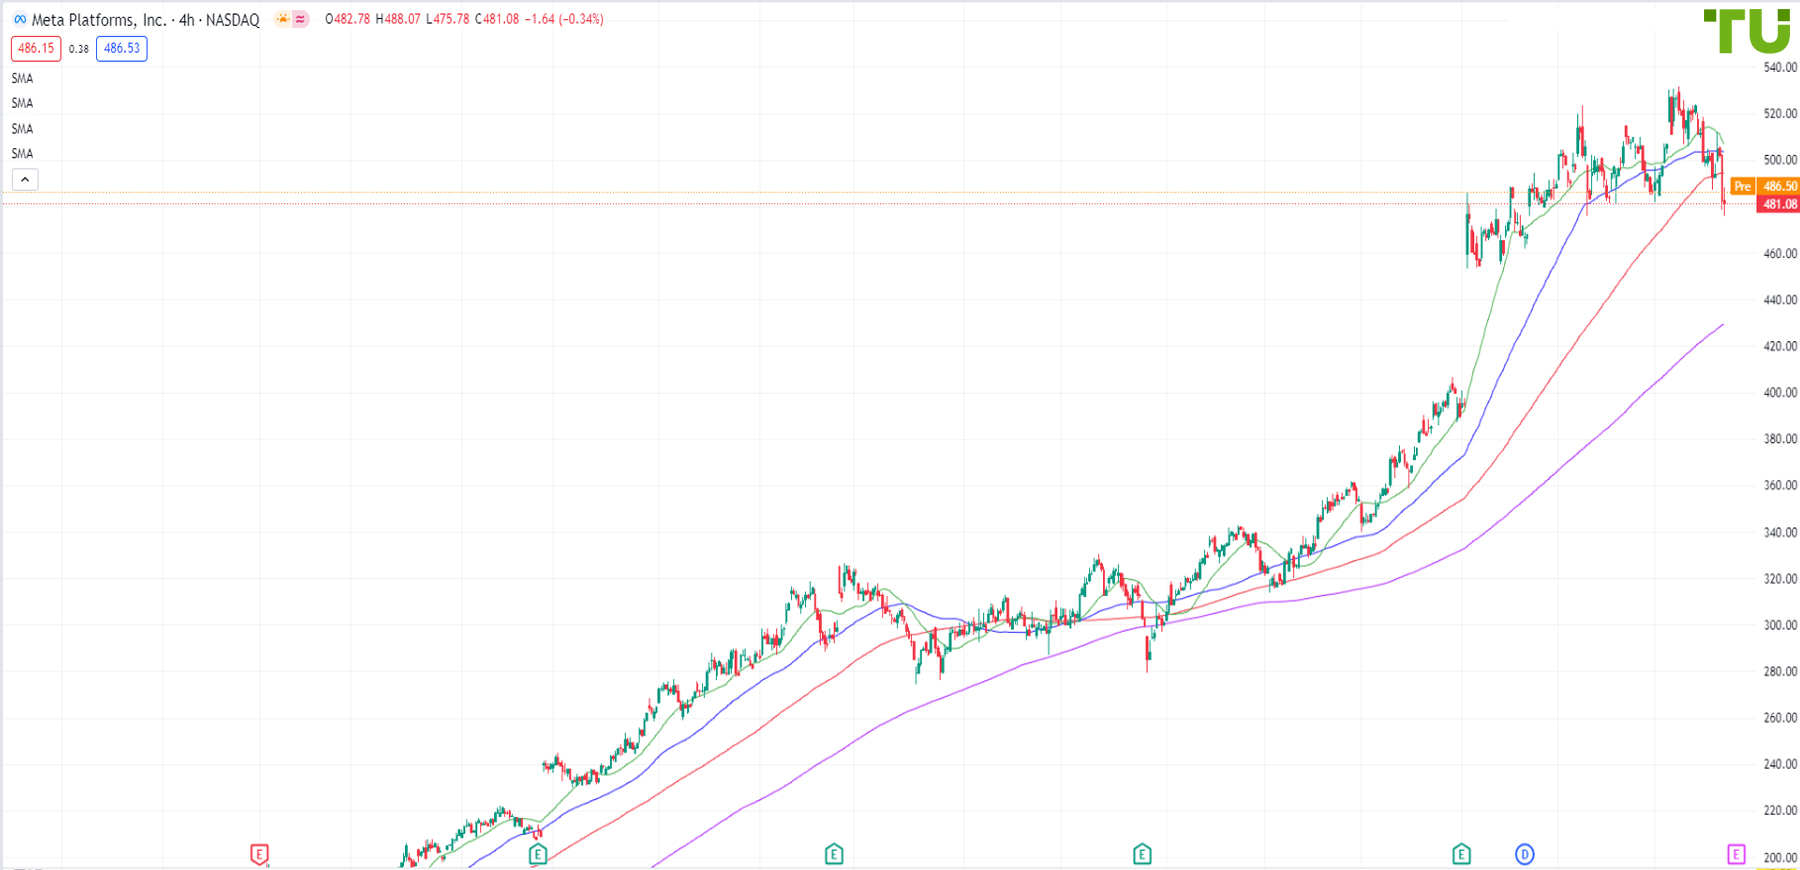
META under pressure in pre-market, decline may be used for buying
22.04.2024
Due to correction in stock markets, META shares are under pressure, breaking the 485.00 support level, implying that the price may dip to support at 460.00-455.00. However, the reversal of the uptrend in stock markets has not been confirmed yet. According to the company's statements, its new large-scale language model Llama 3 has surpassed other AI models in benchmark tests, and as there is no waning interest in AI, the decline in stock prices can be used for buying and retesting 520.00-530.00 resistance. Crossings of moving averages from top to bottom are currently not observed, which may also indicate a resumption of the uptrend. Risks include the possibility of a decline to the 200-day moving average, from which the shares can be bought.