Dow Jones forecast by Traders Union analysts
Dow Jones Industrial Average (DIJA) is a stock market index. It is one of few indexes that are price weighted. Dow Jones is the average of stock prices of 30 companies listed on NYSE.
It is important to consider that the composition of the Dow Jones index is not permanent. The index is revised periodically depending on the situation in the stock market (last change was in 2020). The index is formed by such global companies as Apple, Coca-Cola, Walmart and others. DJIA is a good indicator of the U.S. economy.
The Dow Jones forecast is quite difficult to produce, which is why it is best to entrust it to professionals to minimize errors and deviations from the real picture. Traders Union analysts regularly publish the Dow Jones forecast to help traders adjust their trading strategies correctly and earn money in the Forex market. Swing trading, scalping, intraday trading and other strategies can be used for working with this index. Beginners are recommended not only to view the Dow Jones forecast, but also practice on a demo account to avoid loss due to inexperience and lack of practice.
The best time to work with the instrument is when the U.S. trading session has already opened and the European session is still under way. This is the most heavily traded time for the Dow Jones Index. Once the activity in the U.S. markets subsides, the number of transactions gradually decreases up to the opening of the Asian markets.
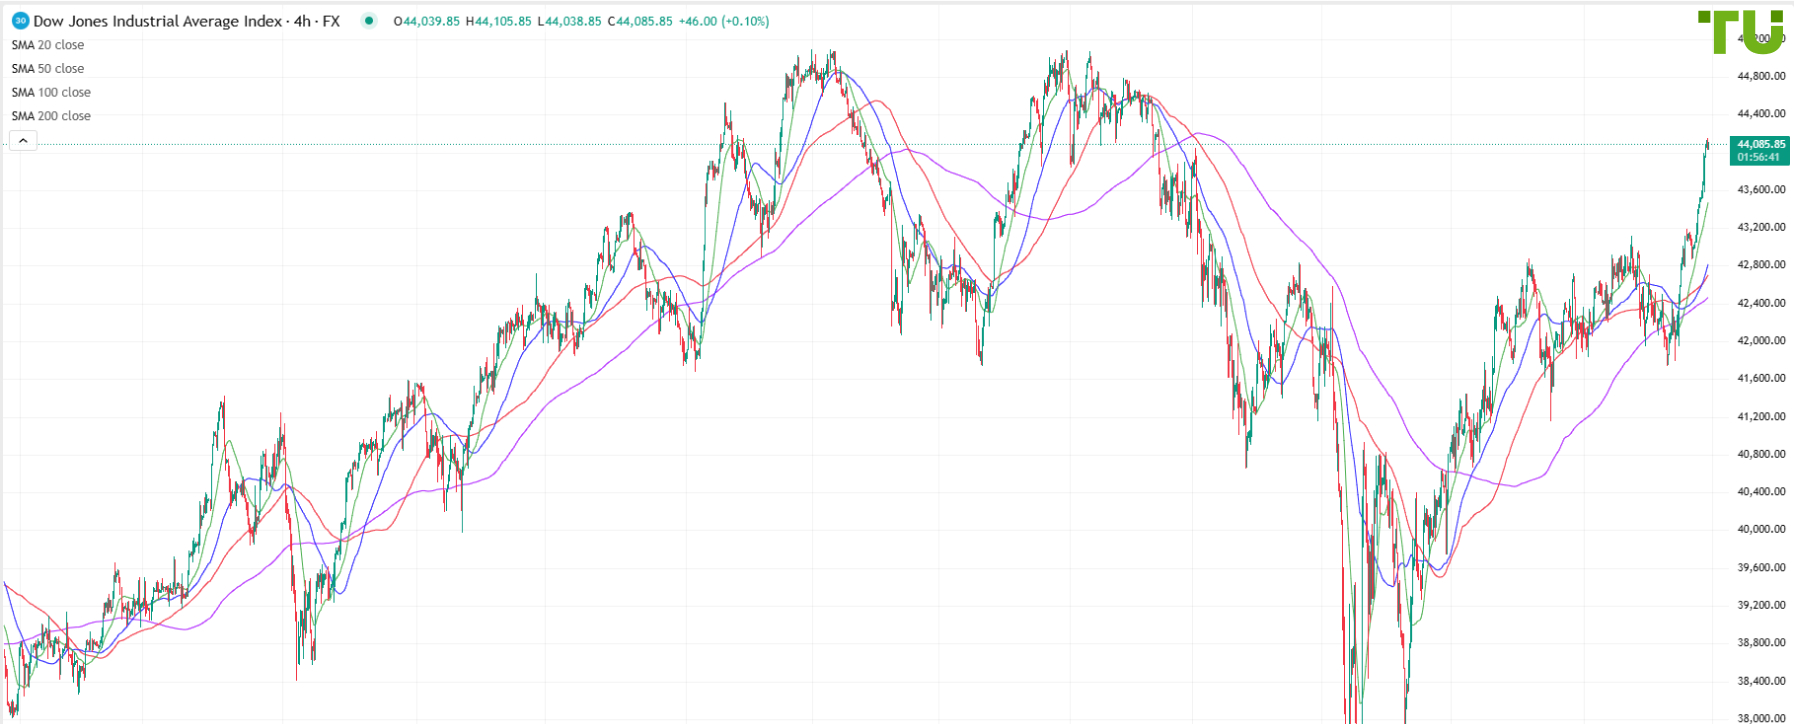
DJ30 again shows positive momentum
30.06.2025
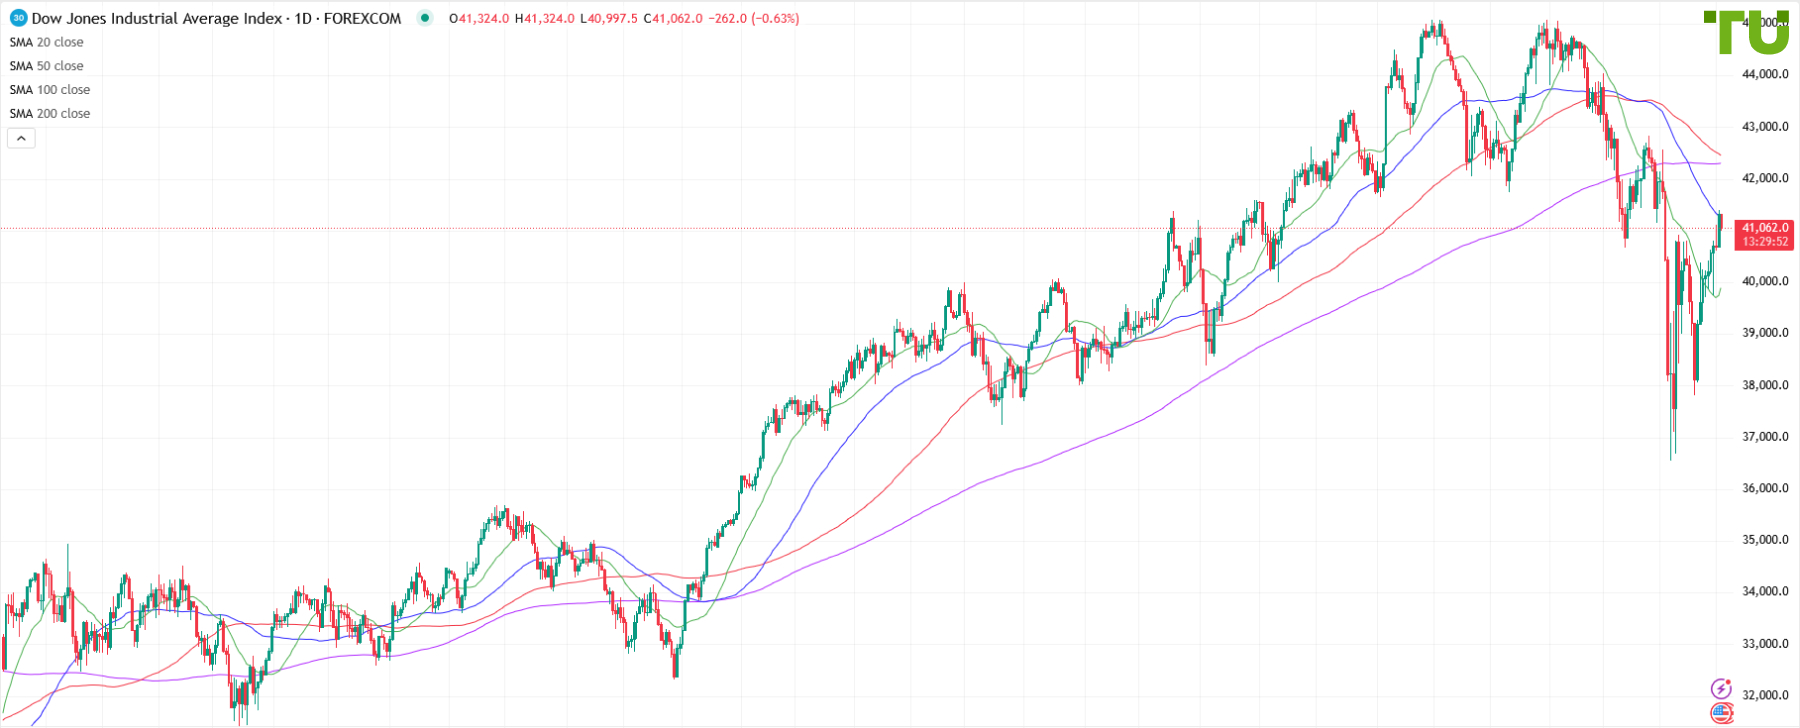
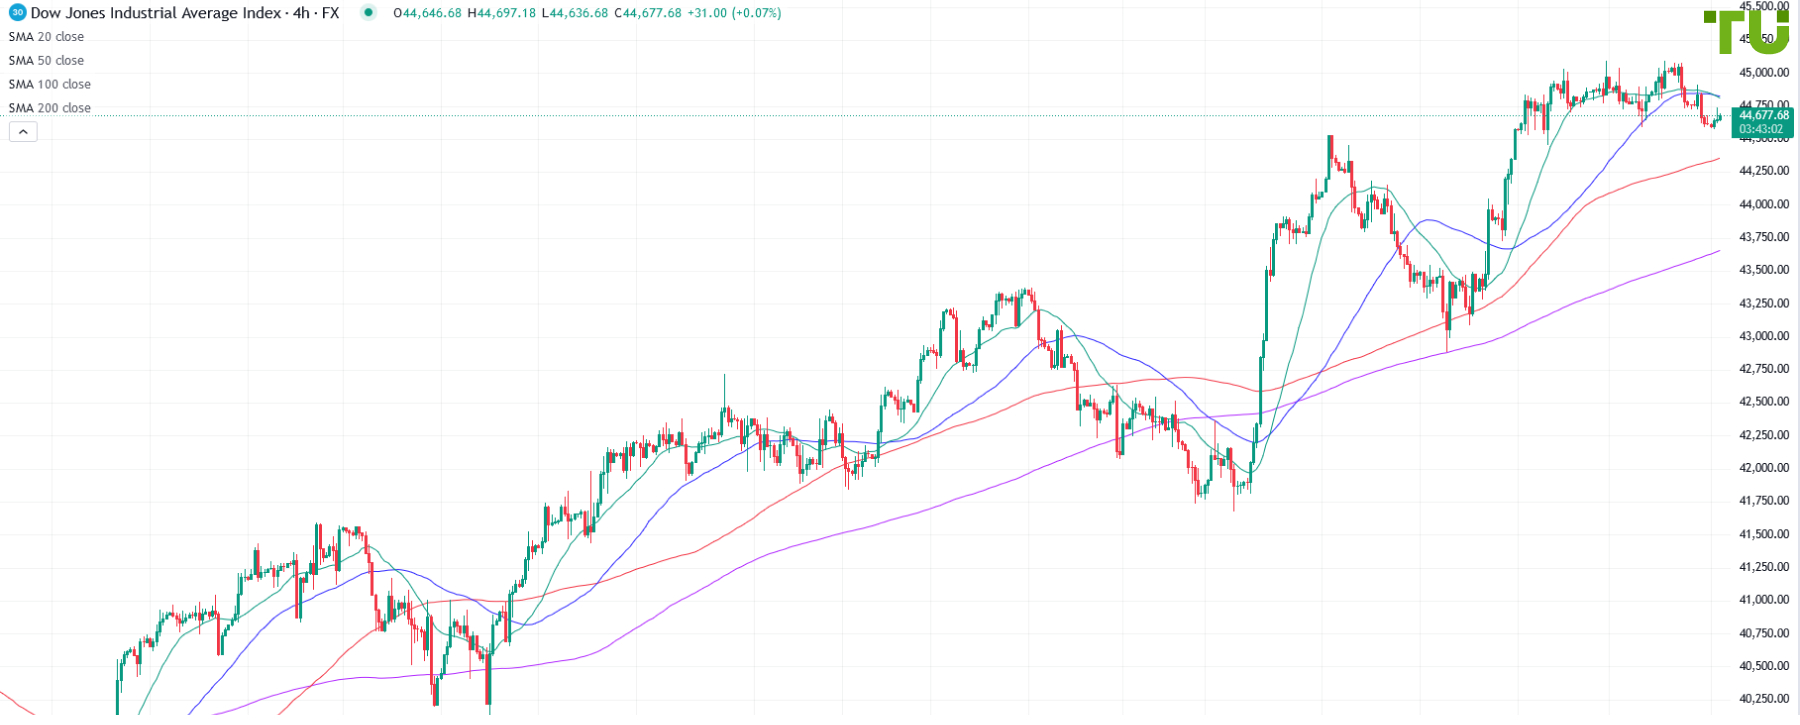
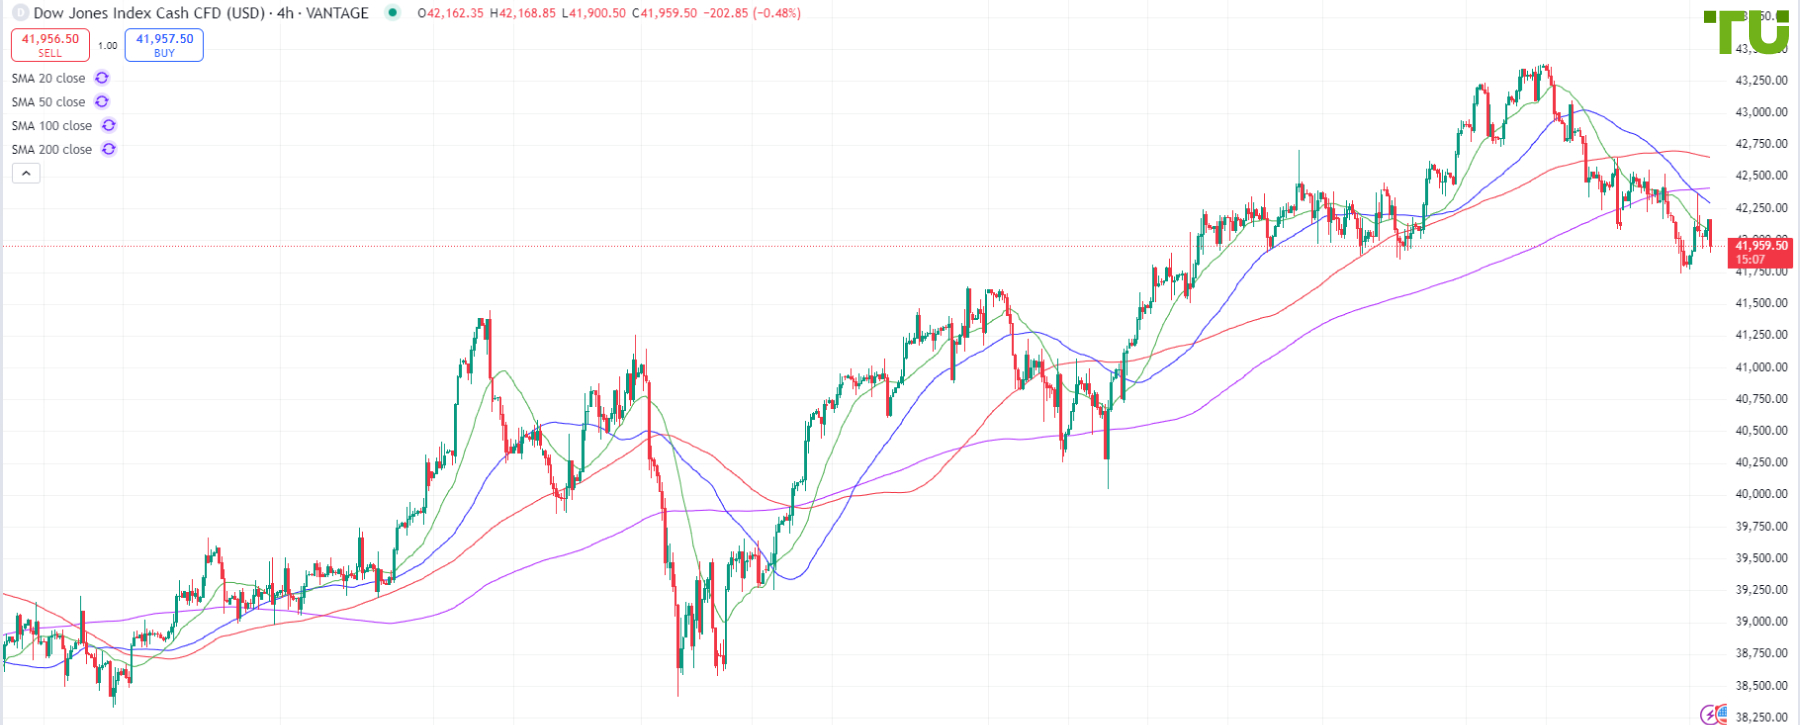
Optimism has returned to the equity markets, with the US Dow Jones 30 index rebounding from 41800 support, breaking 43000 resistance, and currently testing 44140. The near-term outlook remains constructive, with the index potentially extending gains toward 44400–44600. However, due to overbought conditions, long position liquidation is possible as these levels are approached.
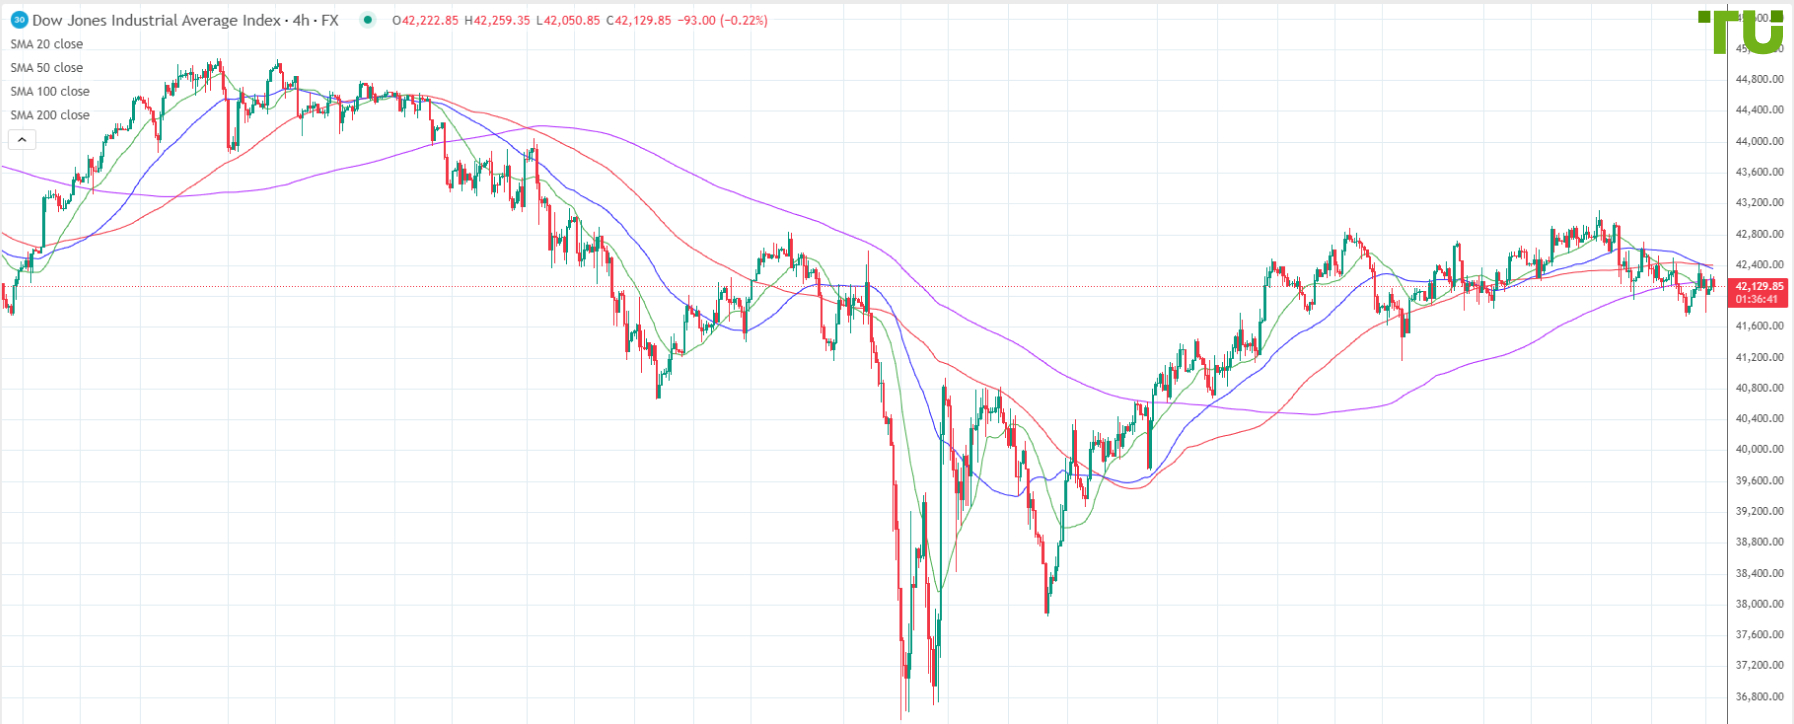
DJ30 consolidates within range
23.06.2025
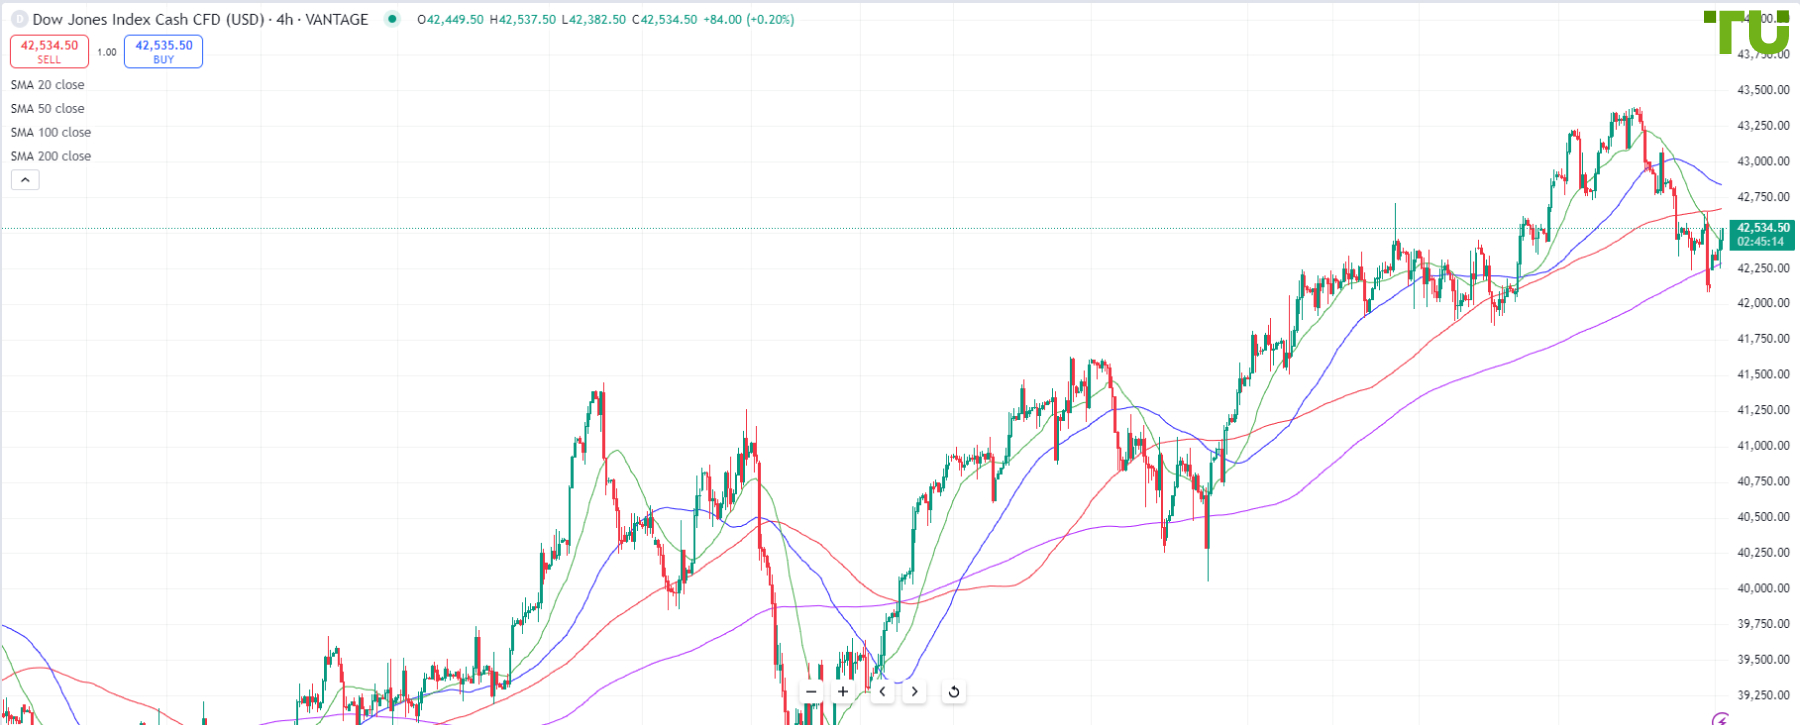
Amid the Israel-Iran conflict and Trump’s trade wars, stock indices remain in a state of uncertainty. Bulls are reluctant to buy, and the rise in the US Dow Jones 30 index has been capped by 43000–43100 resistance, while bears continue their attempts to break 41800 support. Overall, the index remains in a consolidation phase, with risks of breaking support and declining toward 41300–41000. A move through 43100/400 resistance would increase the chances of a break and a rally toward 43500.
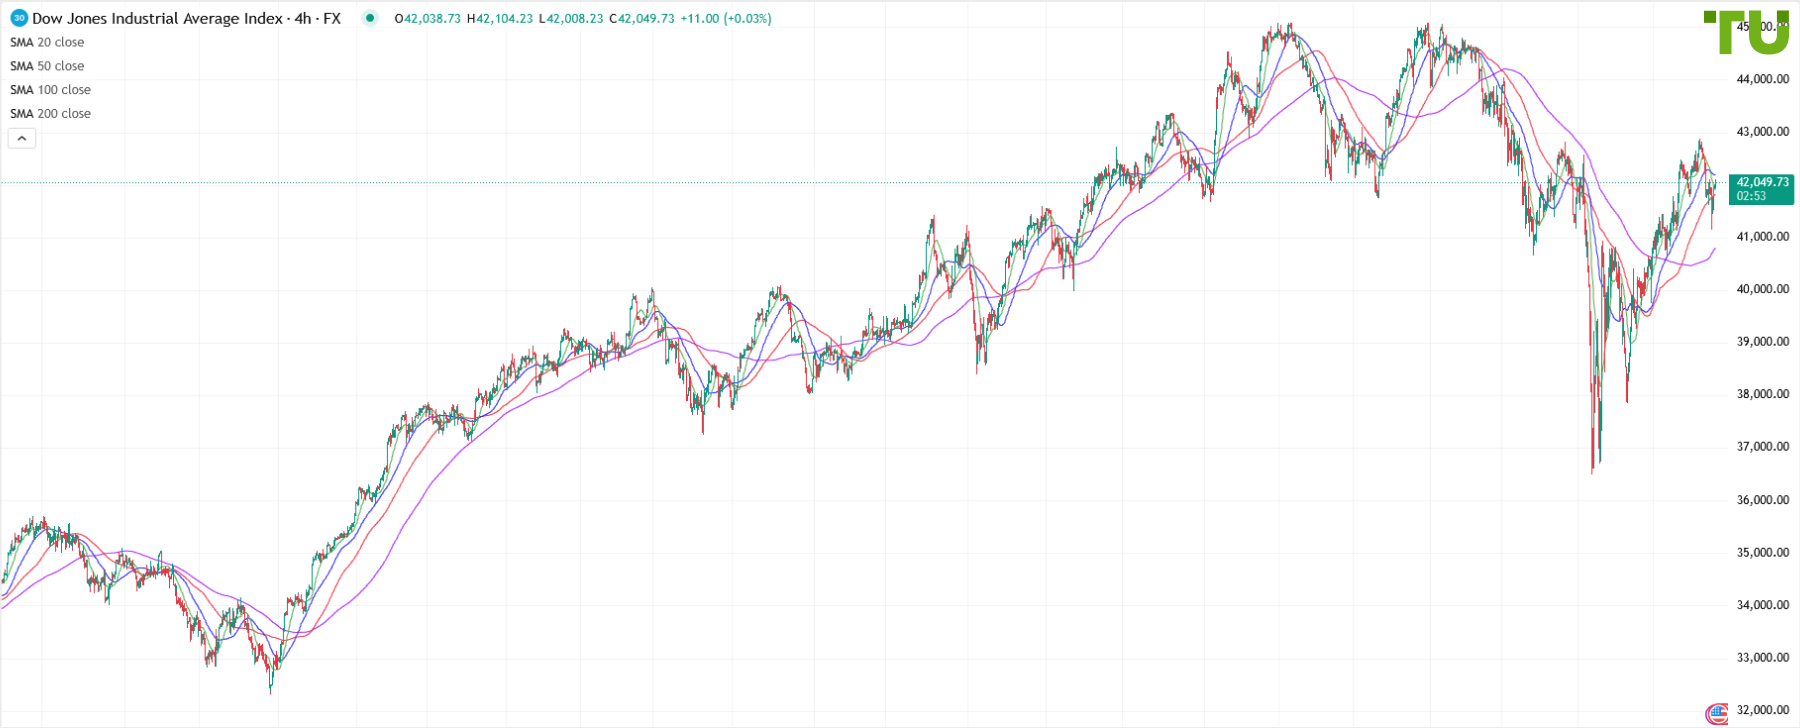
DJ30 bought up on dip
26.05.2025
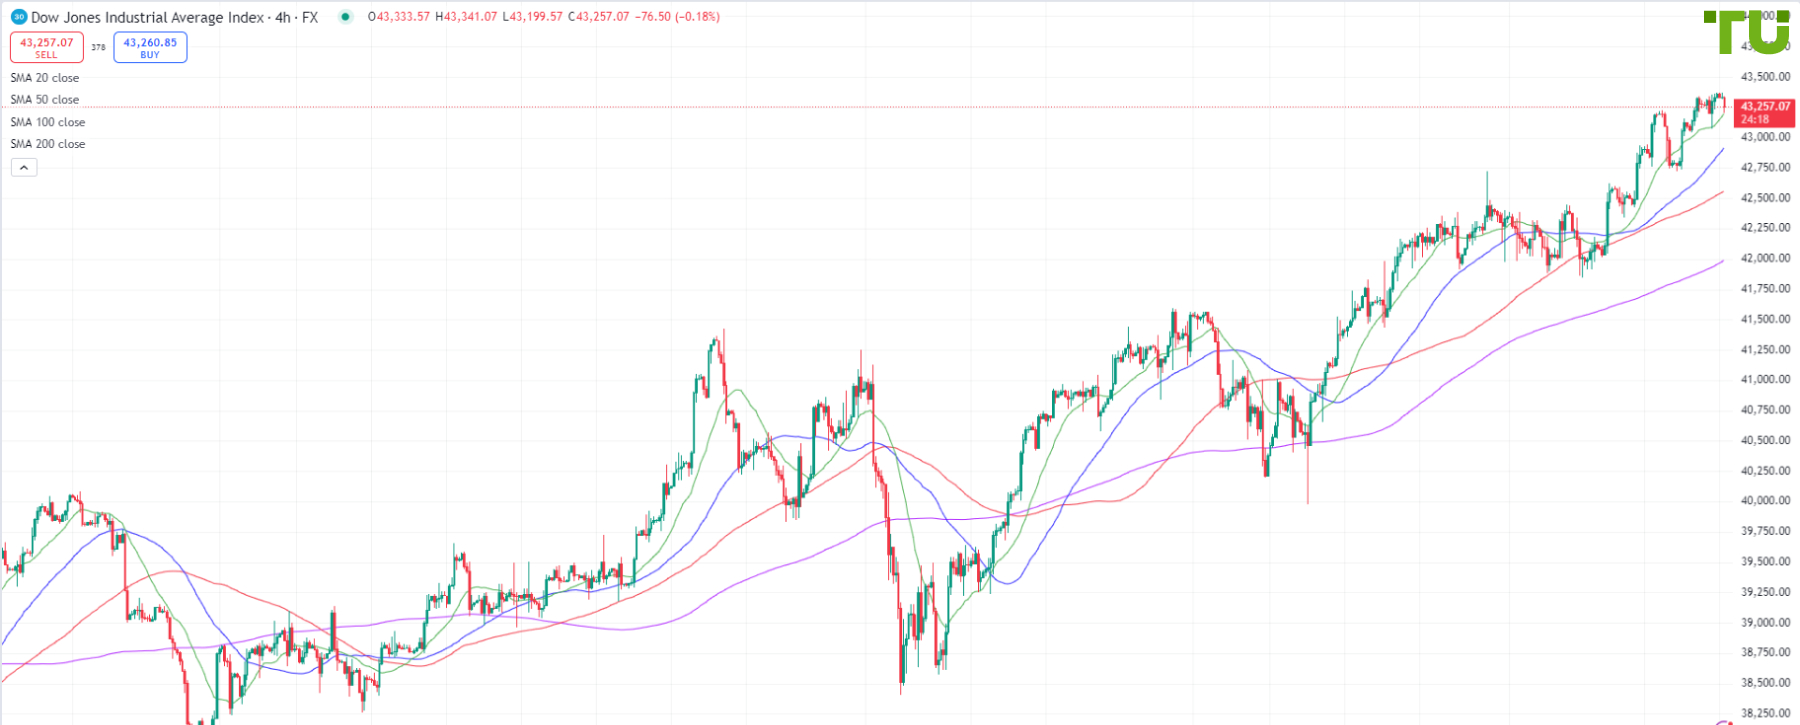
Trump’s announcement of tariffs on EU goods triggered a stock market sell-off, during which the Dow Jones 30 tested 41,160, then rebounded to 41,750 resistance. The tariff delay supported further recovery and a test of 42,100 resistance, which bulls failed to break through on the first attempt. From there, bears may attempt to test 41,800–41,700 support; a break of resistance would lead to growth toward 42,300–42,500.
DJ30 continues recovery
12.05.2025
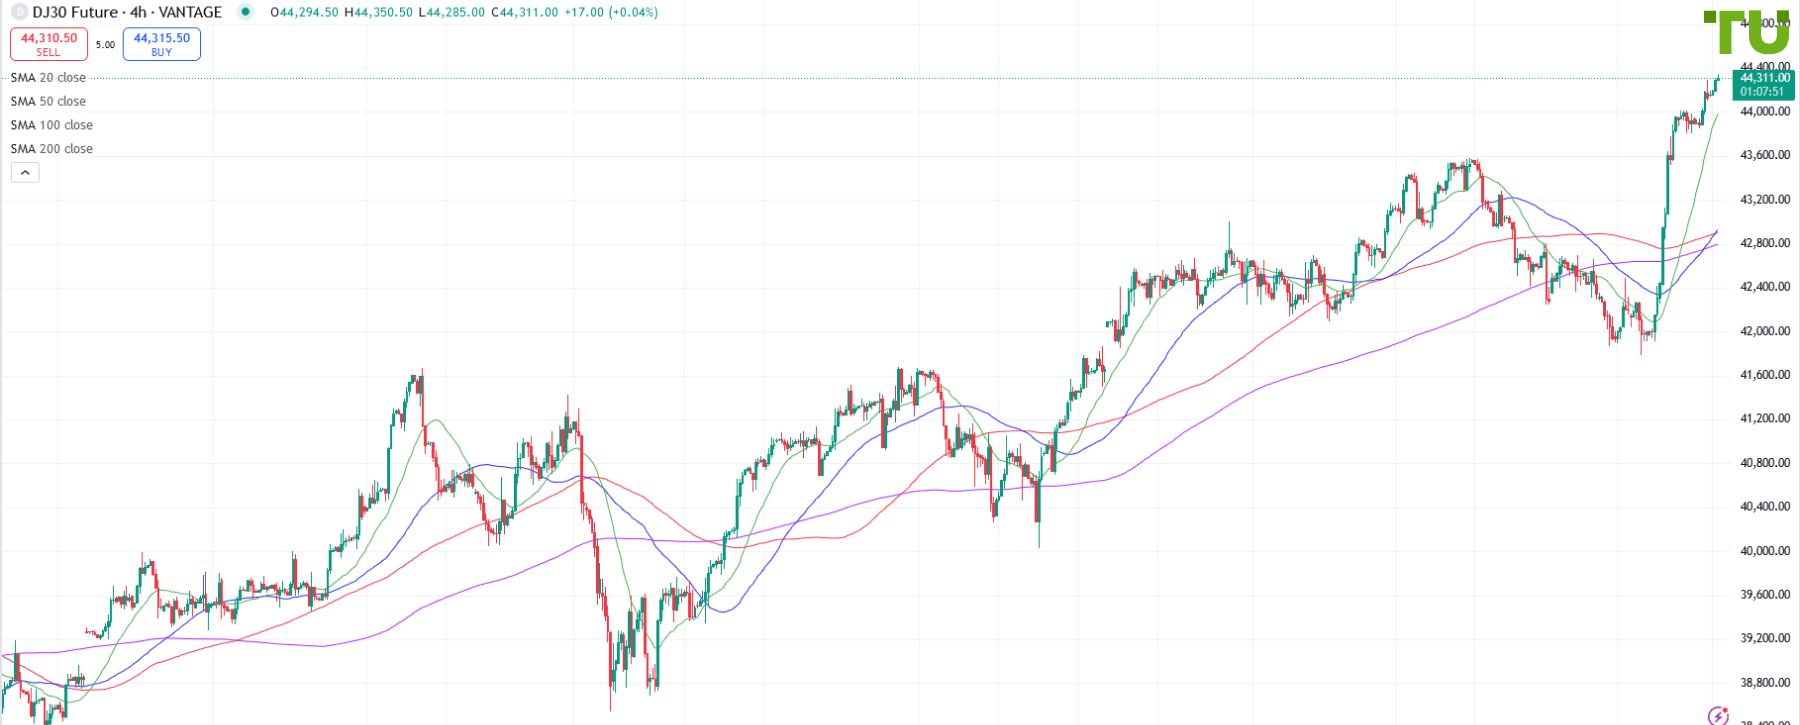
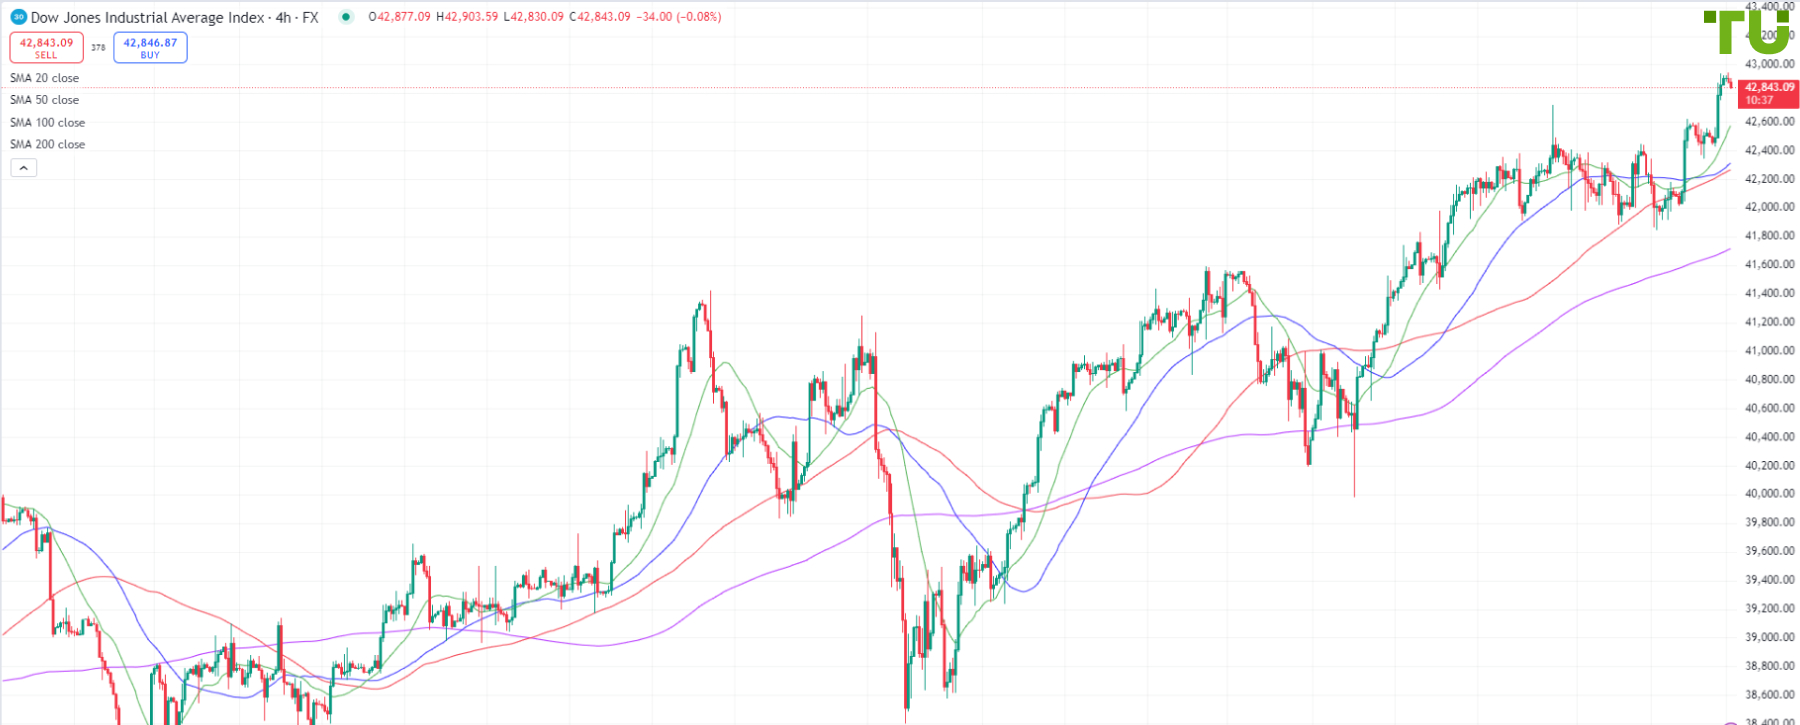
Optimism over a potential US-China trade deal has helped the US Dow Jones 30 index recover to 41765 resistance. On news of mutual tariff reductions, this resistance was broken and the index tested 42335. Bulls may next target 42600–42800 resistance; losing 42200 support would lead to a decline toward 42000–41800, where bullish activity may resume.
DJ30 recovered losses
05.05.2025
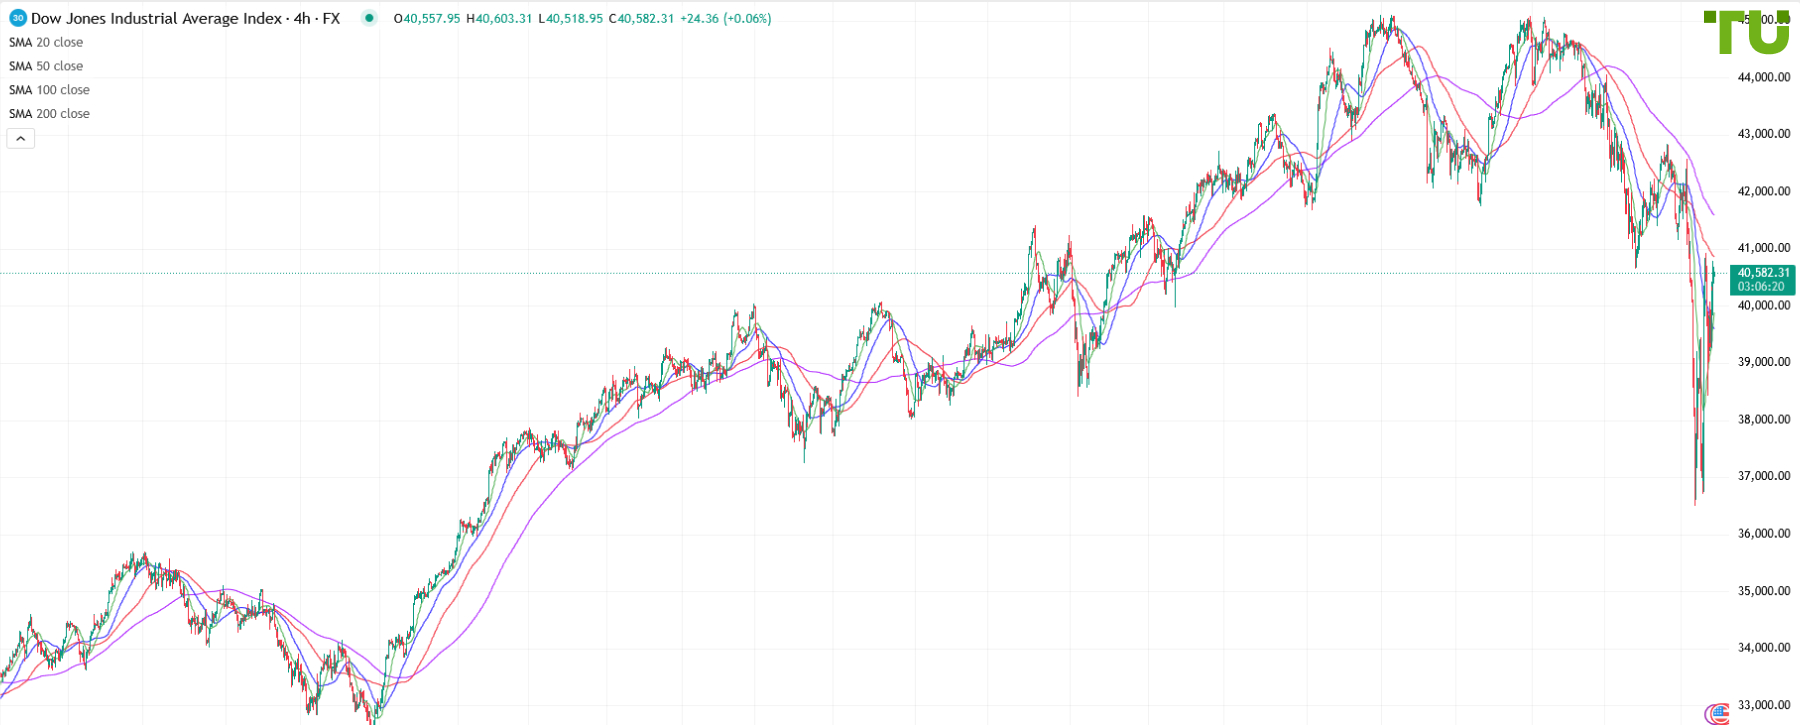
Despite uncertainty surrounding the impact of tariff policy on the US economy and corporate performance, the decline in the US Dow Jones 30 index was limited by 39750 support. After testing it, the index rose to 41380 resistance, but at the start of the new trading week, its price pulled back to 41000 support. On the decline, demand may persist, allowing bulls to test 41300–41400, though in the context of Trump’s trade wars, a sell-off on rallies cannot be ruled out. A loss of current support would lead to a decline toward 40800–40500.
DJ30 bought on dip
23.04.2025
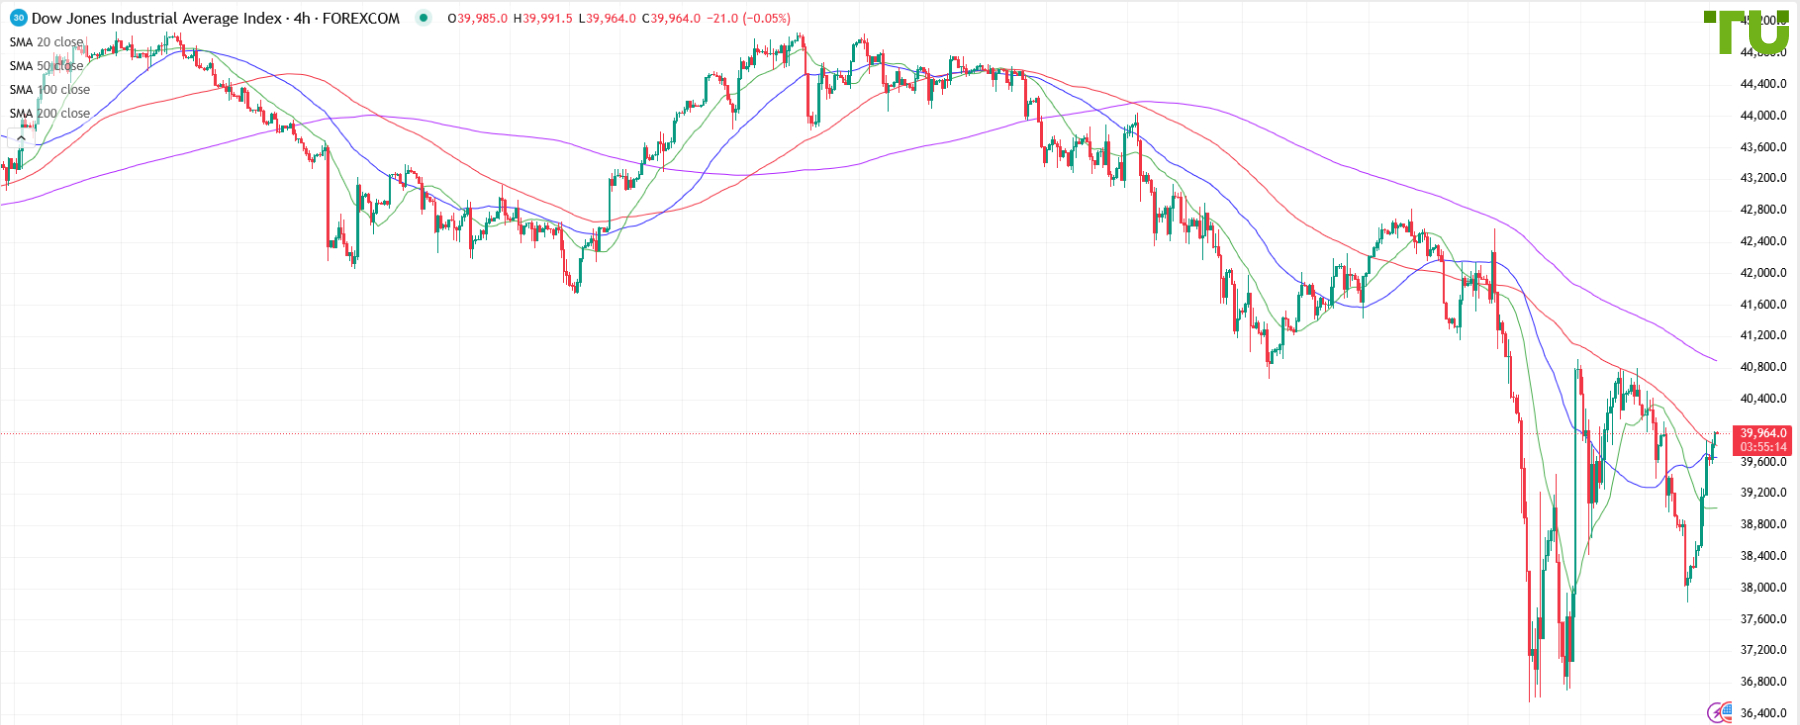
Trump’s tariff policy and his initial intention to seek Jerome Powell’s dismissal triggered a decline in stock indices, with the US Dow Jones 30 testing 37830 support. However, Trump’s clarification that he does not intend to pursue Powell’s dismissal, along with short-covering, contributed to a recovery toward 39985. Nonetheless, in the context of trade wars, the recovery may be used for selling, with 39570 support as a potential bearish target. A break of current resistance would open the way for a rise toward 40300–40500.
DJ30 recoups losses
14.04.2025
The tariff policy of Donald Trump provoked a sell-off on stock markets, against which the American index Dow Jones 30 collapsed to support near the levels of 36750-36500. The pause in the increase in tariffs on goods from a few countries contributed to the activation of the bulls, which brought the index back to the resistance of 40750. Demand is now seen from the 38500 level, a break of 40000 keeps chances of further recovery towards 41500-42000, but with uncertainty over Trump's actions, bulls should be extremely cautious.
DJ30 recovering after drop
31.03.2025
Amid trade wars, stock markets remain in a depressed state. The Dow Jones index was once again sold off and plunged to 41,150 support. As the new trading week begins, bulls are attempting to regain control, testing 41,615 resistance. A breakout would lead to a rise toward 41,900. A pullback to 41,450 may be used for buying, while a loss of this level would result in a decline toward 41,250-41,150.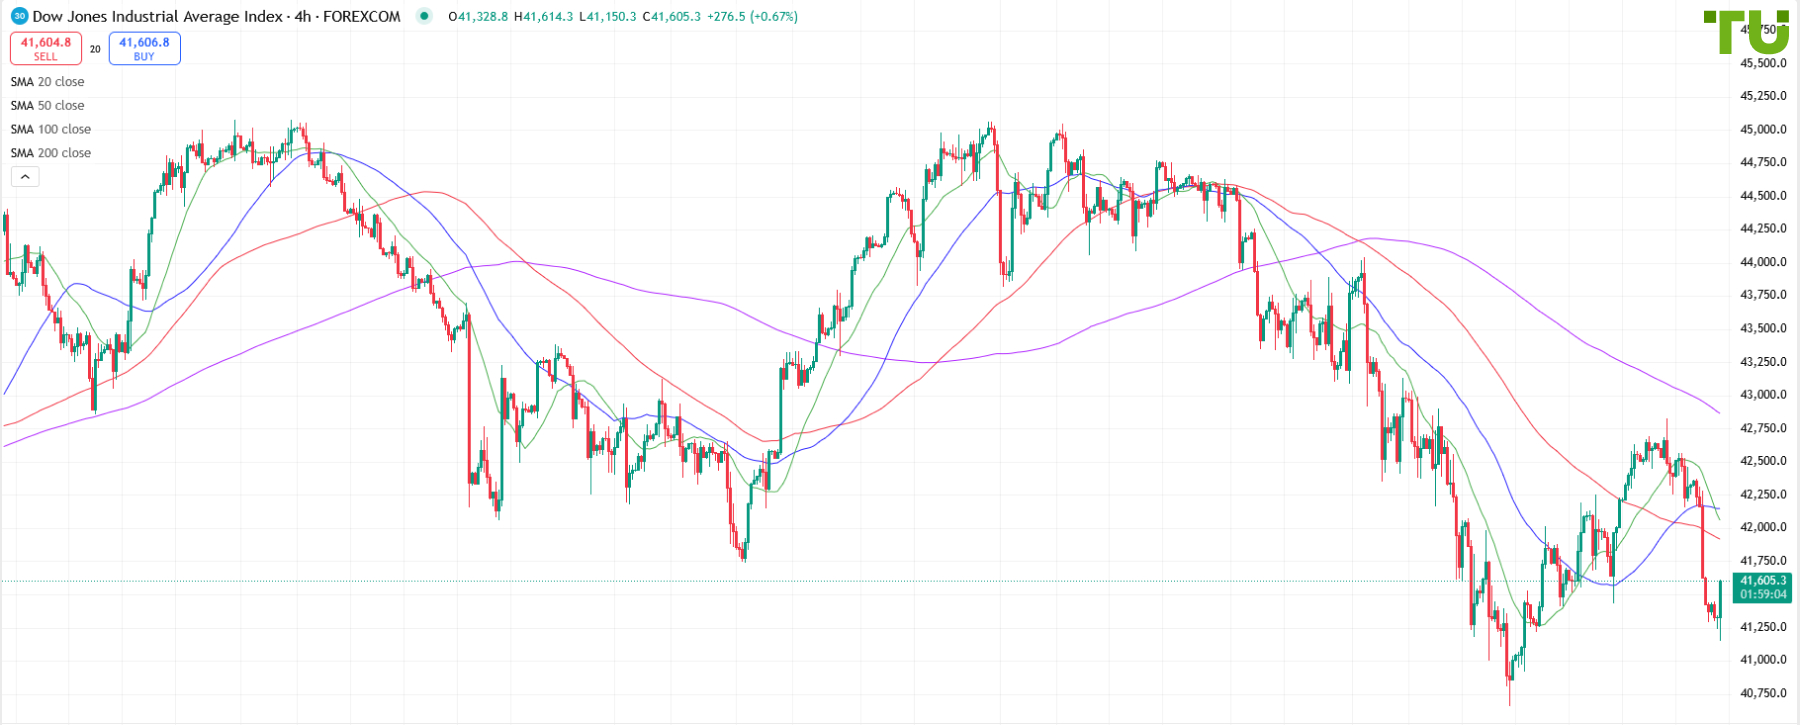
DJ30 recovering losses
24.03.2025
Amid Donald Trump’s tariff policy, the Dow Jones index plunged to 40,750 support, but its declines continue to attract buying interest, allowing it to rise to 42,484. Bulls may next test 42,800-43,000 resistance. A loss of 42,200 support would result in a drop toward 42,000.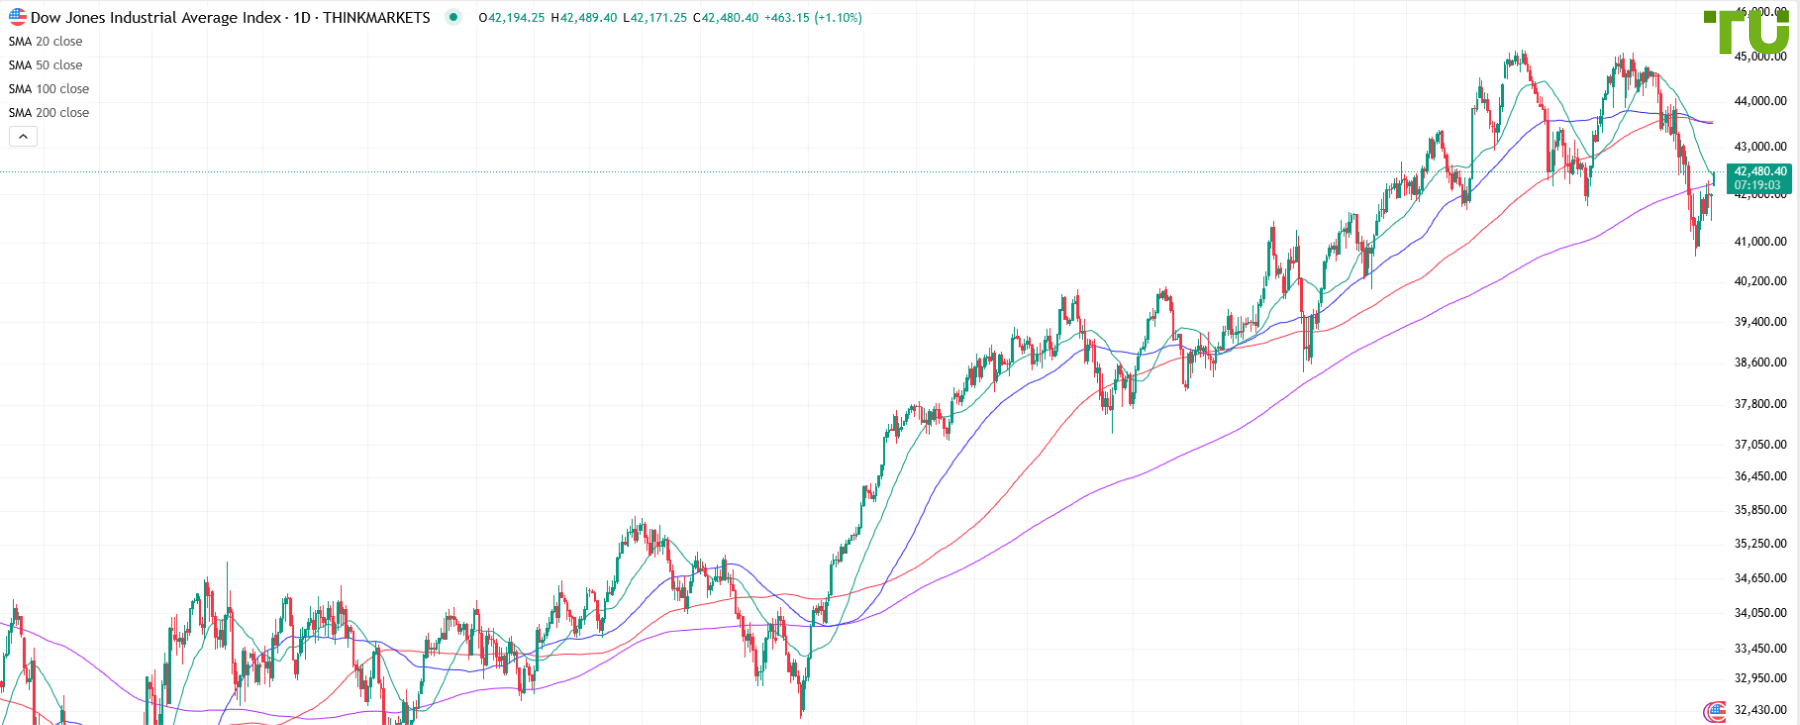
DJ30 recovering after drop
17.03.2025
Throughout the past week, the Dow Jones index was under sustained selling pressure, breaking multiple support levels and testing 40,475. Bulls have since managed to recover part of the losses and test 41800 resistance. They may next target 42000, while a loss of 41530 support would result in a decline toward 41300-41200. Amid Trump’s tariff policies, stock indices may remain vulnerable, but bears should still be extremely cautious.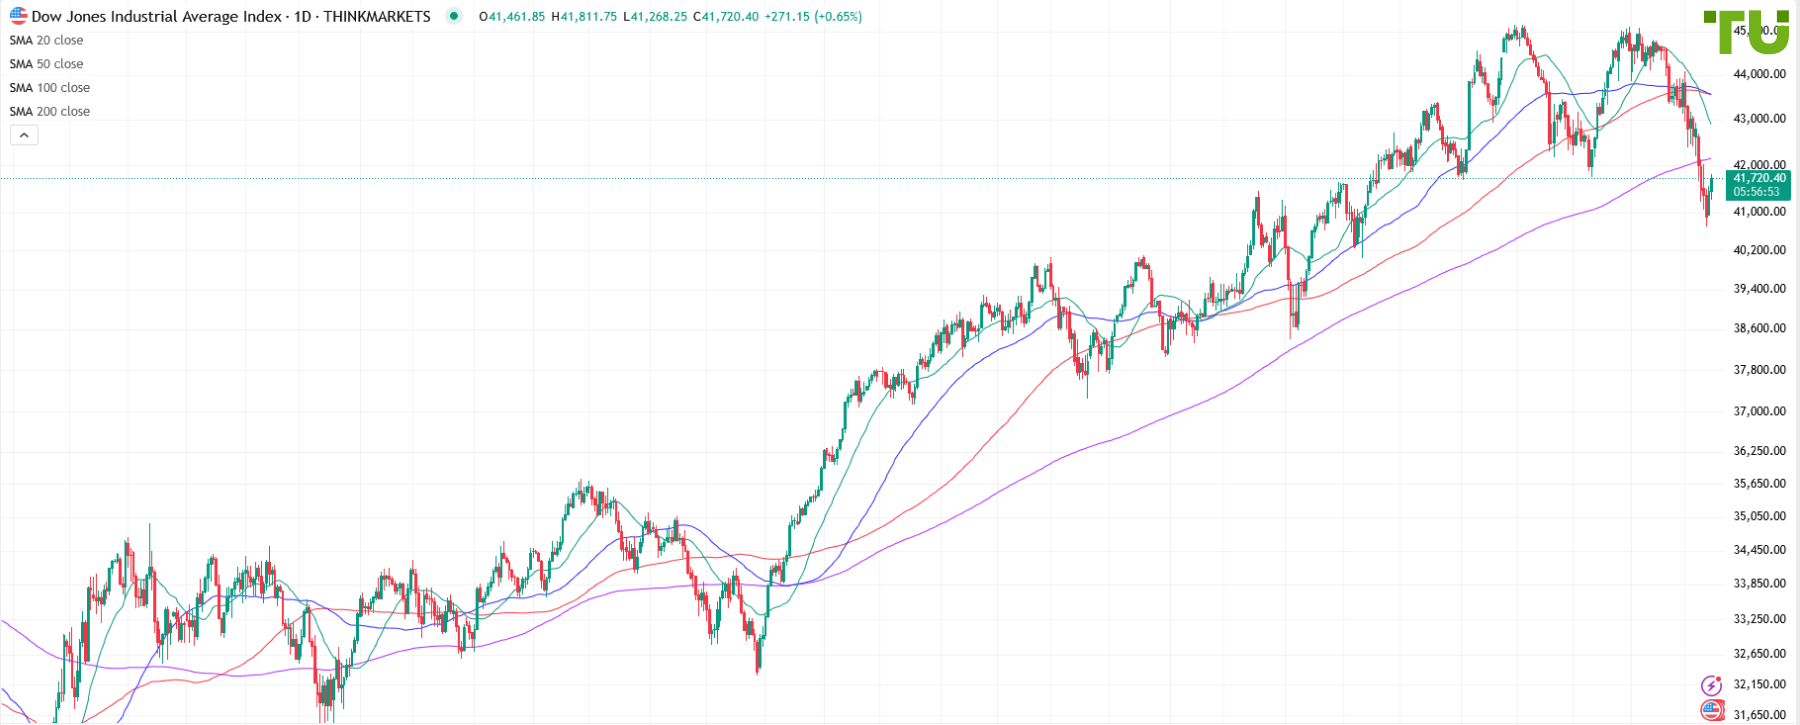
DJ30 sells off
10.03.2025
Amid trade wars initiated by Donald Trump, stock indices remain under bearish control. The Dow Jones index resumed its decline, breaking multiple support levels and testing 42,220. A break below this mark would result in a decline toward 41,900-41,700, where buying interest may emerge. A break of 42,420 resistance would lead to a rise toward 42,600-42,800. Growth attempts may be used for selling.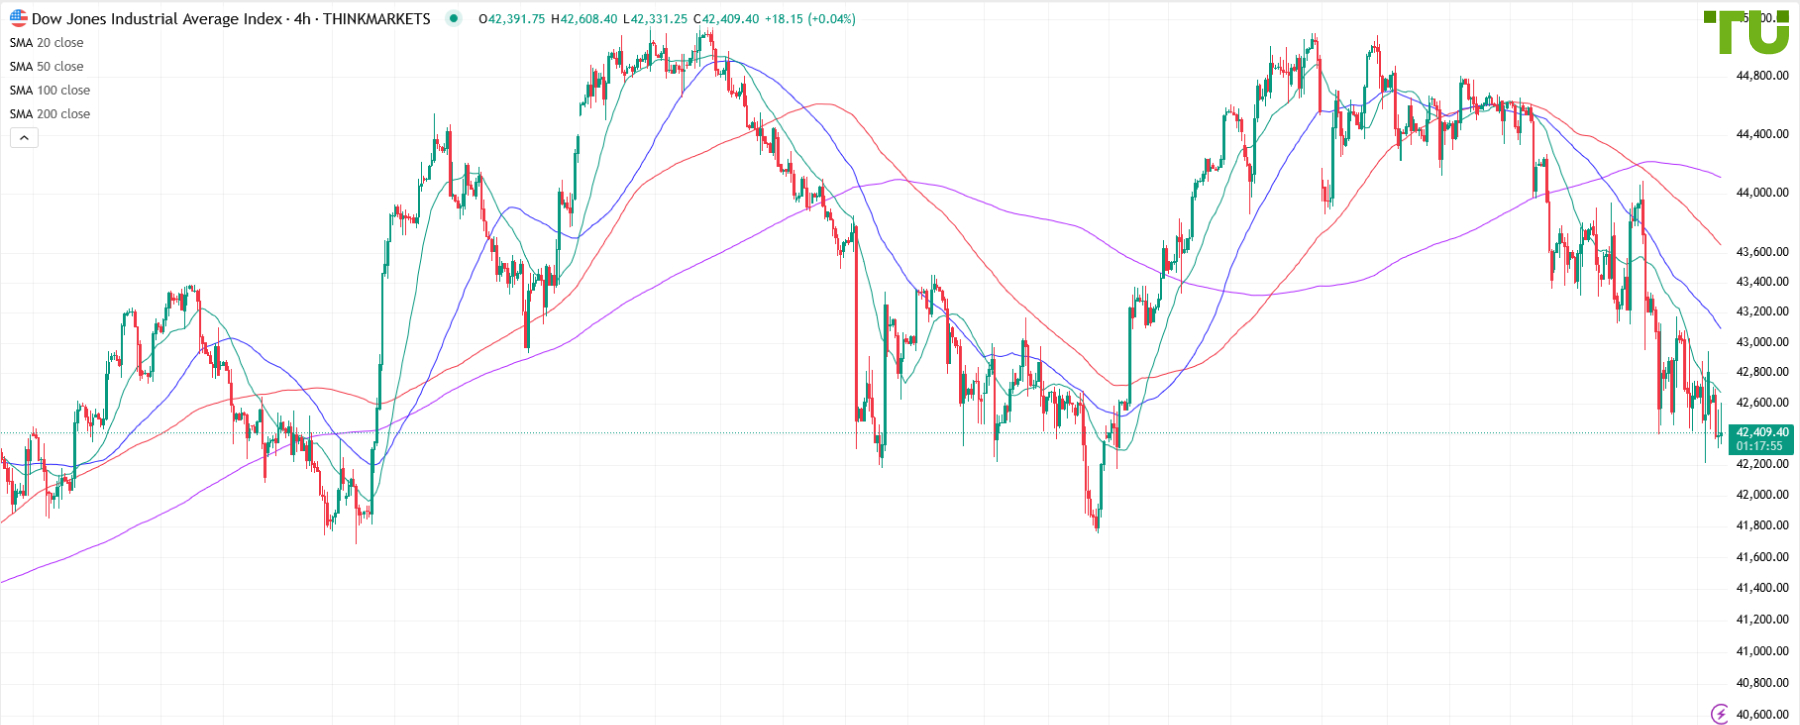
DJ30 challenging resistance
03.03.2025
Throughout the past week, the Dow Jones index traded within a wide range between 43,320-43,130 support and 43,800-43,930 resistance. At the start of the new week, bulls continue attempting to break resistance, which would allow the index to advance toward 44,260-44,400. The chances of a rise are currently higher than the likelihood of a drop to support.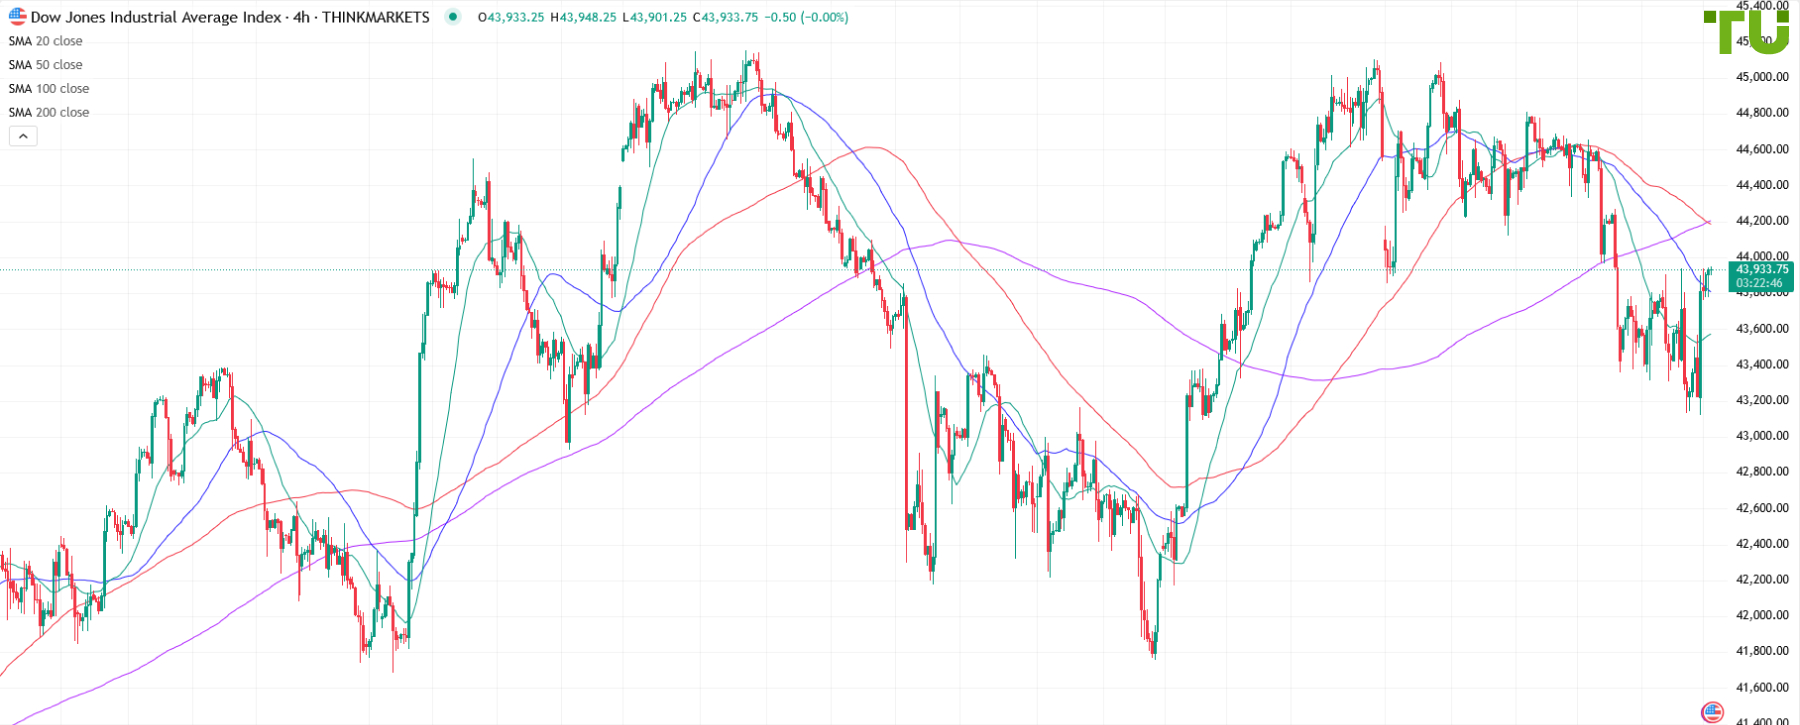
DJ30 under bearish control
24.02.2025
The Dow Jones index’s consolidation ended with a break of strong support at 43,900 and a decline to 43,380. Rebounds are currently capped by 43,750 resistance, from which the index may decline toward 43,550-43,450. A break above resistance would lead to a rise toward 43,900 and could signal the end of the downward correction.
DJ30 under pressure but demand on declines persists
17.02.2025
Trump’s tariff policy contributes to pressure on the Dow Jones index, but its declines continue to attract buying interest. Against this backdrop, bulls are attempting to break 44,800 resistance, and the chances of a rise to 45,000-45,100 resistance remain rather high. A loss of 44,500 support would result in a decline toward 44,300-44,150, where bulls may also step in.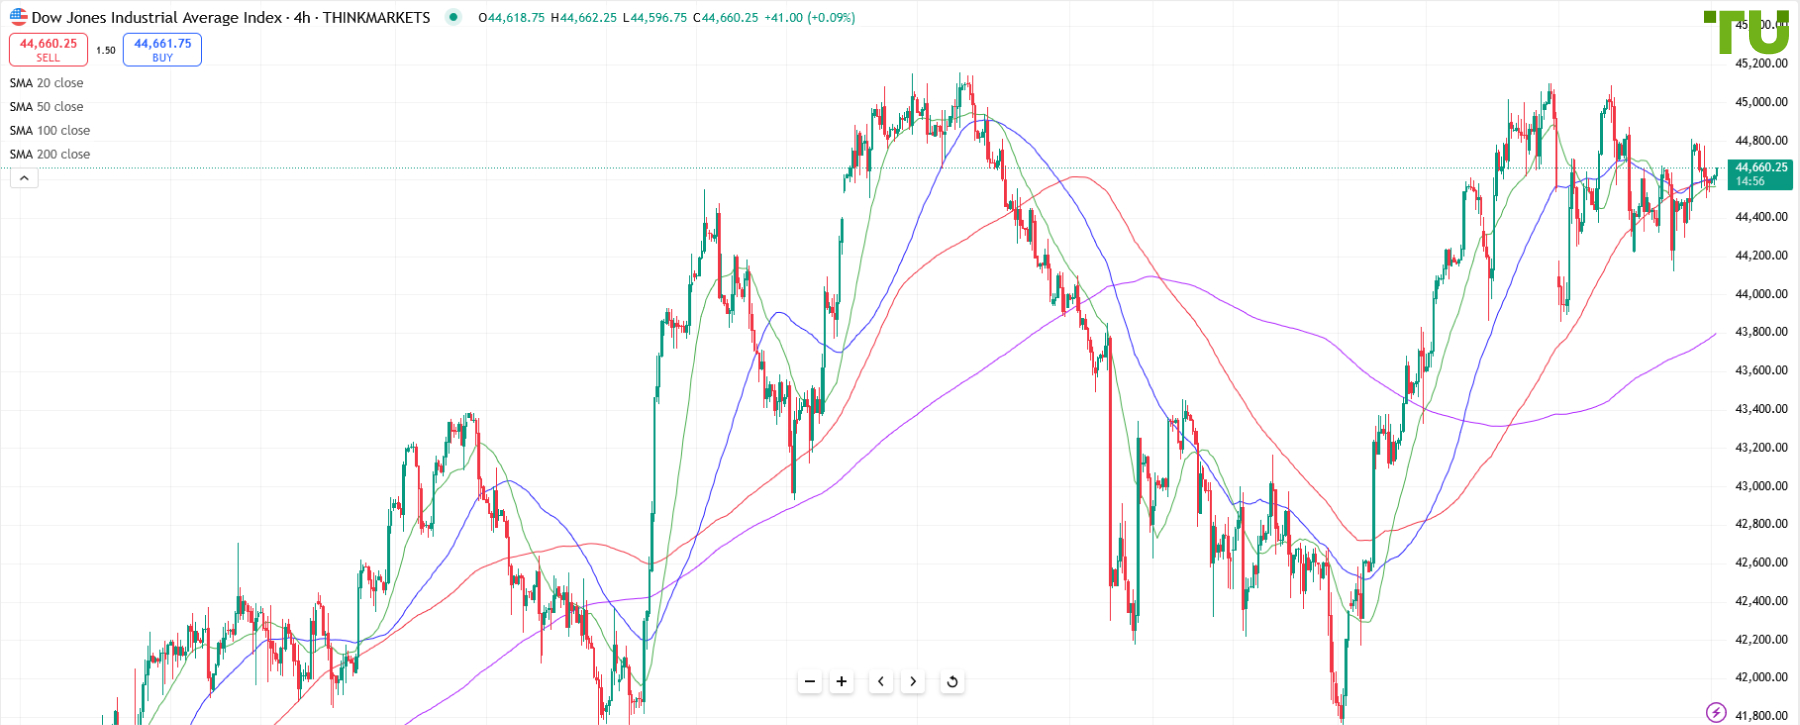
DJ30 bought on dips
10.02.2025
The Dow Jones 30 index continues to be bought on dips, but bulls still cannot break resistance at 44,950-45,050. Donald Trump’s tariffs are having a negative effect on the performance of stock indices, but companies’ financial statements support demand. A return to the mentioned resistance would increase the chances of a breakout and a rise toward 45,300-45,500. A loss of 44,300 support would result in a decline toward 44,000.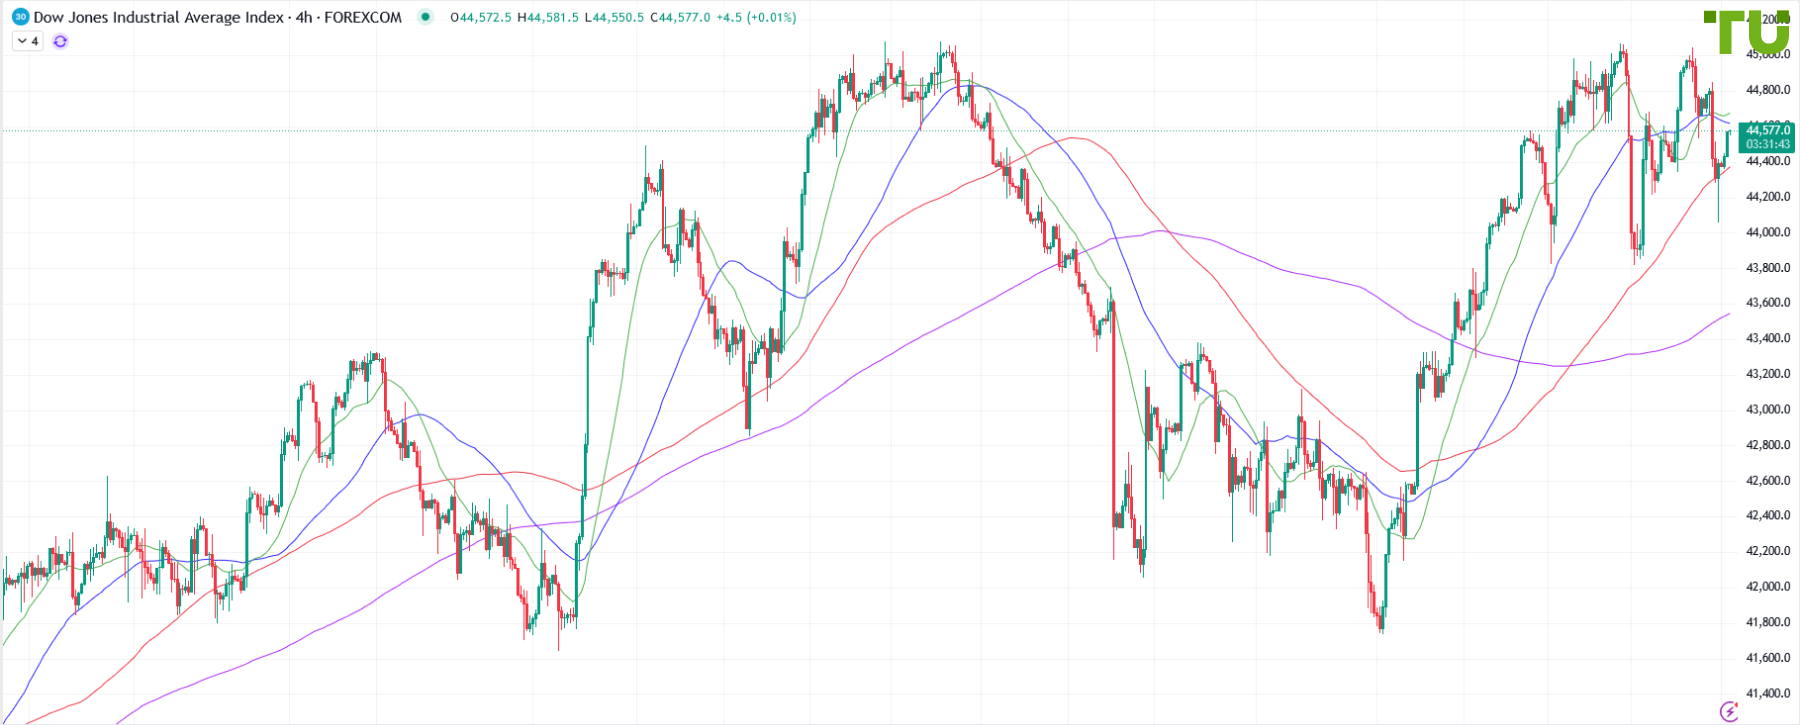
DJ30 sells off after rise
27.01.2025
As a result of a renewed rise, the Dow Jones 30 index broke 44,200 resistance and tested 44,570. At this level, it faced selling pressure again, allowing bears to test 43,830. The nearest resistance is now at 44,080, indicating risks of a support break and a decline toward 43,700-43,600. A break above resistance would lead to a rise toward 44,200-44,400.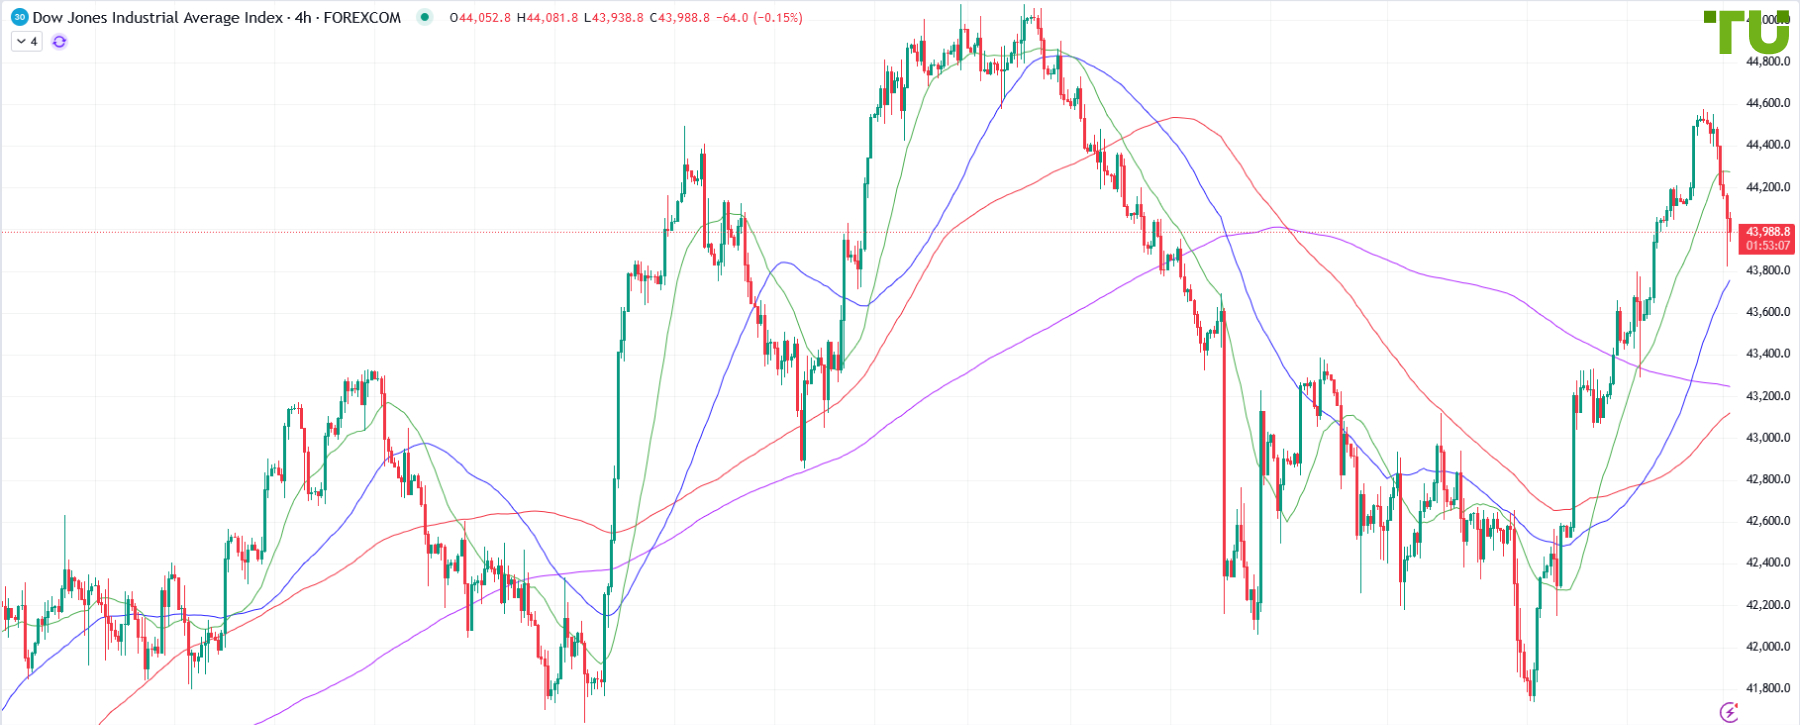
DJ30 bought on drop
20.01.2025
After breaking 42,100 support, the Dow Jones 30 index tested 41,760. Buying from this level allowed bulls to break several resistances and test 43,640. The return above 43,300 may improve the index’s outlook, but its further performance could depend on Trump’s actions after inauguration. At this point, it is best to refrain from opening new positions.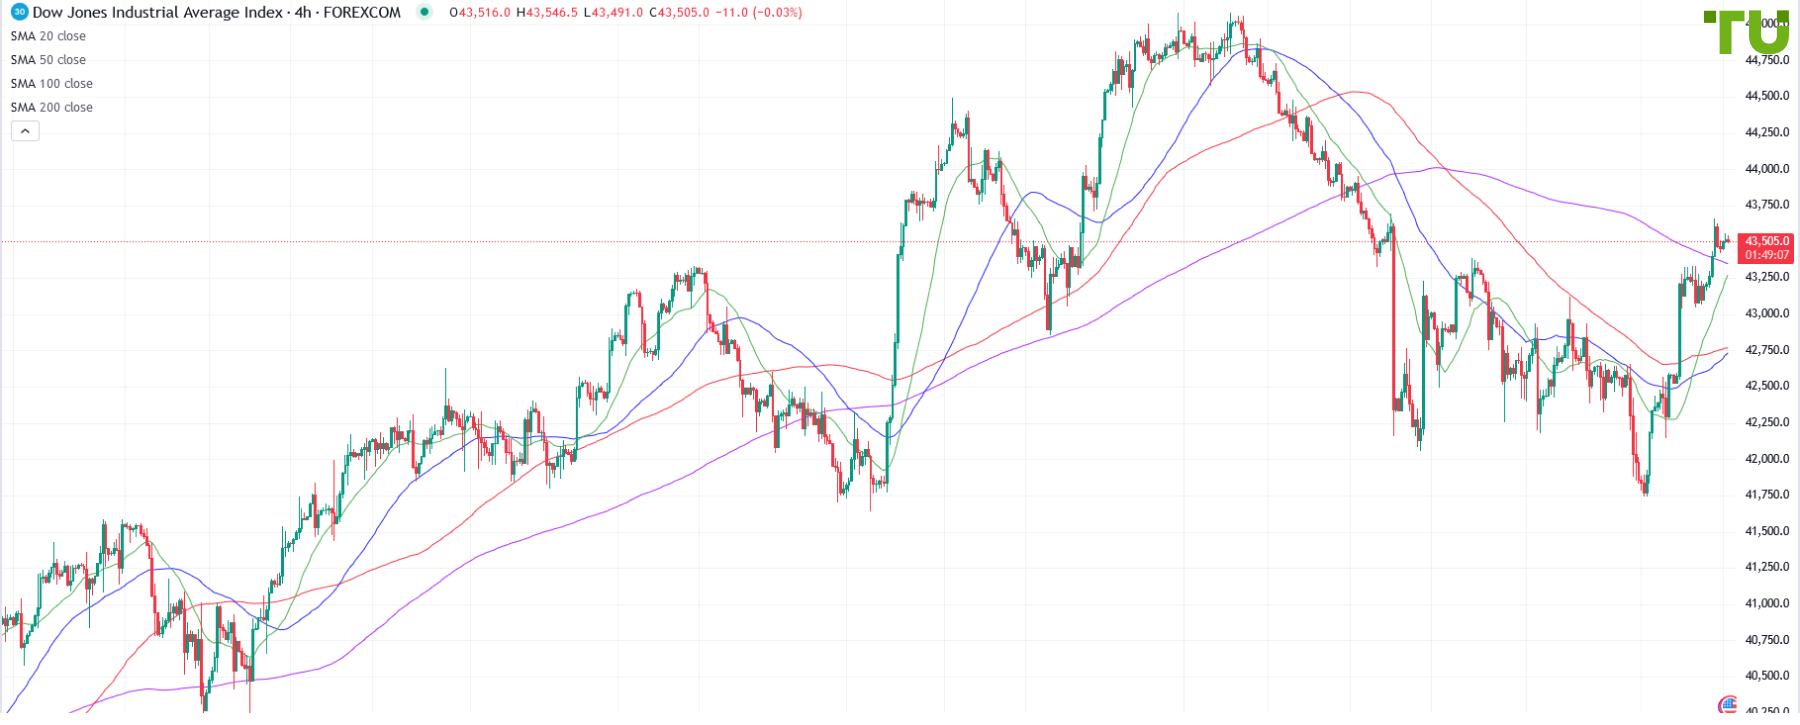
DJ30 continues to drop
13.01.2025
The Dow Jones 30 index started the year with attempts to develop an upward correction, but was sold from 43,100 resistance and declined to 41,750 support. Currently, once again attempting to develop a correction, the index has tested 42,130 resistance, from which attempts to return to recent lows may occur. A break above this resistance would lead to a rise toward 42,300–42,500. The tariffs introduced by Trump could maintain pressure on stock indices, but declines in the DJ30 may still be used for buying.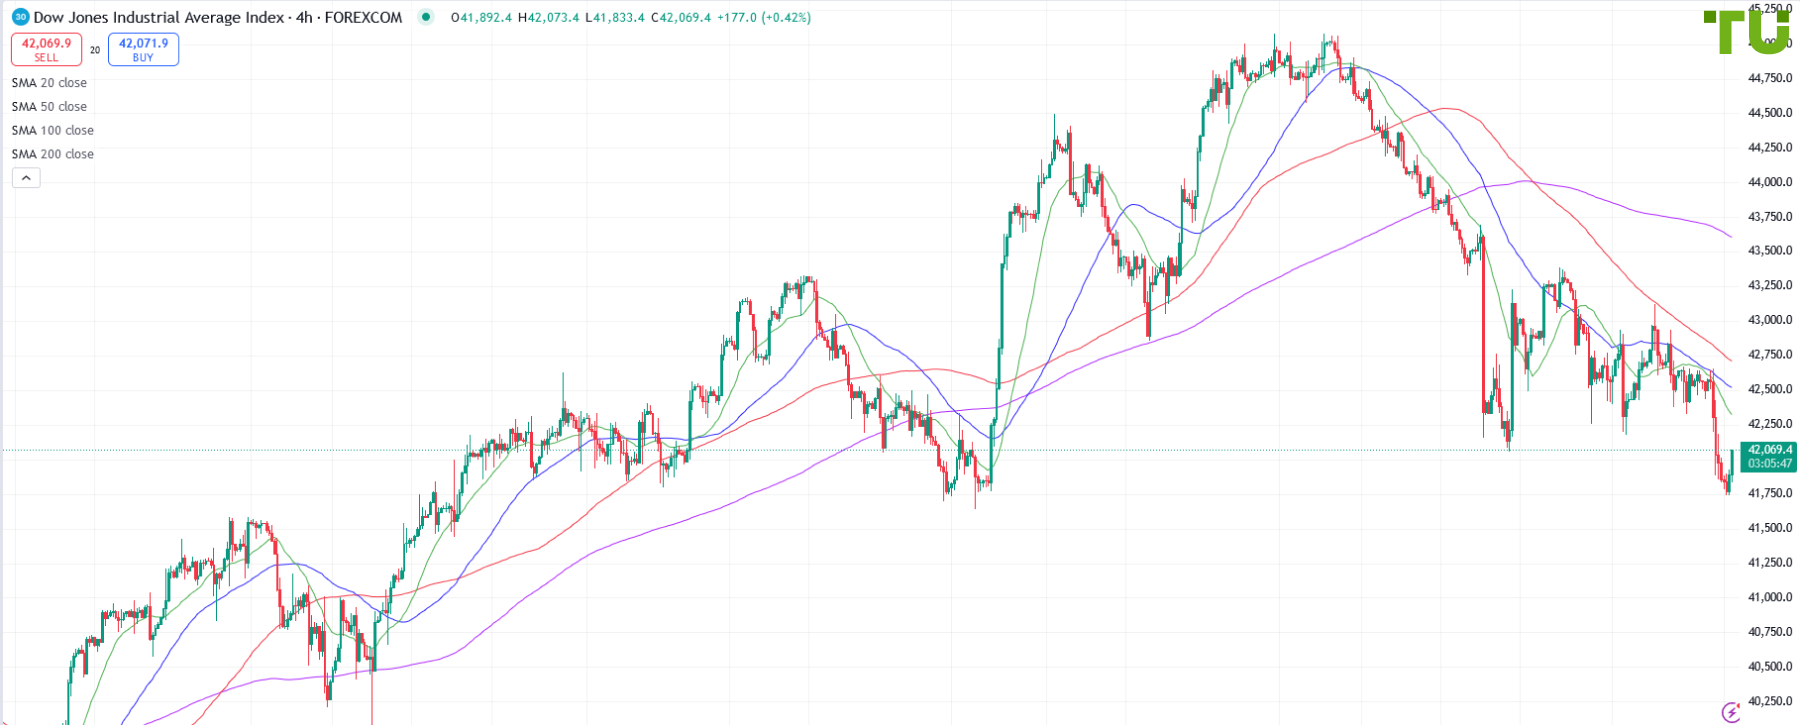
DJ30 recovering losses
06.01.2025
At the end of last year and the beginning of the new one, stock indices remained under bearish control. Selling the Dow Jones 30 led to a drop to 42,150 support, but buying from this level allowed bulls to challenge 42,900 resistance again. The chances of breaking it and rising toward 43,200–43,400 have significantly increased. However, if the resistance holds, the index could decline to 42,550–42,500 support, where bulls may also step in. A loss of this support would lead to a drop toward 42,250.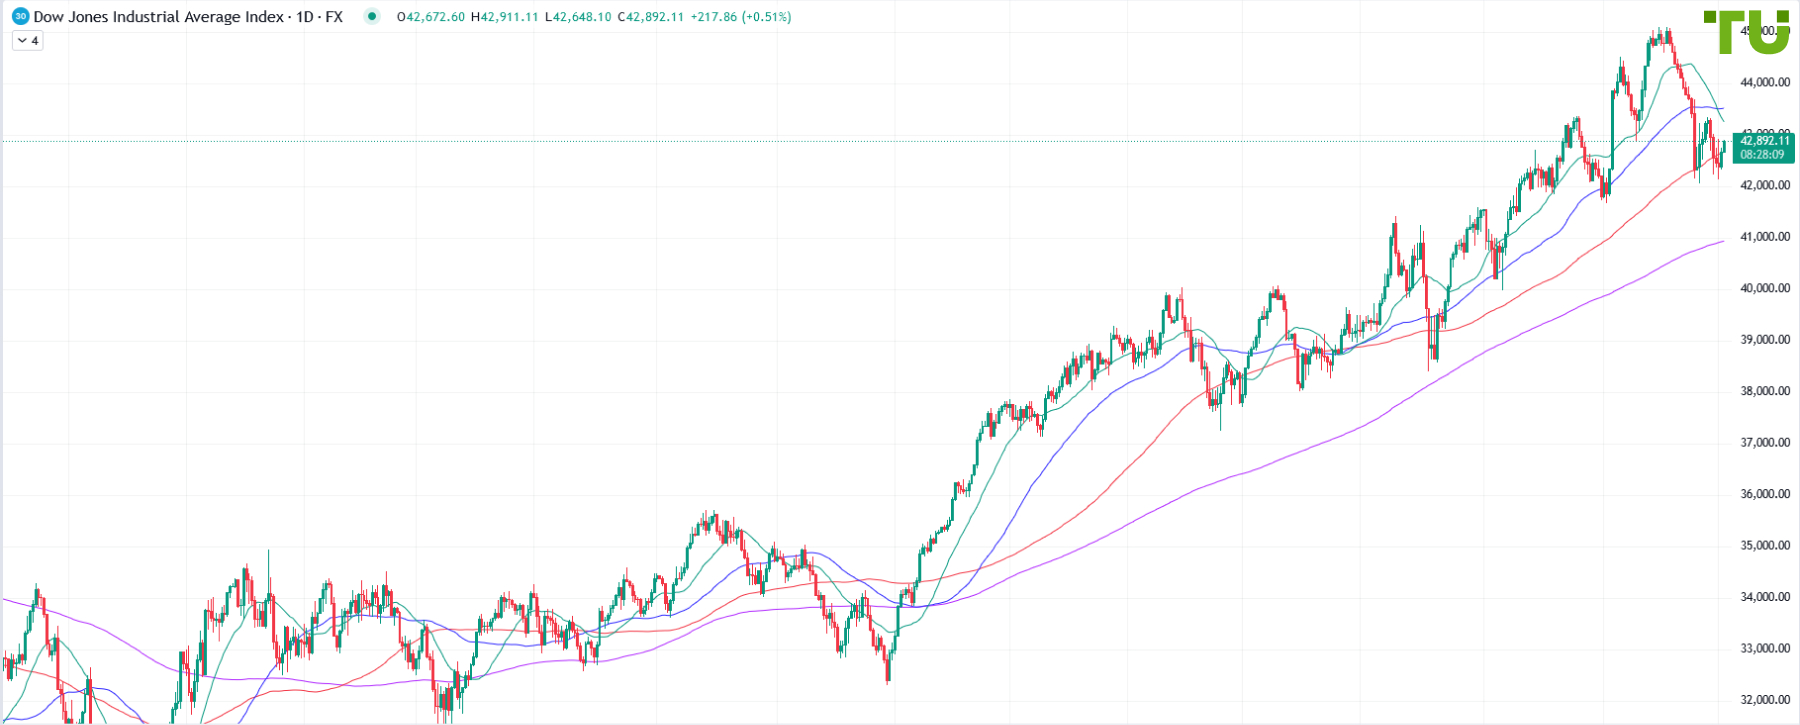
DJ30 declines again
30.12.2024
Stock indices are likely to end the year with the corrective decline that has led the Dow Jones 30 to break 42,700 support and drop to 42,355. Therefore, bears may retest the strong support at 42,085, where buying and a rebound toward 42,500 could occur. A break below the support would open the path toward 40,000, while a break above 42,550 would result in a rise toward 42,750–42,900.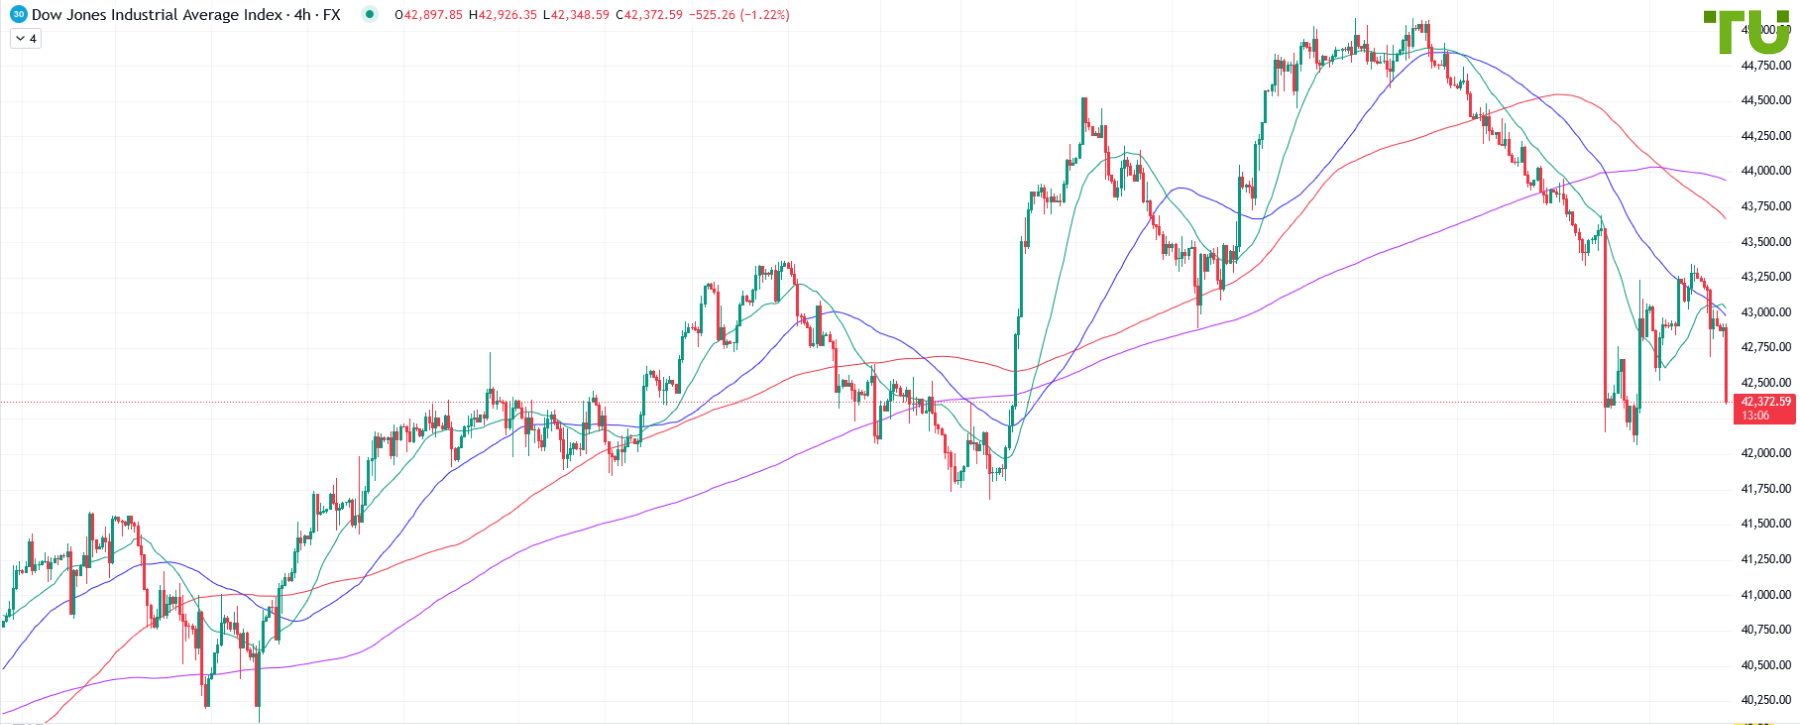
DJ30 sells off again
23.12.2024
Following the latest Fed rate cut, sell-offs in the stock market continued. The Dow Jones 30 Index broke 43,350 support and declined to 42,080 before rebounding to 43,230 resistance. Selling from this level pushed the Index down to 42,722. Bears may next target support at 42,500-42,330. A break below it would lead to a decline toward 42,200-42,100, where bulls may step in. Clearing 43,050 resistance would result in a rise toward 43,400-43,500.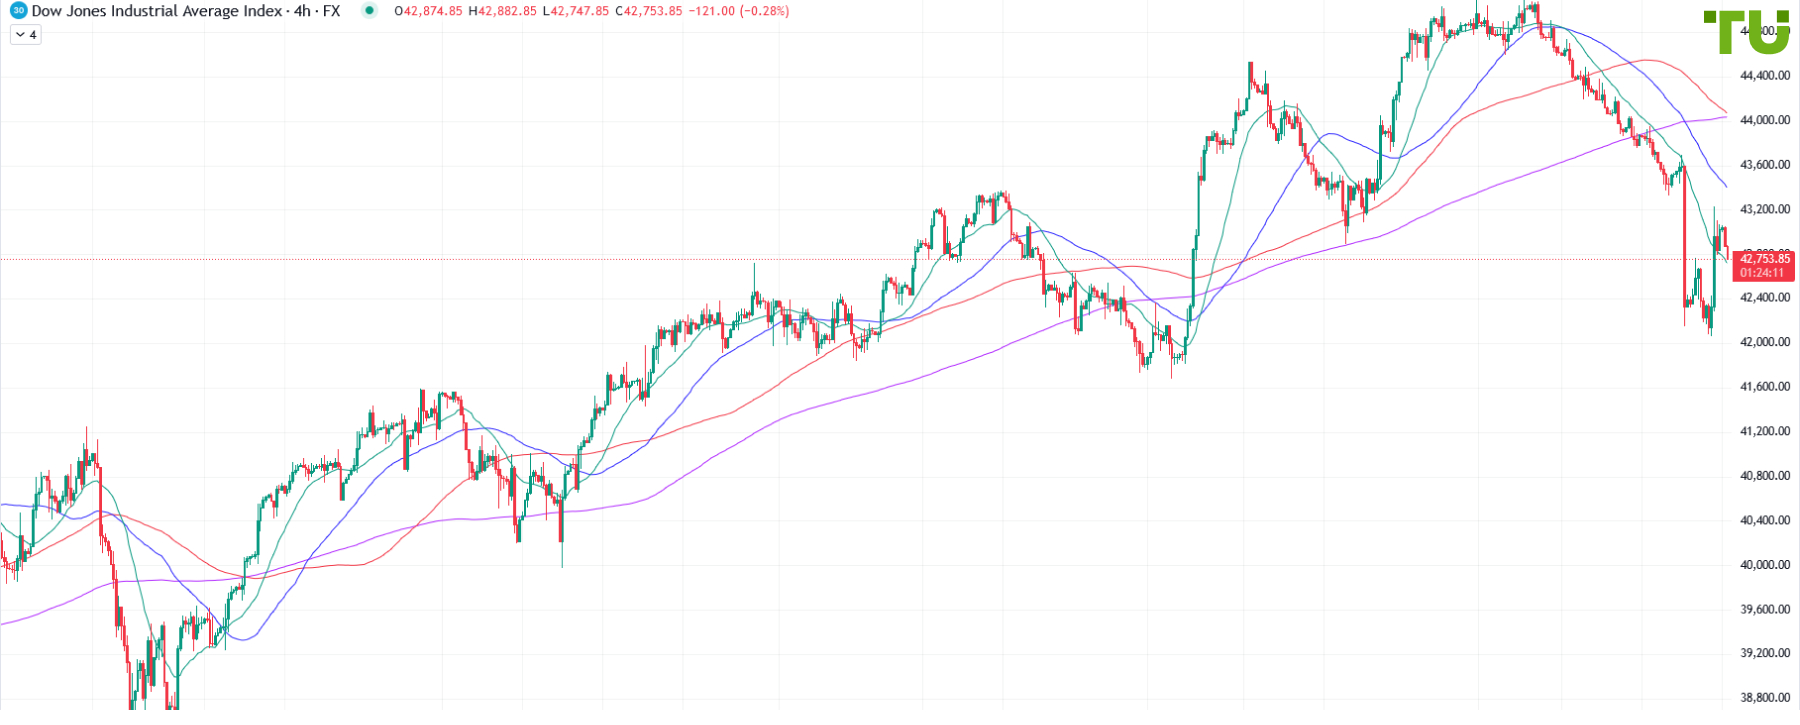
DJ30 in corrective decline
17.12.2024
Stock indices, particularly the Dow Jones 30, are experiencing a corrective decline. After unsuccessful attempts to break resistance at 44,050-44,100, the index lost several support levels and tested 43,680. The nearest strong support is at 43,350, where buying interest may emerge, potentially leading to a rise toward 44,000-44,200. A loss of the strong support would result in a decline toward 43,000-42,900, where bulls may also step in.
DJ30 closes week near support
09.12.2024Last week, positive sentiment persisted in stock markets, but Dow Jones 30 Index bulls failed to break 45,080 resistance. The weekly close near 44,600 support increases the risk of a break below this level and a decline toward 44,400-44,000. Bulls may step in on the drop.
DJ30 hits new highs
02.12.2024
The latest decline in the Dow Jones 30 Index was limited by 43,000 support, and after testing it, bulls broke 44,615 resistance and tested 45,165. The nearest support is now at 44,800, above which the potential for breaking resistance and rising further remains. Resistance at 45,300-45,400 may be tested next, but bulls should be extremely careful. A loss of support would lead to a decline toward 44,600-44,500.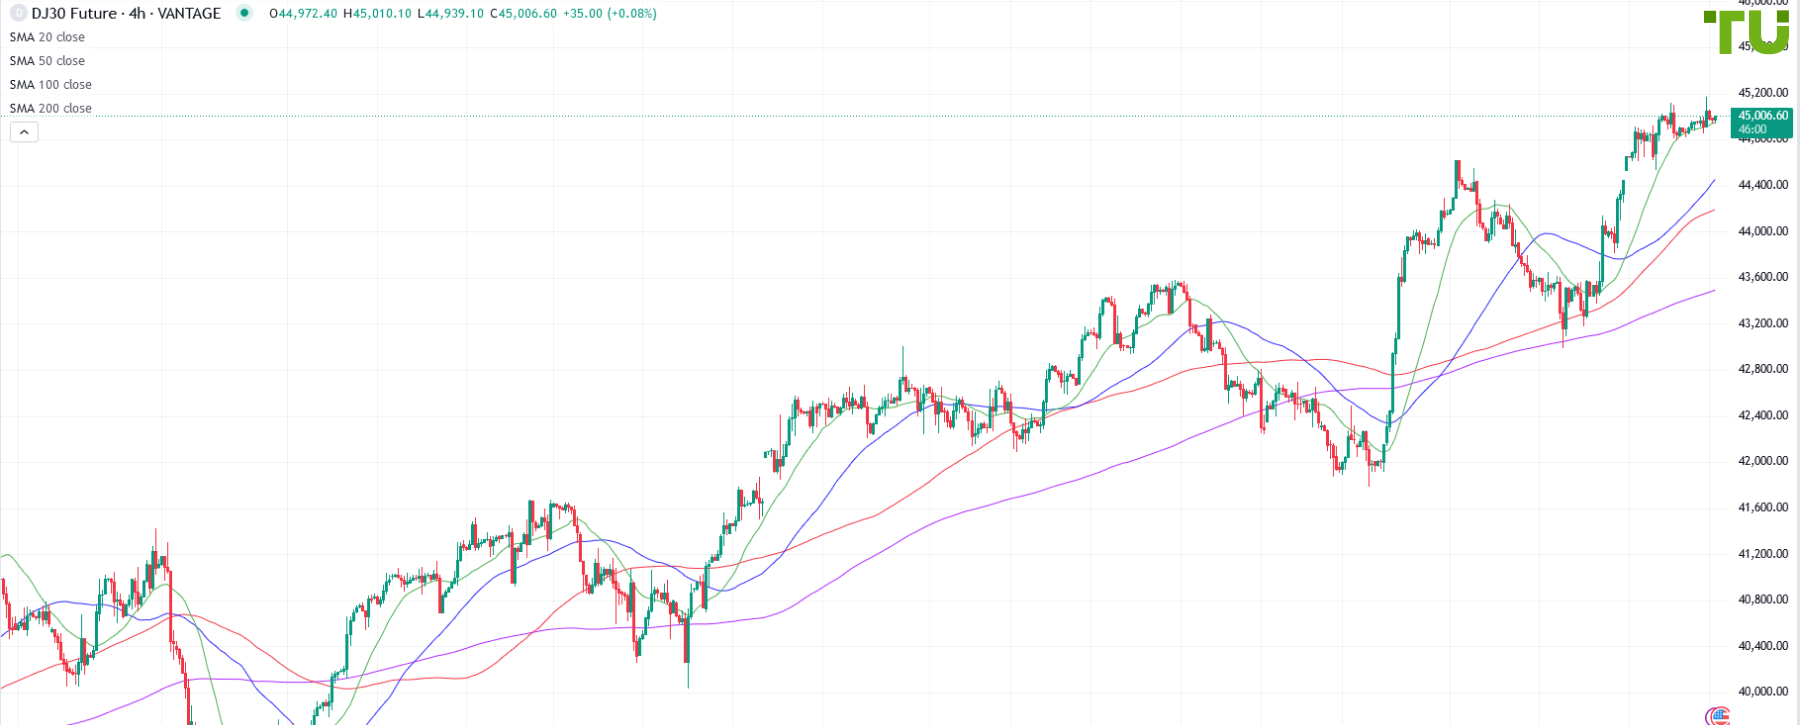
DJ30 rises again
25.11.2024
Sell-offs in U.S. stock markets led to a drop in the Dow Jones 30 Index to 43,000 support. However, demand remained on the decline, allowing bulls to regain control and push the Index up to 44,700 resistance. Hitting new highs may once again prompt profit-taking on long positions, which could cause the Index to decline toward 44,200-44,000. A break above the current resistance would result in a rise toward 45,000.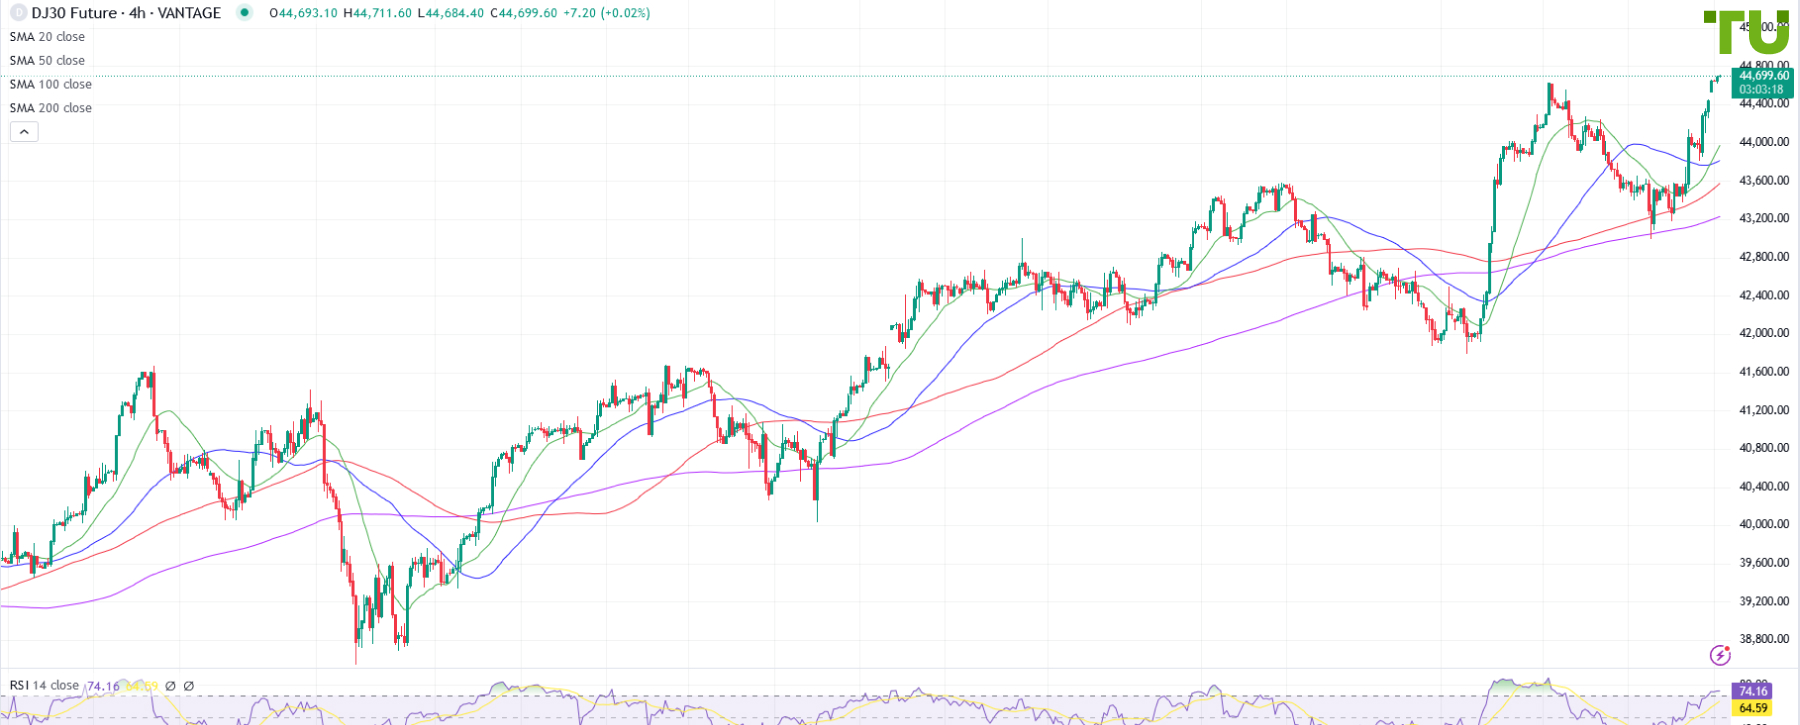
DJ30 hits new highs
11.11.2024
Donald Trump’s victory in the U.S. presidential election has strengthened the upward momentum of stock indices, particularly the Dow Jones 30. As its rally continued, the previous high at 43,572 was broken and 44,350 was tested. On the 4H timeframe, the RSI is in the overbought zone, suggesting some profit-taking on long positions and a correction, but a further rise toward 44,500 is not ruled out.
DJ30 remains under pressure
04.11.2024
Throughout last week, the Dow Jones 30 Index was under selling pressure, with bulls unable to overcome 42,630 resistance and bears testing 41,795 support. A weak U.S. non-farm payroll report did not provide significant support for the Index, so bears may retest 41,795. Breaking 42,160 resistance would result in a rise toward 42,360. Until the outcome of the U.S. presidential elections is announced, fluctuations in either direction may occur.
DJ30 recovers after drop
28.10.2024
After reaching new highs at 43,388, the Dow Jones 30 Index came under selling pressure and declined to 42,080 support. Nevertheless, every pullback attracts buying interest, and bulls are currently testing 42,527. They may next test resistance at 42,750-42,950, where bears could step in. Losing support at 42,350-42,250 will likely lead to a decline toward 42,100.
DJ30 hits new highs
21.10.2024
The latest decline in the U.S. Dow Jones 30 Index to support at 42,740 attracted buying interest, allowing bulls to break resistance at 43,220 and test 43,370. The Index continues to be bought on pullbacks, and amid sustained risk appetite, a break above the current high and a test of 43,500-43,600 may occur. Losing 43,200 support will lead to a decline toward 43,050-43,000.
DJ30 hits new highs
14.10.2024
Stock markets are once again dominated by bullish sentiment. The Dow Jones 30 Index resumed its rise after a pullback to 41,900 support, breaking 42,700 resistance and reaching 42,940. This break above recent highs suggests further upward movement, with 43,000 as the next potential target. The index appears somewhat overbought, which could trigger profit-taking on long positions, but bulls are likely to step in on any decline.
Dow Jones chart live
{{filterName}}
{{typeName}}
Why do investors need Dow Jones forecasts?
For a prudent investor interested in trading Dow Jones, the live chart and a professional forecast are the key instruments for building short, medium and long-term strategies. TU analysts publish Dow Jones forecast for today, tomorrow and weekly forecast. The forecast is based on technical analysis data. Traders also need to consider the impact of the following fundamental factors on the price chart:
- U.S. economic data (trade balance, unemployment, GDP, etc.);
- Latest news and indicators of companies included in the index;
- Exchange rate of the U.S. dollar (a direct dependence is observed);
- Statements of the U.S. Federal Reserve on changes to the interest rates.
By knowing what impacts Dow Jones and using the forecast by TU experts, you will be able to achieve good returns.
FAQ
1
Is Dow Jones a good investment?
The Dow Jones Index comprises economically prominent stocks of global companies, which makes it a good investment. Monitor the forecasts, live chart and latest news and you will be able to earn profit.
2
What companies are in DJIA?
The composition of Dow Jones is not permanent. Initially, it was conceived as an industrial index, but now it features 30 companies from different industries and sectors, including Apple, Amgen, American Express, Boeing, Cisco,
Walt Disney and others.
3
Is the Dow Jones Index an exchange-traded asset?
No, it is not (same as other indexes). However, Dow Jones futures are traded on NYSE,
NASDAQ, CME, CBOE under this ticker.
4
Can novice traders work with DJIA?
Trading Dow Jones is more suitable for professionals, as its price performance is difficult to predict. It is very important for beginners to track Dow Jones forecasts and start trading in a safe virtual environment (on a demo account).