How to use Support and Resistance indicator for MT4/MT5
Support and Resistance indicator for MT4/MT5 automatically finds the levels or zones, where several recently formed fractals are located. The indicator works on all timeframes, on all markets, not redrawn and has flexible settings.
Support and resistance (S&R) is an important concept in the day-to-day work of a trader that helps reduce the risks and find more accurate points of entry to the market.
What is support? It is a level or ‘zone’, which works as a sort of an obstacle against the downward trend of the price. Resistance, therefore, is the level of ‘zone’ that acts as an obstacle against price growth.
This article will provide a simple and effective method of finding the support and resistance levels / zones using a free indicator available for the popular MetaTrader 4 platform.
You will find the download link below.
Support and resistance review
For those yet unfamiliar, support and resistance (S&R) is a crucial concept in the world of day-to-day trading. This is because it helps reduce the risks while also finding more accurate points of entry to the market.
Either way, support is a level or ‘zone’ that functions as a barrier against the downward trend of the price. Support is a term used to describe the point at which demand is strong enough to prevent the stock from being further devalued. The logic behind this mechanism is that as the price falls and approaches the point of support, the demand increases, and sellers are then less willing to sell.
On the other hand, resistance is the level of ‘zone’ that serves as a barrier against price growth. It is a term that is used to describe the level at which supply is strong enough to prevent the stock from increasing. The logic behind this mechanism is that as prices increase and approach the point of resistance, sellers become more likely to sell, and buyers become less likely to buy.
Moreover, one essential element of technical analysis is that when the support level is broken, its role is reversed. In other words, the level becomes resistance If the price falls below a support level. Likewise, the level will become support if the price rises above a resistance level.
👍 Pros
• The indicator works on all timeframes (it is advisable to choose at least M15)
• The indicator works on all markets
• Doesn’t redraw
• Flexible settings
👎 Cons
• There is no guarantee that the levels will work the way you expect them to
• The indicator does not issue warnings / alerts
How Does the Indicator Work?
The work of the indicator is based on the fractal indicator built into the MT4 platform. The fractal is a local extremum described by Bill Williams.
The support and resistance indicator automatically finds the levels or zones, where several recently formed fractals are located. It is a sign that the level / zone works as support / resistance.
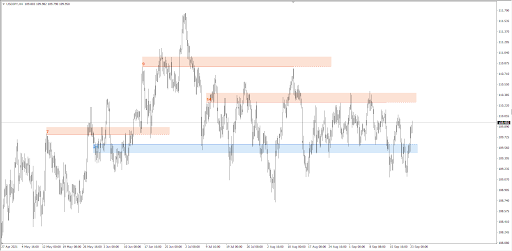
Support and Resistance Levels
The indicator shows the found levels by color:
-
Blue – support levels;
-
Orang – resistance levels.
The figure shows the number of fractals. The higher the figure, the stronger the level. By clicking on the figure, you will see fractals, which were used for building the level.
Support&Resistance Best Strategies
There are three basic strategies for trading based on the support and resistance levels:
-
1
The reversal
-
2
The breakout
-
3
The breakout test
The reversal
This is the most apparent strategy, when the trader needs to sell near the resistance levels and sell near the support levels (see examples on the chart below).
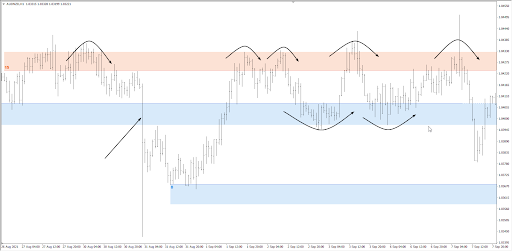
The Reversal Strategy Example
The hazard of this strategy is that it will cause losses during sharp movements. Therefore, you probably should avoid using it during the release of important news (shown by the arrow above).
The Breakout
This strategy implies the sale of the asset once its price breaks the support level and purchase of the asset once the price breaks the resistance level.
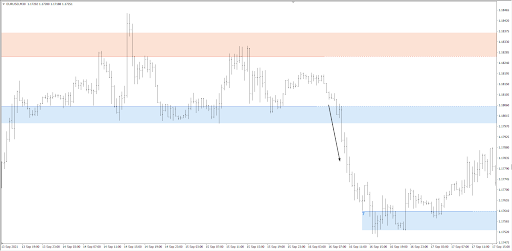
The Breakout Strategy Example
It is rational to apply this strategy at the start of active market sessions (European and American), when expecting important news and when the price is within a narrow range for a long time.
The Breakout Test
This strategy uses the “mirror” level principle, i.e. after the breakout the resistance works as support and the former support becomes resistance.
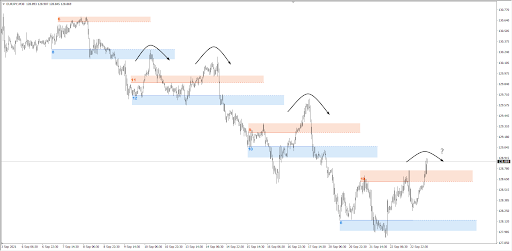
The Breakout Test Strategy Example
The chart above shows how during the downward trend, the blue support levels, after the breakout, offered resistance to the growing prices, thus providing opportunities for entering a short position.
Which of the 3 strategies should be used?
There is no definitive answer to this question, as strategies listed above cannot be just right or wrong. They all will provide profitable and false signals. Try using each of them on a demo account to see which one suits you the best.
Most importantly, cut the growing losses and evaluate profit growth potential.
Best Forex Brokers For Trading With Indicators


Support&Resistance Settings
Support&Resistance Indicator has simple and flexible settings.
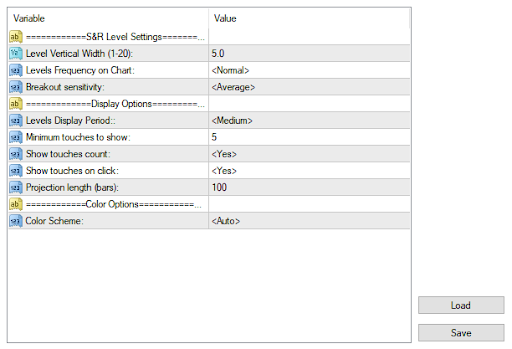
Support&Resistance Settings
Level Width – from 1 to 10
1 – the indicator will show narrow levels
20 – wide zones
Frequency – this setting determines how tightly the levels are placed
More – more tightly
Less – the most significant levels are shown
Sensitivity – how quickly can the level be considered broken
High – in order for the level to be considered broker, a minimum number of fractals need to appear after it
Low – lower sensitivity of the indicator for the level breakout.
Display Period – this setting determined the number of candlesticks on the history that is analyzed.
Short = 300 candlesticks
Long = 1,200 candlesticks
Touches to show – minimum required number of fractals for building a level
Show touches count – displaying the number of fractals in the left part of the level (true / false)
Show touches on click – whether to show the fractals when clicking on their number (true / false)
Projection length – how far into the future should the levels be shown
Should I Use Support&Resistance Indicator?
Support and Resistance Level / Zone indicator will be useful for all regardless of their expertise:
For the beginners. The indicator can provide valuable assistance to those who do not know how to build S&R levels on their own.
For experienced traders. It saves times, allows you to build strategies, by combining
Support&Resistance Indicator – Download for Free
To download the indicator to your computer, click on the link below. The file contains no viruses.
How To Set Up Support&Resistance Indicator in MT4
The installation of the indicator is usual. Here is a step-by-step guide for the users of Windows:
Launch your Metatrader
Open the folder with the platform data using the File/Data Folder menu
In the folder, open MQL4/Indicators folder
Insert Support&Resistance.ex4 file from the downloaded archive
Restart your MT4 platform (or refresh the Navigator window).
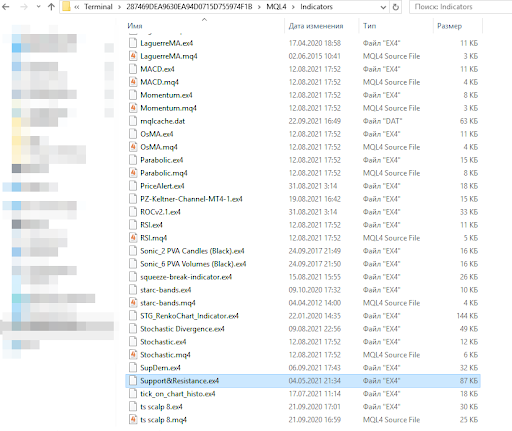
How to Set Up Indicator
That’s it! All is set. You can now open any chart on the MetaTrader 4 platform and add S&R indicator to it through the menu Insert / Indicators / Custom / SupportResistance.
What is an S&R indicator Formula? How is it calculated?
When it comes to S&R formulas and how they’re calculated, it’s important to note that developers do not disclose such information. However, each trader chooses and employs the tools that work best for them.
Is S&R indicator accurate?
In general, S&R indicators are pretty accurate in most cases. However, it shows the most basic support and resistance levels for beginners. Therefore, if you are on the beginner level, these levels are helpful, while advanced traders may find the info less than useful.
Expert Opinion
I've found the Support and Resistance indicator to be a useful tool, but it's important to understand its limitations. No indicator is a substitute for developing your own eye for finding these significant price levels.
That said, the S/R indicator can serve as a helpful starting point, especially for newer traders who are still learning to identify levels manually. By highlighting zones where prices have reacted in the past, it draws attention to areas that may act as future barriers. However, not all generated levels will prove meaningful, so it's important to back up any levels with additional confirmation on the chart.
In my experience, the best approach when using this indicator is to treat its levels as suggestions rather than guaranteed boundaries. Study how prices interact with the highlighted zones, and look for confirmation from other factors like changes in volatility or trading volume. Over time, your own feel for the "personality" of each market will become more refined than any indicator.
Also, I would advise using this indicator mostly on higher timeframes, where recent history remains clearly defined. On shorter timeframes price action can be more volatile and choppy, making it harder to identify reliable zones of support and resistance.

FAQs
What is MT4 indicator for support and resistance?
The Support and Resistance Lines indicator for MetaTrader is capable of calculating and charting the levels of support and resistance for the given currency pair or trading instrument.
How do you show support and resistance in MT4?
To show support and resistance in MT4, go to the “Insert” menu and navigate to Indicators and “Custom.” Lastly, simply select Support and Resistance to apply the indicator to the chart.
Which indicator is best for support and resistance?
When it comes to the top indicators, there is a variety to choose from. However, Fibonacci levels are a highly popular set of indicators that traders from all walks of life widely use.
Is there a version for the MT5 platform?
This developer does not offer a version for the MT5 platform, but you can search for alternatives on the MQL5 website.
Where should I set Stop Loss and Take Profit?
For example, when trading bounces, the Stop Loss should be set outside the zone, and Take Profit – in the area of the opposite zone. It is not a mandatory rule. As an option, you can use the ATR indicator to calculate the levels of safety orders.
Is this indicator enough to trade Forex?
Totally. The Support and Resistance indicator can be used as a stand-alone instrument. It also works great as a filter for signals of other indicators. Try to play around with it.
I don’t like the levels the indicator builds. What should I do?
The indicator is based on a built-in algorithm, which can’t be changed. If changing the settings does not yield the desired result, try to build the levels manually. It is more difficult, but then, you will definitely like them.
Glossary for novice traders
-
1
Broker
A broker is a legal entity or individual that performs as an intermediary when making trades in the financial markets. Private investors cannot trade without a broker, since only brokers can execute trades on the exchanges.
-
2
Trading
Trading involves the act of buying and selling financial assets like stocks, currencies, or commodities with the intention of profiting from market price fluctuations. Traders employ various strategies, analysis techniques, and risk management practices to make informed decisions and optimize their chances of success in the financial markets.
-
3
Forex Trading
Forex trading, short for foreign exchange trading, is the practice of buying and selling currencies in the global foreign exchange market with the aim of profiting from fluctuations in exchange rates. Traders speculate on whether one currency will rise or fall in value relative to another currency and make trading decisions accordingly.
-
4
Index
Index in trading is the measure of the performance of a group of stocks, which can include the assets and securities in it.
-
5
Investor
An investor is an individual, who invests money in an asset with the expectation that its value would appreciate in the future. The asset can be anything, including a bond, debenture, mutual fund, equity, gold, silver, exchange-traded funds (ETFs), and real-estate property.


Team that worked on the article

Oleg Tkachenko is an economic analyst and risk manager having more than 14 years of experience in working with systemically important banks, investment companies, and analytical platforms. He has been a Traders Union analyst since 2018. His primary specialties are analysis and prediction of price tendencies in the Forex, stock, commodity, and cryptocurrency markets, as well as the development of trading strategies and individual risk management systems. He also analyzes nonstandard investing markets and studies trading psychology.

Dr. BJ Johnson is a PhD in English Language and an editor with over 15 years of experience. He earned his degree in English Language in the U.S and the UK. In 2020, Dr. Johnson joined the Traders Union team. Since then, he has created over 100 exclusive articles and edited over 300 articles of other authors.

Mirjan Hipolito is a journalist and news editor at Traders Union. She is an expert crypto writer with five years of experience in the financial markets. Her specialties are daily market news, price predictions, and Initial Coin Offerings (ICO).