Best RSI settings for day trading
Relative Strength Index is one of the most popular basic oscillators of the majority of trading platforms for novice traders. Day trading strategies are the most common type of trading strategies. Trading inside the day eliminates swap costs, gives you time to make decisions and earn a good profit relatively fast.
In this review, you will learn about the following:
-
RSI indicator description. Basic settings and main signals. Rules for indicator settings optimization.
-
Comparison of RSI signal efficiency depending on the timeframe, period, levels of key zones.
-
How to use RSI indicator. Best settings.
This article will be particularly useful for novice trading searching for the best settings through testing strategies.
Basic RSI settings
RSI The Relative Strength Index (RSI) is an oscillator that evaluates overbought and oversold conditions. The indicator is drawn under the price chart and is displayed as a line moving with the range of 0-100. The closer the indicator to the edges of the range, the higher the probability of price reversal.
Basic RSI settings:
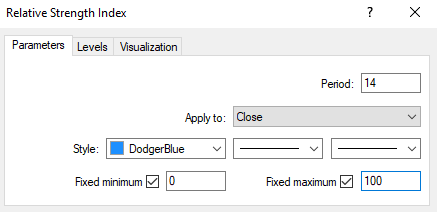
Basic RSI settings
Period. The period is set to 14 by default. It is the number of candlesticks used in the calculation of the parameter. The shorter the period, the sharper the movements of the RSI indicator and the more false signals it gives. The longer the period, the smoother the indicator’s line, but the slower it reacts to the price change.
Apply to: The type of price used in settings. For example Close price or High – the maximum value of the price on the candlestick (top of the shadow).
Style. Parameters for the visual display of the indicator line.
Fixed minimum and maximum levels on the chart.
In the Levels tab, you can change the values of key levels separating the standard range on the indicator movement from the overbought and oversold zones. They do not influence the calculation of the indicator and are needed for quick visual monitoring of the RSI values. By default, they are set at 30 and 70.
Best RSI settings for day trading
The RSI indicator can be used effectively in various day trading strategies. However, the settings may need to be adjusted based on the specific RSI trading strategy. Here are some guidelines for RSI settings for common day trading approaches:
Scalping (1 min, 5 min charts)
For scalping strategies with very short holding times, a faster RSI around 5-7 periods is best suited for 1 minute or 5 minute charts. This allows the RSI to react quickly to short-term price fluctuations. Use more extreme overbought/oversold levels like 20/80 or 10/90 to filter out weaker signals and reduce whipsaws.
Momentum Trading (5 min, 15 min charts)
For momentum strategies focused on trading the accelerating part of trends, use a slightly longer RSI period like 9-12 on 5 to 15 minute charts. This allows the RSI to capture moves lasting a few candles before overextending. Standard overbought/oversold levels of 30/70 work well for timing entries and not exiting too early. Trade with the momentum on pullbacks within the trend.
Range Trading (15 min, 30 min charts)
A slower RSI in the 14-25 range helps identify trading ranges and is best suited for 15 to 30 minute charts. Use narrowed levels at 40/60 to generate more signals to trade range reversals. Longer RSI periods above 20 will provide smoother range signals. Alternate long and short trades at range extremes.
Breakout Trading (15-30 min, 1-hour charts)
For breakout trading, an RSI period around 10-12 provides quick signals to capture emerging trends on 15 minute to 1 hour charts. Use wider overbought/oversold levels like 25/75 to avoid premature exits before full breakouts occur. Trade breakouts on the retests after the initial thrust.
Reversal Trading (15 min, 30 min charts)
For reversal strategies, an RSI period in the 10-14 range on 15 to 30 minute charts allows reacting quickly to overextensions. Use standard 30/70 levels to time bounces off extremes. RSI divergences identify high-probability entries and exits.
In summary, match faster RSI settings to smaller timeframes and slower RSI settings to larger timeframes based on your preferred trading style and strategy. Backtest to optimize reward potential.
Best brokers for day trading


How changing the settings changes the indicator value
Why do you need to change settings? Every asset has its “own character”. Volatility is one of the key criteria of the “character”. It can change depending on the trading session, interest of market makers, fundamental factors, chosen timeframe, etc. Accordingly, every time ‘section’ or timeframe requires its own period both for majors and exotic pairs, all other parameters being equal.
Here's an example. The publication of the NFT (USA) report has a strong impact on the EUR/USD pair for the next 3-4 hours. Volatility may sharply increase during this period and a directional short-term trend may appear. If you set the period for 12 on the M15 interval, it will mean that the interval that equals 3 hours will be included in the calculation. The settings set on the basis of this interval will be incorrect for other periods with no abnormal volatility.
Principles of settings optimization:
-
Optimization of the indicator settings is performed in the strategy tester, for example the built-in tester of the MT4 platform, Fx Blue, or Forex Simulator.
-
Testing is carried out on a time interval corresponding to 300-500 transactions. If the indicator gives a signal 1 time per day on average, the testing period is at least 1-1.5 years.
-
The test result is determined by the back test parameters. These include the mathematical expectation, the maximum drawdown, the ratio of the number of profitable and unprofitable trades, the maximum series of unprofitable trades.
-
In addition to statistical indicators, the stability of a trading strategy is important. It is determined by the nature of equity. The ideal deposit curve should have a steadily upward look for different numbers of transactions.
-
The best fitting of parameters is done in forward testing. The testing area is broken down into three sections. The selected indicator parameters chosen for the earlier sections are tested on the last section. The strategy is considered stable, when the results of the last section do not differ from the results of the previous sections.
The goal of testing is selection of the indicator parameters, where the strategy results in the maximum number of profitable trades with insignificant drawdowns and stable growth of the deposit curve.
Below, we will compare the effectiveness of the indicator signals for different periods on one timeframe, different timeframes in one period, different levels in one period and timeframe. Additional filters are not applied; RSI divergence and exit of the indicator line from overbought and oversold zones are used as signals. Touching of the 30 and 70 levels with a subsequent bounce off them is also viewed as a signal. If there is no obvious touch, the signal is not taken into account.
Comparison of RSI(3), RSI(14), RSI (48) signals on H1 timeframe
For comparison, we used the H1 timeframe, EUR/USD currency pair that has a slightly over average volatility on the H1 interval and periods 3, 14 and 48. The short period allows you to react instantly to the price change, and the 48-hour period (2 days) shows only strong trends.
Example of using the RSI indicator:
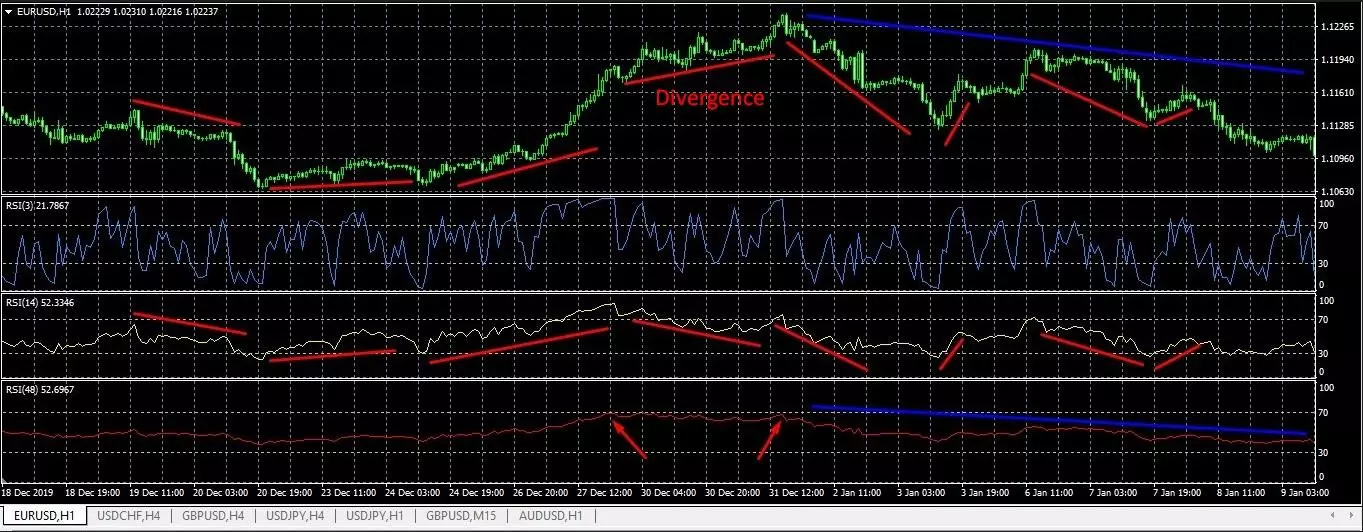
Example of using the RSI indicator
On the section of the chart that equals 3 weeks, RSI indicators with periods of 3, 14 and 48 are sequentially placed from top to bottom.
The following can be said about them:
-
Period 3. The chart has sharp divergences with frequent exits to the overbought and oversold zones. If you increase the chart scale, you can see that the indicator works on practically each candlestick. This is justified in scalping on M1-M5 timeframes, but practically has no sense on the H1 interval.
-
Period 14. It shows intraday trends rather well; the RSI indicator shows divergence once. Overall, the movement of the indicator from the edges of one zone to the opposite one reflects trend movement.
-
Period 48. The indicator barely touched 70 and went down. Smooth movement is typical of the indicator line that corresponds to the long downward movement. This period is interesting and may be effective, but is totally unsuitable for day trading.
Conclusion. Using a short period does not make sense. Using a long period only makes sense for long-term strategies for finding a strong upward or downward trend. The signals are very rare. For day strategies, it makes sense to use the default parameter of 14, slightly moving towards 10 or 18 depending on the asset volatility and goals. Testing will help fine-tune the parameter.
Comparison of RSI(14) signals on M5, M30 and H1 timeframes
The М1 and М5 intervals are often used in scalping strategies. High frequency of accurate signals and the indicator’s reaction speed are important here, because small periods are set for scalping. H1 is the most frequent interval for swing trading and day trading. For our comparison, we used the RSI indicator with the default period and EUR/USD currency pair.
Example of using the RSI indicator:
Timeframe M5.
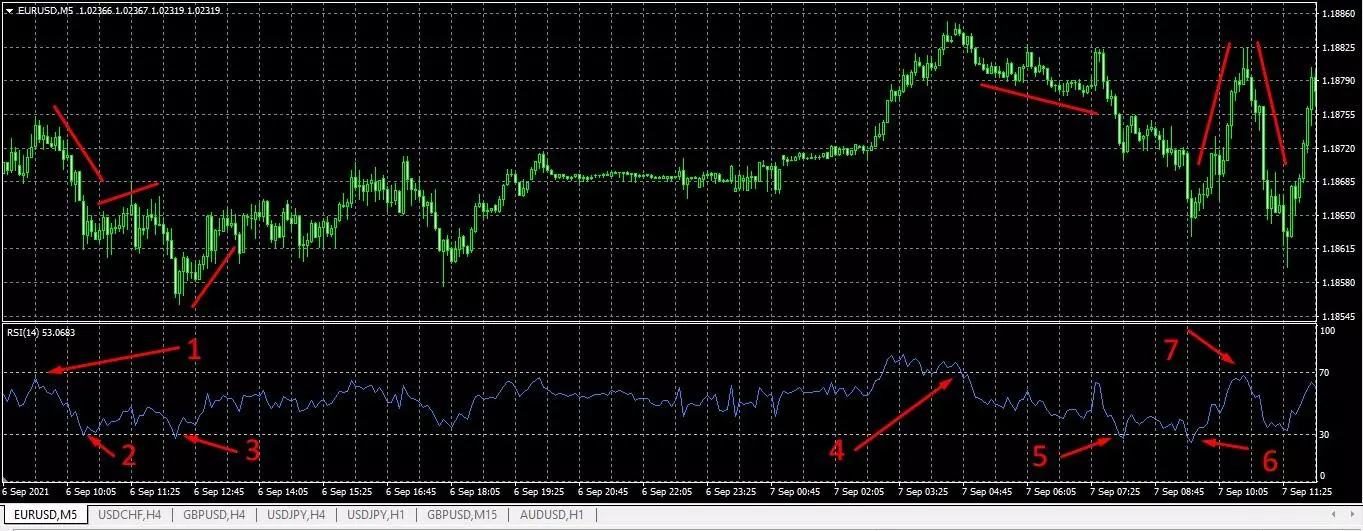
Example of using the RSI indicator
The chart covers a period that equals slightly over 1 days. Over this time, the indicator gave 7 signals, of which signal 5 was false. The other signals are more or less effective, although you have to consider the spread.
For example, the movement amplitude of signal 2 is about 4 pips, provided that the position is opened at the very bottom of the range and closed by the shadow. It is difficult to achieve such accuracy in the real market; Therefore, considering the spread, this signal can be called weak. The number of signals increases if the period is set to 10.
Timeframe M30.
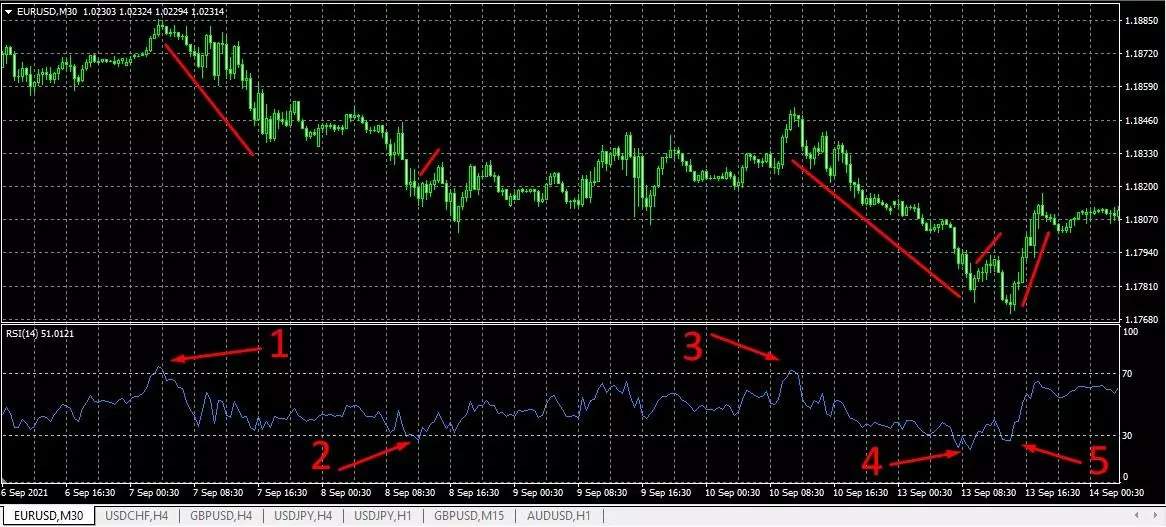
Example of using the RSI indicator
The chart covers a period that equals one week (September 7-14). The indicator gives 5 signals, two of which are so weak they can be considered false. Nonetheless, signals 1, 3 and 5 are rather strong. Signal 3 passes through the weekend. Although it goes beyond day trading and adds expenses for swap, the strong trend pays it off.
Timeframe H1.
Example of using the RSI indicator
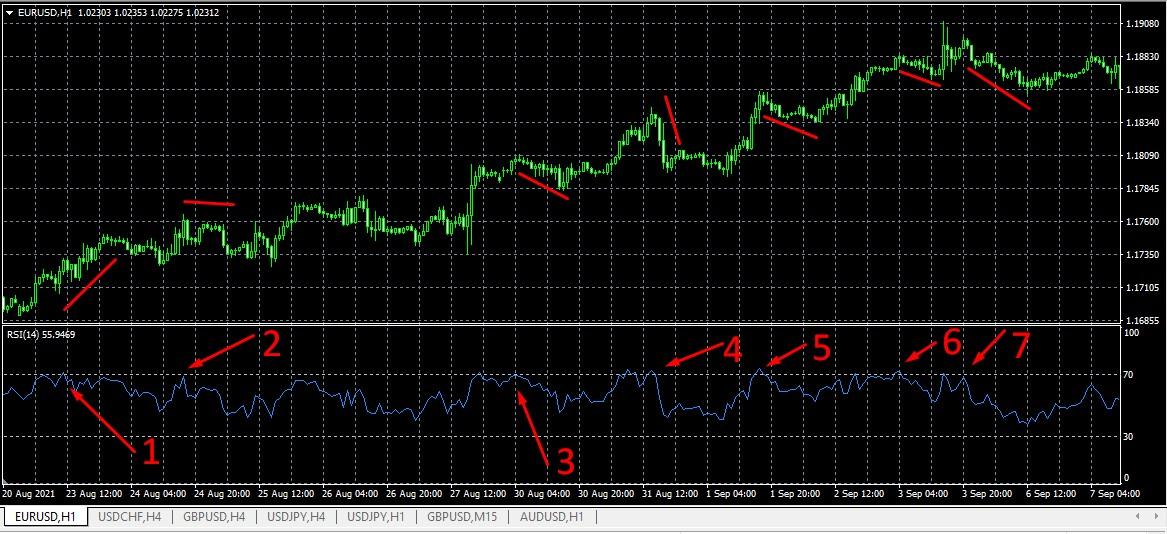
On the H1 interval chart, a period that equals to 2 weeks is shown. This section was selected specifically to show the readers that the RSI indicator performance is not always 65-70% and higher on standard settings on a large timeframe. The signals that can be used here are 4 and 7. However, they are not strong enough to speak about a trend movement.
Such situations are rare. On average, RSI gives at least 50% positive signals on a H1 timeframe with a period of 14, with 7-10% of them indicating a start of a strong trend. However, unprofitable sections can bring the effectiveness of a strategy to zero. This is another example why testing of at least 300 transactions on the section and analysis of the back test by all key parameters are so important.
Comparison of RSI (30;70) and RSI (20;80) signals with a period of 14 on H1 timeframe
RSI levels visually limit the indicator’s overbought and oversold zones. Practice shows that the indicator rarely touches the values of 20 and 80; therefore, narrowing the key zones sharply reduces the number of signals. You can see how accurate they are on the H1 chart for the EUR/USD currency pair.
Example of using the RSI indicator:
Example of using the RSI indicator
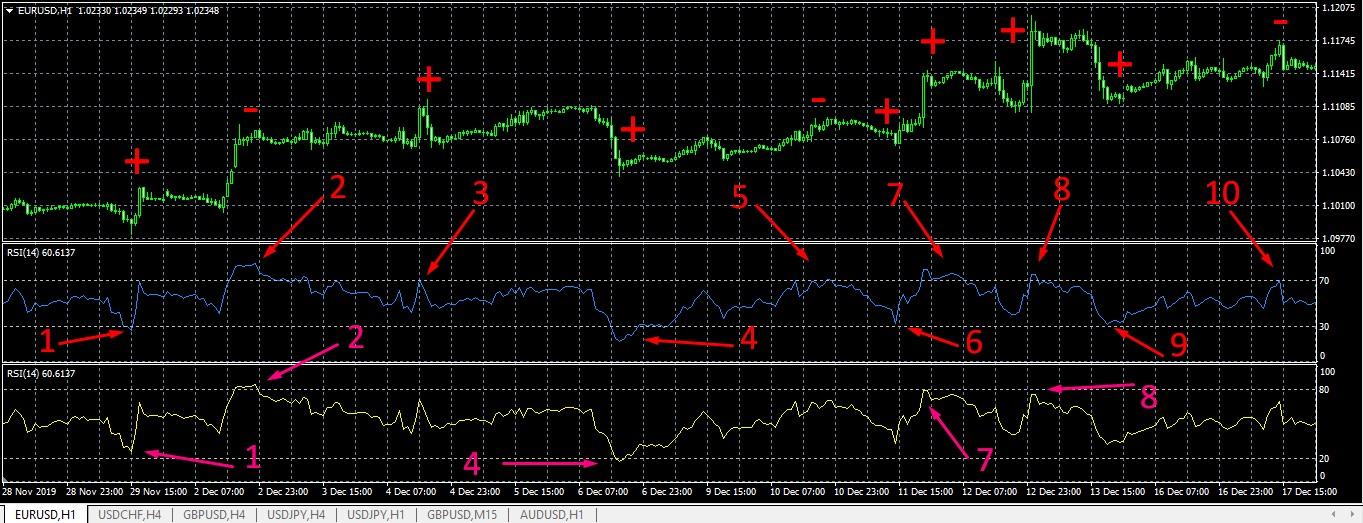
The top RSI with the blue line is an indicator with 30/70 levels, the bottom RSI with the yellow line – 20/80. On the section from November 28 until December 17, the oscillator with 30/70 levels gave 10 signals of various degree of effectiveness:
Three signals are fully unprofitable: signals 2, 5 and 10. Despite touching the key level and exiting the overbought zone down, the price did not go down.
Seven signals are profitable, but only part of them helped catch a strong movement. For example, signal 1 has a very short movement, and signals 4, 7 and 9 are not only weak, but lengthy, which means additional expenses for swap.
Therefore, only signals 3, 6 and 8 of the RSI 30/70 indicator would have been effective for day trading. Also, signal 1 can be considered profitable to an extent.
RSI 20/80 gave 5 signals that touched key levels. Signal 2 was unprofitable.
Reducing the range of the key zones led to halving of the number of signals. This helped improve the performance of the trading strategy: 20% unprofitable signals compared to 30% at 30/70 levels. On the other hand, this discarded the strong signals 3 and 6 of the short-term trend, but gave an opportunity to use the strong signals 1 and 8.
Conclusion. Reducing the range of the key zones is justified for conservative day strategies. It reduces the risks of unprofitable transactions, but at the same time ‘cuts’ profitable trades that could have paid off. Therefore, using the 30/70 levels with the addition of filters that filter out unprofitable signals and help assess the strength of the trend would be more justified.
Avoid Over Optimization RSI Settings
As a day trader, it can be tempting to spend hours tweaking the RSI parameters like the periods, overbought level, and oversold level to perfectly fit the historical price data you're analyzing. You may think this will improve performance, but it often leads to disappointment. This is called over optimizing or overfitting the indicator.
The problem is that historical performance often does not predict future results very well. So all your painstaking optimizations based on past data may fail going forward. It's better to stick with the standard RSI settings as a starting point. Many traders use 14 periods with overbought and oversold levels at 70 and 30 respectively.
Only make small adjustments if these standard parameters don't suit the specific security you're trading. For example, a very volatile asset may perform better with a shorter RSI period like 9. But don't go changing the levels to 75 and 20 just because it improved past results. Often the standard settings will serve you well. RSI works best in combination with other indicators anyway.
So avoid the temptation to over optimize your RSI. Tweak the settings sparingly, focus on confirmations with other signals, and you'll avoid the pitfalls of basing trades on historically optimized parameters. RSI is powerful, but only when used wisely.
Summary
RSI is a useful instrument in the hands of a professional. With the settings that are suitable for the asset and market sentiment, and using filters, it can provide 75-80% of good signals. We have discussed in detail the best settings for the indicator and how to use RSI in this review. If you’ve ready it, launch a strategy tester and try to develop strategies by selecting settings. Believe in yourself and luck will be on your side!
FAQs
What is the most accurate RSI setting?
There is no single "most accurate" RSI setting as it can vary depending on the security being analyzed, the time frame being used, and the trader's individual strategy and preferences. Generally, the default RSI setting of 14 is widely used and can be a good starting point for analysis.
What is the best RSI settings for 5 min chart?
The best RSI settings for a 5-minute chart can depend on the trader's individual strategy and preferences. Some traders may find that a shorter period RSI, such as 5 or 7, provides more responsive signals for the fast-moving 5-minute chart.
Which indicator is the best for scalping?
The best indicator for scalping can depend on the trader's individual strategy and preferences. Some commonly used indicators for scalping include moving averages, Bollinger Bands, and the Relative Strength Index (RSI).
How effective is the RSI indicator in day trading?
No indicator gives 100% accurate signals. However, RSI is considered only of the most clear and logical oscillators that accurately confirm a trend. Therefore, we recommend that you consider using RSI in your trading strategy.
What are the best settings of the RSI indicator?
There are no ideal settings. The indicator parameters are selected by trial and error through testing of quotes on various historical periods of various trading assets. Adjustment of the RSI settings can increase the number of signals, but also the risk level. This is why the settings also largely depend on the type of strategy you prefer: conservative or aggressive.
What indicators does RSI combine with?
RSI is often used with trend indicators. However, there are strategies built exclusively on oscillators, where each oscillator is a mutual filter for each other. Also, you can use several RSI indicators with different settings in one strategy.
In what strategies is RSI most effective?
It depends on your ability to set it up and find accurate signals. RSI can be equally effective in scalping, day trading and long-term strategies.
Glossary for novice traders
-
1
Broker
A broker is a legal entity or individual that performs as an intermediary when making trades in the financial markets. Private investors cannot trade without a broker, since only brokers can execute trades on the exchanges.
-
2
Trading
Trading involves the act of buying and selling financial assets like stocks, currencies, or commodities with the intention of profiting from market price fluctuations. Traders employ various strategies, analysis techniques, and risk management practices to make informed decisions and optimize their chances of success in the financial markets.
-
3
Day trading
Day trading involves buying and selling financial assets within the same trading day, with the goal of profiting from short-term price fluctuations, and positions are typically not held overnight.
-
4
Scalping
Scalping in trading is a strategy where traders aim to make quick, small profits by executing numerous short-term trades within seconds or minutes, capitalizing on minor price fluctuations.
-
5
Volatility
Volatility refers to the degree of variation or fluctuation in the price or value of a financial asset, such as stocks, bonds, or cryptocurrencies, over a period of time. Higher volatility indicates that an asset's price is experiencing more significant and rapid price swings, while lower volatility suggests relatively stable and gradual price movements.
Related Articles


Team that worked on the article

Oleg Tkachenko is an economic analyst and risk manager having more than 14 years of experience in working with systemically important banks, investment companies, and analytical platforms. He has been a Traders Union analyst since 2018. His primary specialties are analysis and prediction of price tendencies in the Forex, stock, commodity, and cryptocurrency markets, as well as the development of trading strategies and individual risk management systems. He also analyzes nonstandard investing markets and studies trading psychology.

Dr. BJ Johnson is a PhD in English Language and an editor with over 15 years of experience. He earned his degree in English Language in the U.S and the UK. In 2020, Dr. Johnson joined the Traders Union team. Since then, he has created over 100 exclusive articles and edited over 300 articles of other authors.

Mirjan Hipolito is a journalist and news editor at Traders Union. She is an expert crypto writer with five years of experience in the financial markets. Her specialties are daily market news, price predictions, and Initial Coin Offerings (ICO).