How to Measure Volatility In Forex
The best tools to measure volatility in Forex:
-
ATR is the best technical analysis indicator for intraday strategies
-
Standard deviation is the best indicator in moving average strategies
-
The volatility calculator is the best tool for analyzing the long-term volatility of currency pairs
-
Other useful tools: Bollinger Bands, Keltner Channel, Donchian Channel
Volatility is one of the most important metrics used in financial analysis. It measures the variability of the price of an asset or portfolio of assets over a period of time. Volatility can be driven by a variety of factors, such as economic conditions, political events, company news, and so on.
Knowing volatility is essential for making effective investment decisions. Investors use volatility to assess the risk and return of investments. The higher the volatility, the higher the risk, but also the potential return.
What is volatility in Forex?
Volatility in Forex is the degree of variability of the price of a currency pair over a period of time. It is measured in percentage terms and is calculated as the mean squared deviation of the pair's price from its mean value.
Volatility can be caused by various factors, such as:
-
Economic events, such as changes in interest rates or the release of macroeconomic data
-
Political events, such as elections or wars
-
Corporate news, such as the release of financial results or the announcement of deals
Volatility is an important factor to consider when trading Forex. It affects the risk and profitability of trades.
High volatility means that currency pair prices can change quickly and sharply. This can lead to large profits, but also to large losses.
Low volatility means that currency pair prices change slowly and smoothly. This means that profits from trades will be smaller, but risks will be lower.
Best Forex brokers


Tools to analyze volatility in Forex
There are many tools available for measuring volatility. The choice of a specific tool depends on the purpose of the analysis and the type of asset.
Statistical Measures
The simplest tools for measuring volatility are statistical measures. These include:
-
Variance is the mean squared deviation of the asset price from its mean value. The higher the variance, the higher the volatility
-
Standard deviation is the square root of the variance. Standard deviation is a more common measure of volatility than variance
-
Interquartile range is the difference between the third and first quartiles of the asset price distribution. The interquartile range is a measure of volatility that is not dependent on the shape of the asset price distribution
Technical Indicators
Technical indicators are tools that are used to analyze historical data on the price of an asset in order to forecast future prices. Technical indicators that can be used to measure volatility include:
-
Speed indicators are indicators that measure the rate of change of the asset price. High values of speed indicators indicate high volatility
-
Direction indicators are indicators that measure the direction of movement of the asset price. High values of direction indicators indicate high volatility
-
Volume indicators are indicators that measure the trading volume of the asset. High values of volume indicators indicate high volatility
Spectral Methods
Spectral methods are tools that are used to analyze the frequency spectrum of the asset price. The frequency spectrum is the distribution of the asset price by frequency components. High values of the frequency spectrum at low frequencies indicate high volatility.
Adaptive Methods
Adaptive methods are tools that automatically adapt to changing market conditions.
Adaptive methods that can be used to measure volatility include:
-
Adaptive volatility indexes are indicators that measure volatility using an adaptive approach
-
Volatility histogram is a tool that represents volatility as a histogram
Examples of the most popular tools for measuring volatility in Forex
When choosing a tool for measuring volatility, the following factors should be considered:
-
Purpose of analysis - it is important to determine for what purposes the tool will be used
-
Type of asset - some tools are better suited for certain types of assets than others
-
Data availability - some tools require large amounts of historical data
ATR (Average True Range)
ATR is a tool that measures the average true range of prices over a specified period of time. The true range of prices is the difference between the highest and lowest prices over a period of time. ATR can be used to assess the volatility of asset prices. The higher the ATR, the higher the volatility.
ATR can be used for various purposes, such as:
-
Risk assessment of trades
-
Forecasting future prices
-
Risk management strategy development
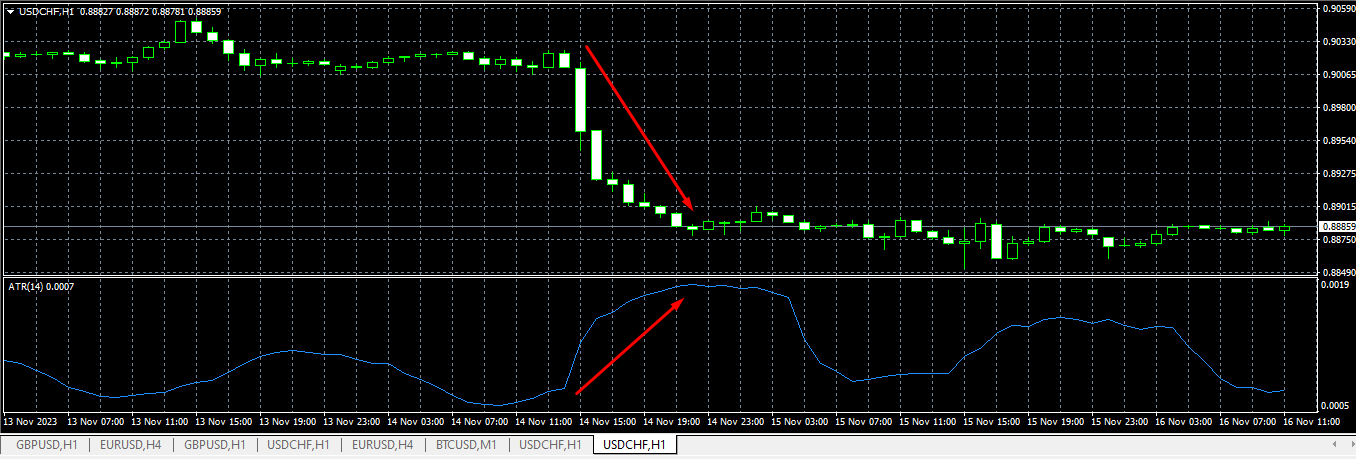
ATR tool
Standard deviation (SD)
Standard deviation (SD) is a statistical measure that is used to measure the spread of values in a data set. It is calculated as the square root of the variance. Variance is a measure of how much the values in a data set deviate from the mean value. It is calculated as the mean squared deviation of the values from the mean value.
Standard deviation can be used to assess the volatility of asset prices. The higher the standard deviation, the higher the volatility.
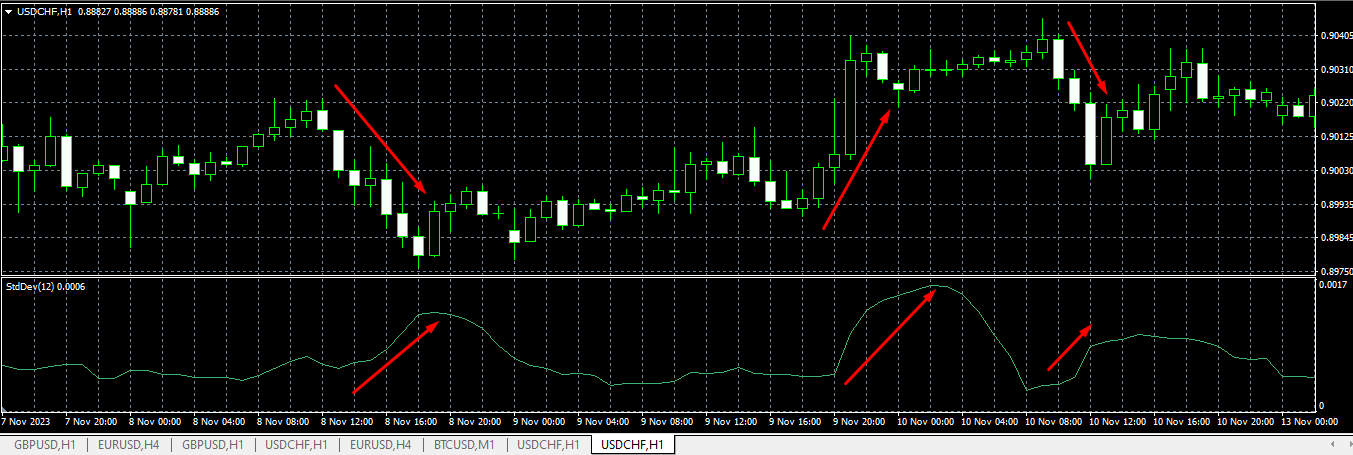
Standard deviation tool
Volatility Calculator
A volatility calculator is a tool that can be used to calculate the volatility of asset prices. Volatility calculators are typically based on statistical methods, such as standard deviation or interquartile range. Volatility calculators can be useful for traders and investors who want to quickly assess the volatility of asset prices.
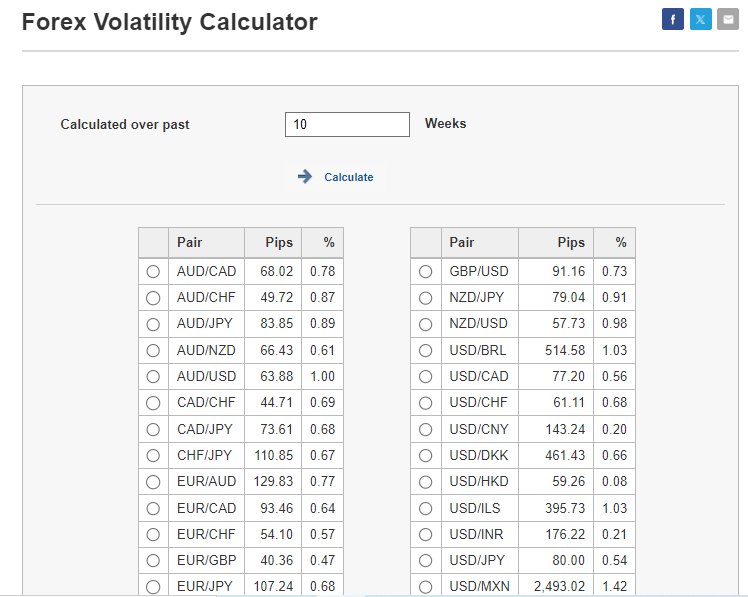
Volatility calculator tool
Application of Volatility Measurement Tools
Volatility measurement tools can be used for a variety of purposes, such as:
-
Investment risk assessment - volatility is one of the most important factors to consider when assessing investment risk
-
Future price forecasting - volatility can be used to forecast future asset prices
-
Risk management strategy - volatility can be used to develop risk management strategies
A trader who is long EUR/USD and expects the pair to rise is more likely to profit if volatility is high. This is because the pair is more likely to make big moves in the desired direction. But if the price moves in the opposite direction, the trader will quickly make a loss in high volatility conditions.
A trader who is using a stop-loss order to protect their profits will need to consider volatility when setting the size of the stop-loss. If volatility is high, the trader will need to set a larger stop-loss to ensure that their profits are not wiped out by a sudden move in the opposite direction.
Conclusion
Volatility measurement tools are important tools that are used in financial analysis. They can be used to assess investment risk, forecast future prices, and develop risk management strategies.
In addition to the tools mentioned above, there are a number of other volatility measurement tools available. Some of these tools are more complex than others and may require more advanced knowledge of financial analysis.
It is important to choose the right tool for the specific purpose of the analysis. If you are unsure which tool to use, it is always best to consult with a financial advisor.
FAQs
What are the tools to measure volatility?
There are many tools that can be used to measure volatility, including:
-
Standard deviation
-
Average true range (ATR)
-
Bollinger Bands
-
Keltner Channel
-
Donchian Channel
-
Chaikin Volatility Indicator
-
Twiggs Volatility Indicator
-
Relative Volatility Index (RVI)
What is the best forex indicator for volatility?
There is no single "best" forex indicator for volatility, as the best indicator will vary depending on your individual trading style and preferences. However, some of the most popular indicators for measuring volatility include ATR, Bollinger Bands, and Keltner Channel.
How do you assess currency volatility?
There are several factors that can affect currency volatility, including:
-
Economic news and events
-
Political instability
-
Interest rate differentials
-
Natural disasters
To assess currency volatility, you can track these factors and use volatility measurement tools to measure the current level of volatility.
What is the best way to measure volatility?
The best way to measure volatility depends on your individual needs and goals. However, some of the most common methods include:
-
Using standard deviation to measure the spread of asset prices
-
Using ATR to measure the average true range of prices over a specified period of time
-
Using Bollinger Bands to visualize the volatility of prices over time
Glossary for novice traders
-
1
Broker
A broker is a legal entity or individual that performs as an intermediary when making trades in the financial markets. Private investors cannot trade without a broker, since only brokers can execute trades on the exchanges.
-
2
Volatility
Volatility refers to the degree of variation or fluctuation in the price or value of a financial asset, such as stocks, bonds, or cryptocurrencies, over a period of time. Higher volatility indicates that an asset's price is experiencing more significant and rapid price swings, while lower volatility suggests relatively stable and gradual price movements.
-
3
Deviation
The deviation is a statistical measure of how much a set of data varies from the mean or average value. In forex trading, this measure is often calculated using standard deviation that helps traders in assessing the degree of variability or volatility in currency price movements.
-
4
Trading
Trading involves the act of buying and selling financial assets like stocks, currencies, or commodities with the intention of profiting from market price fluctuations. Traders employ various strategies, analysis techniques, and risk management practices to make informed decisions and optimize their chances of success in the financial markets.
-
5
Index
Index in trading is the measure of the performance of a group of stocks, which can include the assets and securities in it.
Related Articles


Team that worked on the article

Alex Smith is a professional day trader for a proprietary trading firm within the foreign exchange (forex) and crypto markets. His area of expertise is day trading and swing trading within the 15min-4hr time frames for both the London and NY open.

Dr. BJ Johnson is a PhD in English Language and an editor with over 15 years of experience. He earned his degree in English Language in the U.S and the UK. In 2020, Dr. Johnson joined the Traders Union team. Since then, he has created over 100 exclusive articles and edited over 300 articles of other authors.

Mirjan Hipolito is a journalist and news editor at Traders Union. She is an expert crypto writer with five years of experience in the financial markets. Her specialties are daily market news, price predictions, and Initial Coin Offerings (ICO).