What Is Naked Trading? Price Action Strategies For Forex & Options


Editorial Note: While we adhere to strict Editorial Integrity, this post may contain references to products from our partners. Here's an explanation for How We Make Money. None of the data and information on this webpage constitutes investment advice according to our Disclaimer.
Traders often fall into the trap of hindsight bias, selecting only the best-performing backtests instead of developing strategies that work across a range of symbols. A high return on a single asset - such as a 503% gain on the Singapore Straits Index - may seem impressive but typically fails under real market conditions. True trading success depends on portfolio-level consistency, not isolated wins. Profitable strategies prioritize robustness, symbol diversity, and stable performance across different market environments, rather than curve-fitted results.
Many traders fall into a common trap: mistaking a strong backtest for a reliable strategy. It’s easy to get excited by high historical returns on a single symbol, but that excitement often masks a deeper flaw - hindsight bias. Instead of focusing on how a strategy performs across a range of instruments, traders tend to cherry-pick standout results and ignore the broader picture.
This article explores why such an approach leads to failure in live markets, and what it truly means to build a strategy that’s robust, consistent, and ready for real-world conditions. If you're serious about long-term success, it's time to stop chasing perfect backtests - and start thinking in portfolios.
Why your backtested strategy will fail
In over 25 years of professional trading and allocating capital to traders, I’ve found that most traders-both novice and experienced-believe they’ve discovered a backtested strategy that not only makes money but will continue to generate profits for themselves and their potential clients. To their surprise, however, this strategy does not often produce the expected results when trading real money.
There are many reasons why this can happen but in today’s article I am going to focus on one reason that so many people seem to miss. I assume all readers are familiar with the term backtest.
Firstly, most software packages until recently did not offer portfolio or multi-symbol backtests. So, traders typically are accustomed to working with a strategy on a single symbol. Some might then apply that strategy to several different symbols, which leads to the mistake.
Secondly, the tendency is for traders who want to design a strategy that works for the EUR/USD to adapt the parameters of a strategy for that symbol until. So, if for example the strategy is a moving average crossover strategy 50-day simple moving average cross over/under 200-day simple moving average, and it doesn’t work. Often the trader will optimise a moving average parameter set that does work say 40-day over/under 230-day for example. We are not going to discuss that today, as that is what is typically known as curve-fitting.
What most financial gurus or textbooks don’t focus enough on is building strategies that are robust to multiple symbols. In other words, a portfolio.
In our example, we are going to focus on a famous moving average cross system.
The strategy: A classic moving average system
Let's examine a famous long-term trend strategy:
Entry long: when the 50-day simple moving average crosses above the 200-day simple moving average (the "golden cross").
Entry short: when the 50-day simple moving average crosses below the 200-day simple moving average (the "death cross").
For this example, we're using basic entry/exit signals without complex money management rules. Here is an example of the strategy on one symbol, the Singapore Straits Index.
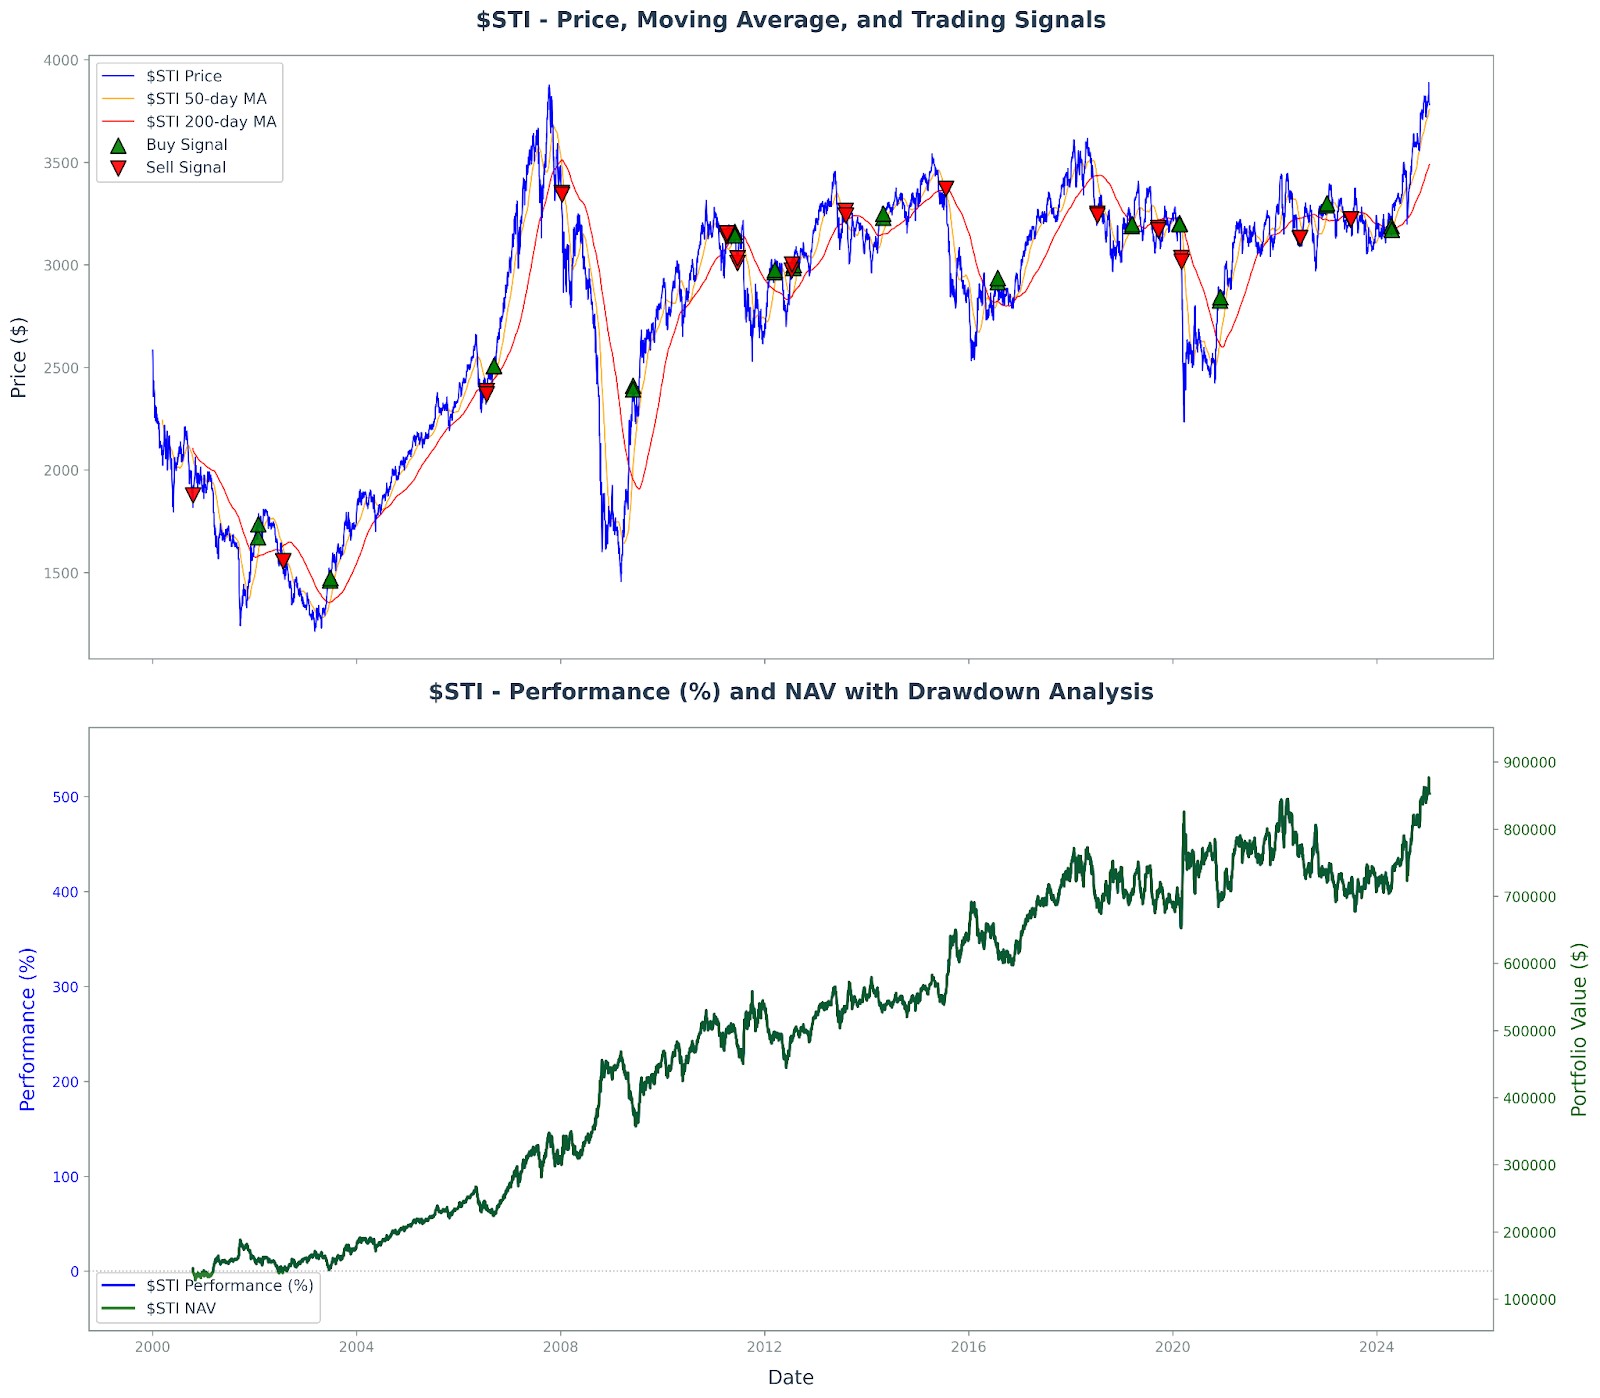
Let us take a look at the full results and then I will describe how one should go about building a robust strategy with as little hindsight bias as possible.
Where most traders go wrong
This is how most people will deal with the backtests performed on a bunch of different symbols. In the case I am sharing I have tested the moving average crossover system (50/200) on 7 World Stock Indices. You can see the results of the different individual backtests varied dramatically.
The best one being $STI: the Singapore Straits Index over the last 25 years with a 503% total return.
| Symbol | Portfolio Contribution | Total Return | Max Drawdown | Sharpe | Win Rate | Trades |
|---|---|---|---|---|---|---|
| $SPX | 42.4% | 293.8% | -45.9% | 0.44 | 47.8% | 23 |
| $FT100 | 3.3% | 32.1% | -55.6% | 0.15 | 44.1% | 34 |
| $DAX | 20.1% | 169.2% | -56.3% | 0.34 | 57.7% | 26 |
| $CAC | -0.0% | 48.1% | -68.7% | 0.19 | 46.9% | 32 |
| $N225 | 1.3% | 103.9% | -44.4% | 0.24 | 36.8% | 38 |
| $HS | -8.2% | -19.0% | -72.8% | 0.04 | 30.3% | 33 |
| $STI | 51.5% | 503.1% | -26.7% | 0.73 | 60.7% | 28 |
The critical mistake: when traders see that the Singapore Straits Index ($STI) generated a 503% total return over 25 years-the best performer-they discard all other symbols and focus exclusively on $STI. I see this pattern repeatedly across the industry.
The portfolio reality check
Very few traders examine the
combined portfolio return
of all seven symbols. Yet, this is the true picture. It is either through innocent lack of knowledge or deliberate deception that we ignore the more robust approach, probably because it doesn’t tell us what we want and taking short cuts might trick us into believing picking the best performer will continue to outperform in the future.
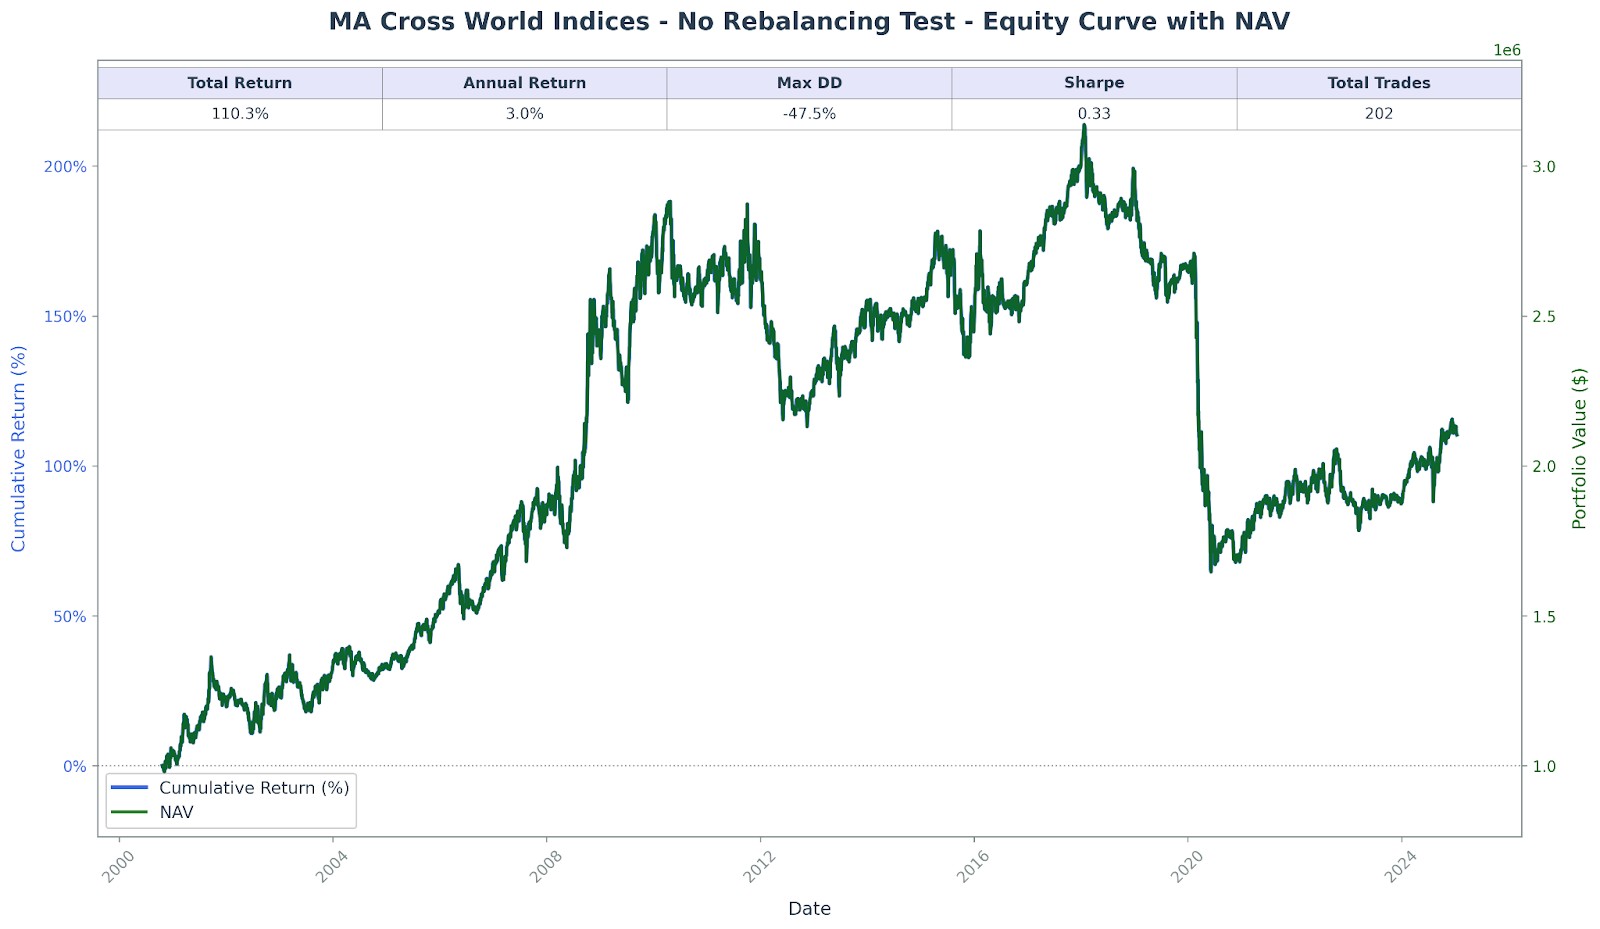
The portfolio return tells a sobering story: an average annual return of just 3%, be careful not to fall for the headline total return of 110% as this is over 25 years. It is good to see the portfolio performance relative to a benchmark buy and hold strategy, as this shows you the kind of return you could have got being totally passive and simply buying an index. I have used the S&P Global 100 as the benchmark, which comprises 100 large cap multinational companies.
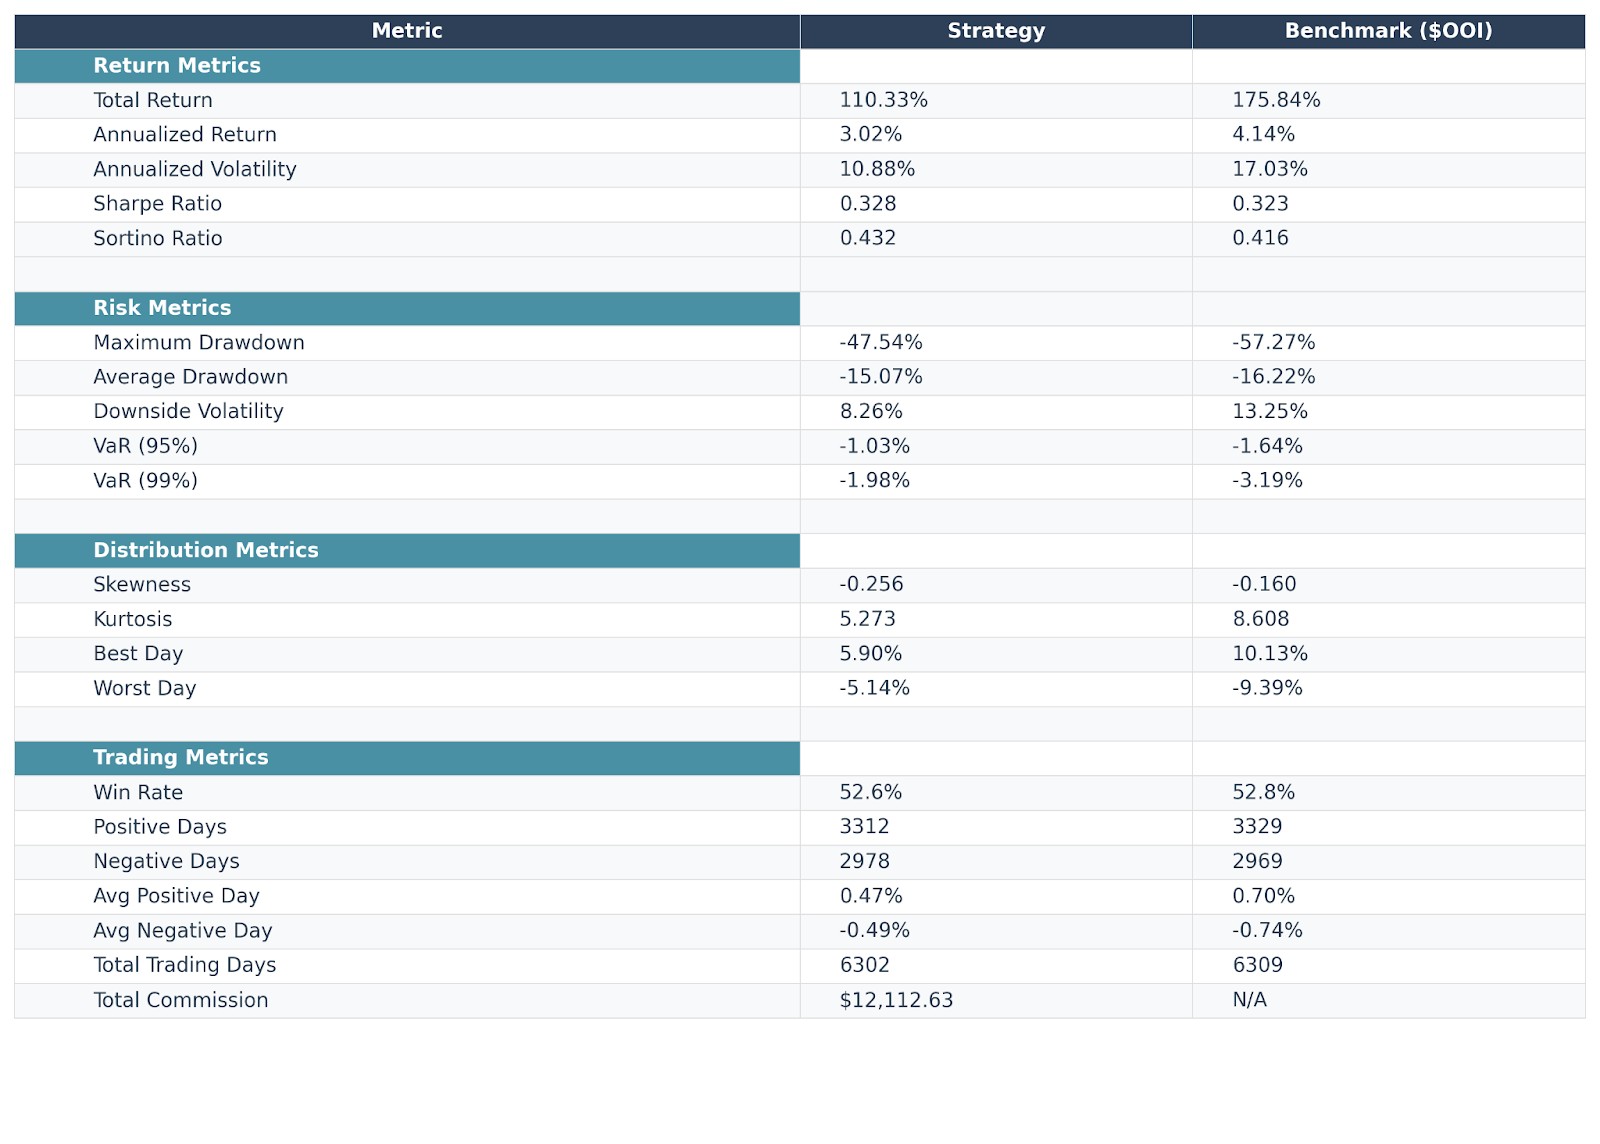
The benchmark not only outperforms the strategy on total return but also delivers ever so slightly better risk-adjusted returns.
Professional system developers prioritize robustness over cherry-picked performance. The principle is simple: a viable strategy performs consistently across a broad range of symbols, not just one exceptional case.
While applying a strategy to a single symbol might make sense if you're exploiting a specific market inefficiency, the most robust strategies capitalize on universal concepts-like momentum-applied across multiple symbols.
The key insight: We can never predict which specific symbol will outperform, so the optimal approach is applying a robust strategy across multiple symbols and achieving consistent portfolio-level profits.
Finding a strategy that produces favorable backtest results across a broad array of symbols is significantly more challenging than backtesting multiple symbols and cherry-picking the winners. However, strategies that perform well as a portfolio across multiple symbols tend to maintain that performance when deployed with real money-unlike strategies based on cherry-picked individual backtest results.
The path forward
Rather than chasing individual backtest winners, accept the reality of lower-performing but more robust portfolio results. Focus your energy on enhancing portfolio returns by:
Maintaining symbol diversity: stick with your full symbol universe.
Improving entry/exit strategies: refine your signals while maintaining robustness.
Implementing better money management: develop rules that work across the entire portfolio.
Targeting consistency: aim for future performance that closely matches historical results.
The goal isn't finding the perfect individual backtest-it's building a strategy where past performance genuinely predicts future results.
The biggest obstacle to trading success isn’t the market - it’s our own biases

I can confidently say that the biggest enemy of trading success isn't market volatility or lack of capital - it's our own cognitive biases. The temptation to cherry-pick winning backtests is overwhelming, especially when facing clients or personal financial pressure. However, I've learned that embracing lower but more consistent portfolio returns is the path to long-term profitability.
The most successful traders I've worked with understand that sustainable profits come from robust systems applied consistently across diversified portfolios. They resist the siren call of spectacular individual results and instead focus on building strategies that work across multiple market conditions and instruments. This approach requires patience and discipline, but it's the only path to trading success that doesn't rely on luck.
My recommendation? Start viewing every backtest as part of a portfolio story, not an individual performance tale. Your future self will thank you for this perspective shift.
Conclusion
The difference between successful and failed trading strategies often comes down to one crucial factor: robustness over optimization. While it's tempting to focus on the best individual backtest results, professional traders know that sustainable profits come from strategies that work consistently across multiple symbols. By embracing portfolio-level thinking and resisting the urge to cherry-pick winners, you'll build trading strategies that actually perform in live markets, not just in backtests. Isn’t that what counts in the end?
FAQs
Why do many backtested strategies fail in live trading?
The common reason is hindsight bias-traders cherry-pick the best-performing individual results instead of evaluating strategies based on portfolio performance across multiple symbols.
What's the difference between curve-fitting and cherry-picking in backtesting?
Curve-fitting involves optimizing parameters for a single symbol until it shows profits, while cherry-picking involves testing multiple symbols and selecting only the best performers while ignoring the rest.
How many symbols should I include in a robust backtest?
While there's no magic number, professional traders typically test strategies across at least 10–20 symbols in the same asset class to ensure robustness and reduce the impact of outliers.
Is it ever acceptable to trade a strategy on just one symbol?
Yes, but only when you're exploiting a specific market inefficiency unique to that symbol. For most trend-following and momentum strategies, portfolio diversification is essential.
How do I know if my strategy is robust enough for live trading?
A robust strategy should show consistent positive returns across most symbols in your test universe, with the portfolio return being the primary evaluation metric rather than individual symbol performance.
Related Articles
Team that worked on the article
Michael has decades of experience as a professional trader, hedge fund manager and incubator of emerging traders. He has built a number of trading analytic platforms with 3 successful exits and has served as the CEO of a regulated CFD broker and as a director of a public company in his late 20’s. He has also co-founded a high frequency market making business and acted as its risk manager before selling the business to a large digital asset company.
Successful trading is a blend of discipline, analytics, and self-awareness. Real breakthroughs happen when you don’t just follow a strategy — you understand why it works and where it might fail.
Michael is an out the box thinker with a wide area of interests spanning economics, finance, technical and fundamental analysis, quantitative and behavioral finance, blockchain and cryptocurrency, philosophy, psychology, religion, and technology. Michael currently runs a trading and investment consultancy Signal2Noise.
Chinmay Soni is a financial analyst with more than 5 years of experience in working with stocks, Forex, derivatives, and other assets. As a founder of a boutique research firm and an active researcher, he covers various industries and fields, providing insights backed by statistical data. He is also an educator in the field of finance and technology.
As an author for Traders Union, he contributes his deep analytical insights on various topics, taking into account various aspects.
Mirjan Hipolito is a journalist and news editor at Traders Union. She is an expert crypto writer with five years of experience in the financial markets. Her specialties are daily market news, price predictions, and Initial Coin Offerings (ICO).
Cryptocurrency is a type of digital or virtual currency that relies on cryptography for security. Unlike traditional currencies issued by governments (fiat currencies), cryptocurrencies operate on decentralized networks, typically based on blockchain technology.
Diversification is an investment strategy that involves spreading investments across different asset classes, industries, and geographic regions to reduce overall risk.
Fundamental analysis is a method or tool that investors use that seeks to determine the intrinsic value of a security by examining economic and financial factors. It considers macroeconomic factors such as the state of the economy and industry conditions.
Volatility refers to the degree of variation or fluctuation in the price or value of a financial asset, such as stocks, bonds, or cryptocurrencies, over a period of time. Higher volatility indicates that an asset's price is experiencing more significant and rapid price swings, while lower volatility suggests relatively stable and gradual price movements.
CFD is a contract between an investor/trader and seller that demonstrates that the trader will need to pay the price difference between the current value of the asset and its value at the time of contract to the seller.


-
 Afghanistan
-
 Albania
-
 Algeria
-
 Argentina
-
 Armenia
-
 Australia
-
 Austria
-
 Azerbaijan
-
 Bahamas
-
 Bahrain
-
 Bangladesh
-
 Belgium
-
 Botswana
-
 Brazil
-
 Brunei
-
 Bulgaria
-
 Cambodia
-
 Cameroon
-
 Canada
-
 Chile
Chile
-
 China
China
-
 Colombia
-
 Costa Rica
-
 Cote d'Ivoire
-
 Croatia
-
 Cyprus
-
 Czechia
-
 Denmark
-
 Dominican Republic
-
 Ecuador
-
 Egypt
Egypt
-
 Estonia
-
 Eswatini
-
 Ethiopia
-
 Finland
-
 France
-
 Georgia
-
 Germany
-
 Ghana
Ghana
-
 Greece
-
 Haiti
Haiti
-
 Hong Kong
-
 Hungary
-
 India
India
-
 Indonesia
-
 Iran, Islamic republic
-
 Iraq
Iraq
-
 Ireland
-
 Israel
-
 Italy
Italy
-
 Jamaica
-
 Japan
Japan
-
 Jordan
-
 Kazakhstan
-
 Kenya
Kenya
-
 Korea
Korea
-
 Kuwait
-
 Kyrgyzstan
-
 Laos
Laos
-
 Latvia
-
 Lebanon
-
 Libya
Libya
-
 Lithuania
-
 Luxembourg
-
 Madagascar
-
 Malaysia
-
 Malta
Malta
-
 Mauritius
-
 Mexico
-
 Moldova
-
 Mongolia
-
 Montenegro
-
 Morocco
-
 Mozambique
-
 Myanmar
-
 Namibia
-
 Nepal
Nepal
-
 Netherlands
-
 Nigeria
-
 North Macedonia
-
 Norway
-
 Oman
Oman
-
 Pakistan
-
 Palestine
-
 Papua New Guinea
-
 Peru
Peru
-
 Philippines
-
 Poland
-
 Portugal
-
 Puerto Rico
-
 Qatar
Qatar
-
 Romania
-
 Rwanda
-
 Saudi Arabia
-
 Serbia
-
 Singapore
-
 Slovakia
-
 Slovenia
-
 Somalia
-
 South Africa
-
 Spain
Spain
-
 Sri Lanka
-
 Sweden
-
 Switzerland
-
 Syria
Syria
-
 Taiwan
-
 Tajikistan
-
 Tanzania
-
 Thailand
-
 Trinidad and Tobago
-
 Tunisia
-
 Turkey
-
 UAE
UAE
-
 Uganda
-
 Ukraine
-
 United Kingdom
-
United States
-
 Uzbekistan
-
 Venezuela
-
 Vietnam
-
 Yemen
Yemen
-
 Zambia
-
 Zimbabwe
- Forex
- Crypto
