How To Spot And Use Imbalance In Trading?


Editorial Note: While we adhere to strict Editorial Integrity, this post may contain references to products from our partners. Here's an explanation for How We Make Money. None of the data and information on this webpage constitutes investment advice according to our Disclaimer.
To spot and use imbalance in trading, traders can analyze tools like Order Book Imbalance, Volume Imbalance, and Fair Value Gap. These tools help identify situations where there's an excess of buy or sell orders, potentially leading to significant price movements.
Imagine a seesaw where only one side has people sitting on it. That's kind of what an imbalance is in trading. It happens when there are way more buy orders or sell orders for a stock, pushing the price in that direction. Volume traders, who focus on order activity, use these imbalances as clues. In this review, these experts from TU will share their best tips on how to spot these situations and potentially catch price movements before they happen.
What is the imbalance?
An imbalance in the stock market occurs when there's either too many buy or sell orders for a specific security on a trading exchange. This means there's an unequal match between what buyers want to buy and what sellers want to sell.
This situation happens when one side of trading, either buying or selling, is much stronger than the other. It has a big impact on the price of the security.
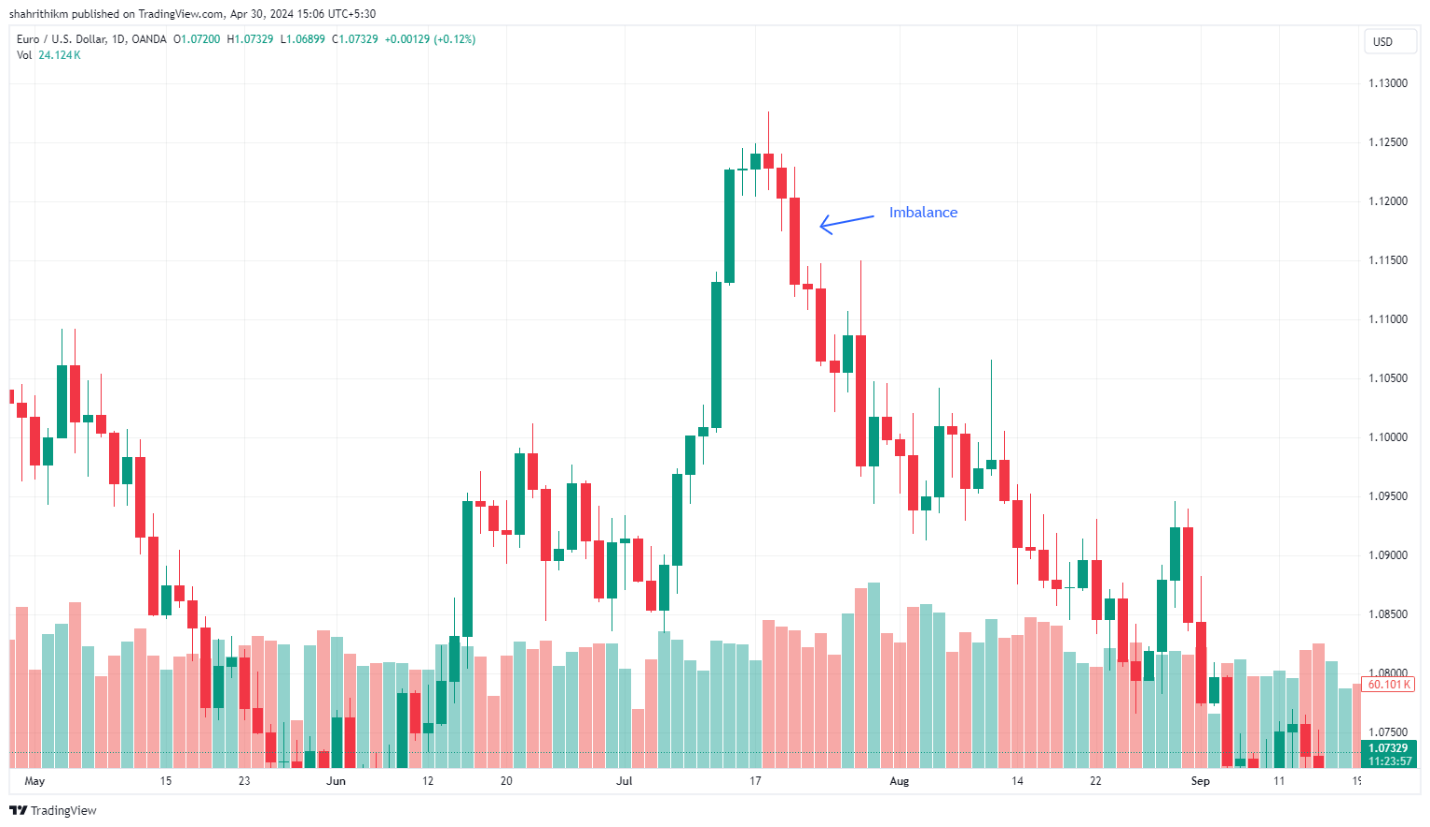
The presence of imbalances makes the price move. Moreover, any, even minimal, movement of quotes is a manifestation of imbalance. When at the current point of the price chart the number of buy or sell orders exceeds the number of counter orders and orders (and this is imbalance), they are executed at the expense of counter orders at the next levels. The price starts to shift.
This happens until the point of equilibrium (balance) is reached again, where supply and demand are equal.
 Imbalance definition Source: Phantom Trading
Top-3 Forex brokers


Why do market imbalances occur?
Order imbalances can happen because of different reasons such as:
Events affecting how investors feel about a stock
Changes in how the market works
Big investors making moves
For example, if there are a lot more buy orders compared to sell orders, it's called a buy-side order imbalance. On the other hand, if there are more sell orders than buys, it's a sell-side order imbalance.
These imbalances often occur when big news hits a stock, like when a company announces its earnings, changes its predictions, or merges with another company. They can make the price of securities go up or down, but usually, they settle down within a few minutes or hours of a trading day. Sometimes, with smaller and less traded stocks, imbalances can last longer because there aren't many shares being traded.
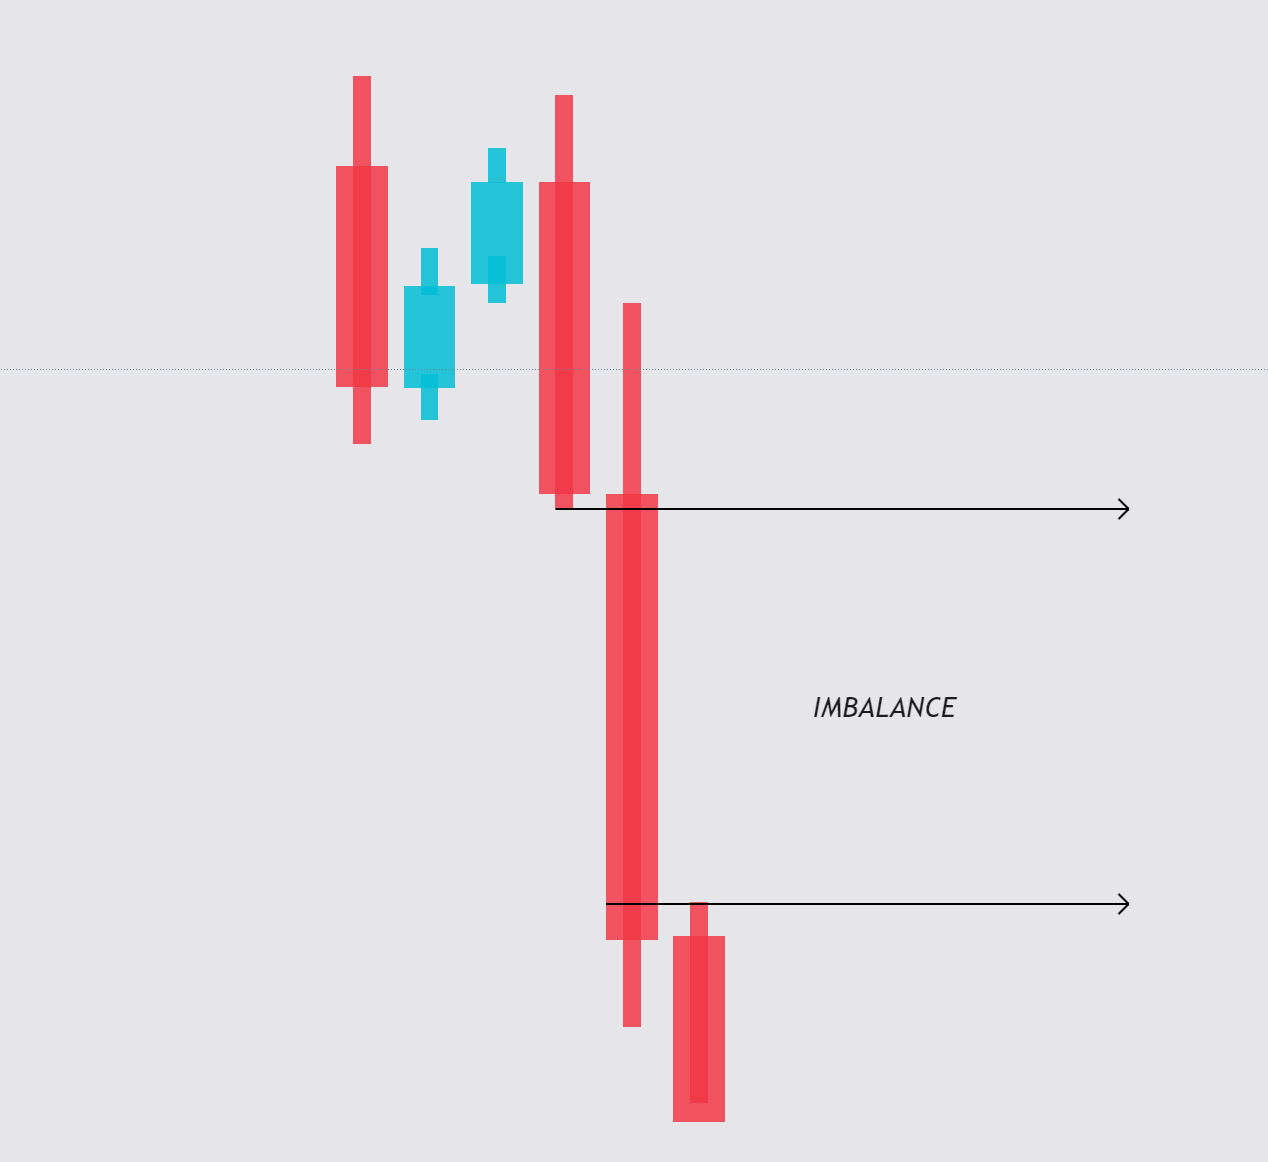
To spot an imbalance in the market, you can look at candles on a chart. If a candle has a solid body with no parts overlapped by the wicks of the previous or next candles, it shows an imbalance. This happens when there aren't many transactions happening between buyers and sellers. In the diagram, you can see how sellers were much stronger than buyers.
 How to spot an imbalance in the market
Usually, wicks on candles show that prices are moving up and down quickly, meaning the market is working efficiently. But when you see a candle with a solid body and no wicks overlapping it, it's a sign of a clear price imbalance.
Traders refer to this as the Smart Money Concept (SMC). It's a way of analyzing the market based on the actions of big players like banks, big investors, market makers, and people with insider information. When these big players make moves, they can cause prices to change quickly because their orders are so big. This often results in long candles on a chart with small wicks, showing a significant imbalance in price.
A large imbalance always causes a significant price movement and can be the starting point for the formation of trends. In fact, such a situation is a disturbance in the market and simply has to be countered.
Types of imbalance trading
To make sense of how traders use imbalances in trading, let's break down three main approaches:
Order imbalance analysis
This is about noticing when there's a big difference between the number of people wanting to buy and sell stocks. Traders believe that if there are a lot more people wanting to buy, prices will likely go up. Similarly, if there are more people wanting to sell, prices might go down.
Traders watch closely for these differences in buy and sell orders to figure out where prices might go next. For instance, if there's a sudden surge in buy orders, it could signal that prices will rise.
Imbalance continuation
Here, traders look for situations where a trend keeps going after there's been a big difference in buy and sell orders. For example, if there's a lot more demand to buy than to sell, it suggests that prices will probably keep going up.
Traders use tools to spot these imbalances that are likely to keep the current trend going. By sticking with the trend, they hope to ride the wave of buying or selling momentum to make profitable trades.
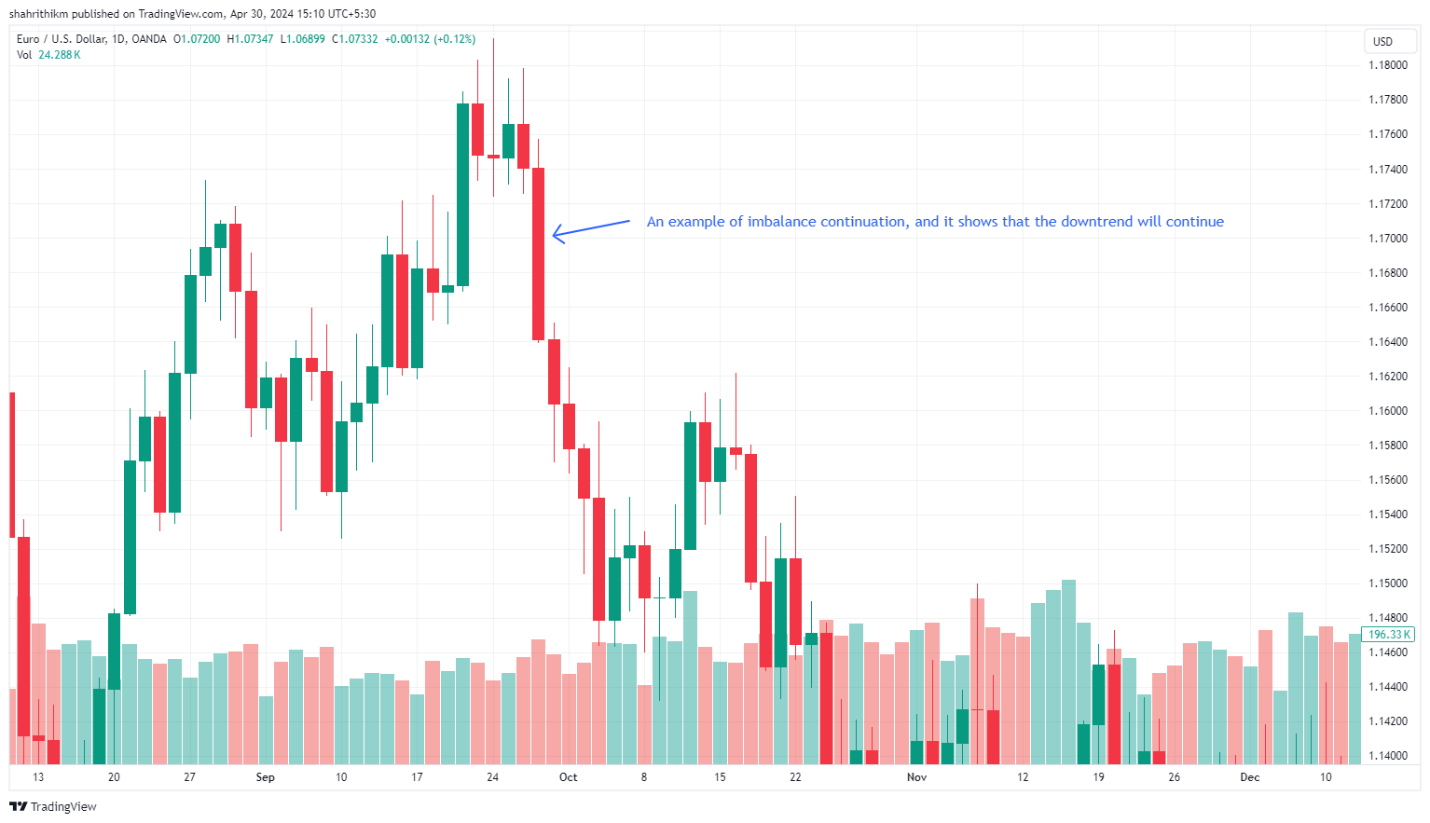 An example of imbalance continuation
Fading imbalances
This is when traders spot imbalances that are likely to change the current trend. If there are way more sellers than buyers, for instance, traders might think the trend will soon reverse and start going up instead.
Traders employing this strategy bet against the prevailing imbalance, expecting the market to eventually balance out. They aim to profit from the eventual correction in prices, anticipating a shift in sentiment from sellers to buyers.
How to identify imbalances on a chart?
To spot an imbalance in the market, simply look at the candles on a chart. Find a candle with a solid body, then check if any part of it isn't covered by the wicks of the candles before and after it. This suggests an imbalance because there weren't many trades happening between buyers and sellers. In the diagram, you can see how buyers were much stronger than sellers.
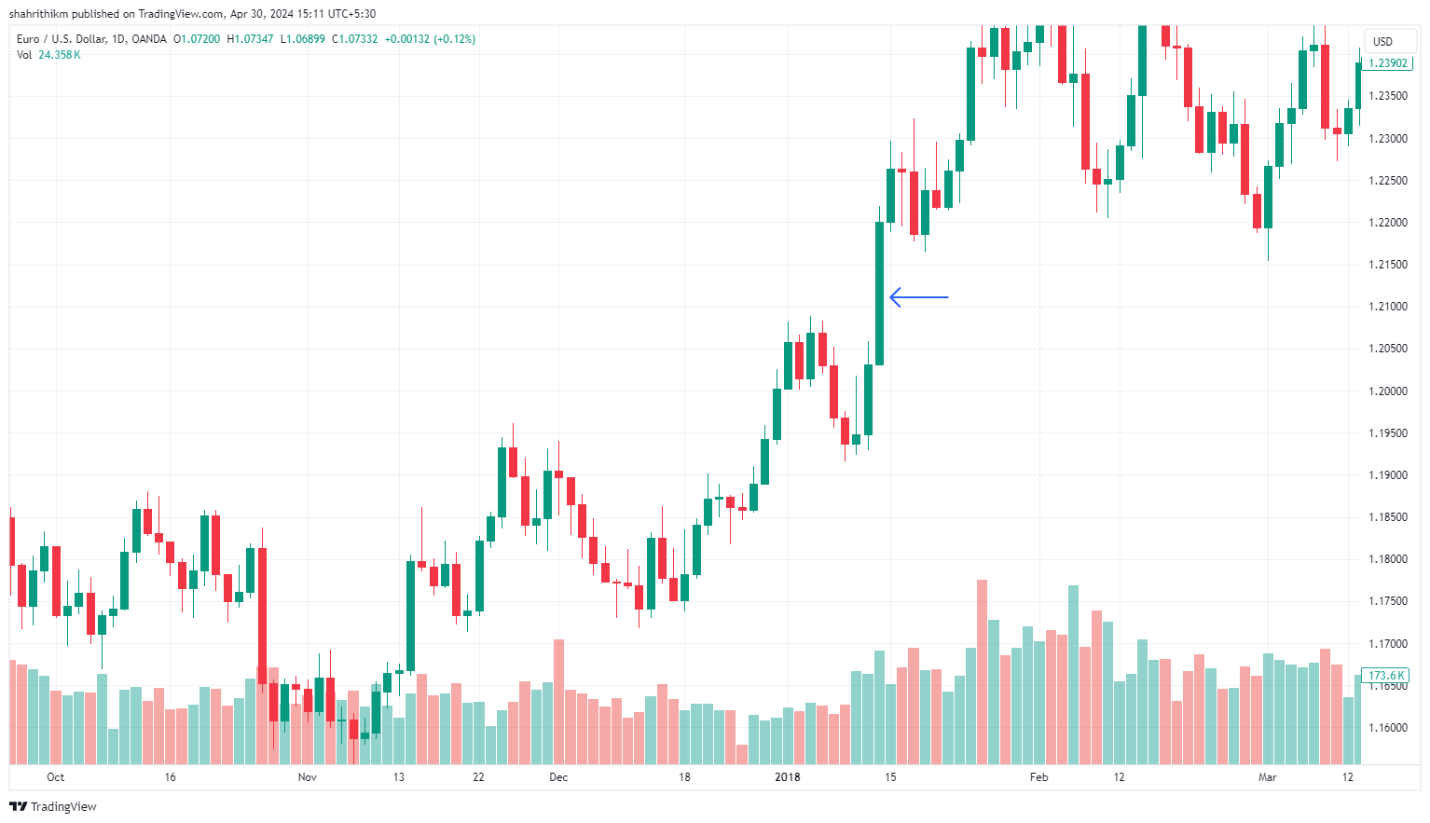 How to identify imbalances on a chart?
Wicks usually show price moving up and down quickly within the time it takes to form that candle, indicating an efficient price. So, when you see a candle with a solid body and no wicks covering it, you've found a clear price imbalance.
Here are some examples of order imbalances in the stock market:
Opening and closing order imbalances
Opening order imbalances happen at the beginning of the trading day when there's a big difference between buy and sell orders for a specific security. Similarly, closing order imbalances occur towards the end of the trading day when there's an imbalance between buy and sell orders.
Initial Public Offerings (IPOs)
During an IPO, order imbalances can occur because there's more demand for shares than there are shares available. This excess demand can make the stock's opening price move a lot, making early trading sessions volatile.
News-driven order imbalances
Big news or events about a company, industry, or the market can cause order imbalances. For instance, good news like a positive earnings report might lead to a lot of buying, creating a buy-side order imbalance. Conversely, bad news can result in too many sell orders, causing a sell-side order imbalance.
Block trades
Large investors or funds often do block trades, where they buy or sell a lot of shares at once. These trades can cause order imbalances because there might not be enough other orders to match their size.
How to use imbalance in trading?
In my trading journey, understanding and applying the order imbalance strategy has been a game-changer. It's like having a special skill that helps me predict where prices might go next, leading to smarter trading decisions and increased profits.
One approach I've found valuable is monitoring order imbalances during volatile market periods. When there's a lot of uncertainty and sudden price movements, imbalances can provide valuable clues about market sentiment. By identifying these imbalances during volatile times, I can gauge the direction of the market and adjust my trading strategy accordingly to capitalize on potential opportunities.
Additionally, I've learned to pay attention to sector-specific imbalances. Different sectors of the market can behave differently based on various factors such as industry news, economic conditions, or geopolitical events. By focusing on imbalances within specific sectors, I can gain deeper insights into sector-specific trends and make more targeted trading decisions.
A helpful tip from Andrey Mastykin is to consider the impact of liquidity when analyzing order imbalances. In markets with low liquidity, large order imbalances can have a more pronounced effect on price movements. Therefore, it's essential to assess the liquidity conditions of the market when interpreting imbalances to ensure more accurate trading decisions.
Imbalance trading tools and indicators
Traders use different tools and indicators to find imbalances in their trading strategies. These tools include Order Book Imbalance, Tick Volume, Volume Imbalance, and Fair Value Gap (FVG). Here's how each tool works:
Order Book Imbalance
This tool calculates the difference between the numbers of buy and sell orders and compares it to their total. It helps traders understand how orders are flowing in the market, showing if there are more buyers or sellers. For example, if there are more buy orders than sell orders, it might mean bullish sentiment.
Tick Volume
Tick volume shows how many price changes (ticks) happen in a certain time. It helps traders see how active trading is and if prices might change direction. For instance, if there's a sudden increase in tick volume, it could signal a potential reversal.
Volume Imbalance
Volume imbalance looks at the difference between buy and sell volumes compared to their total. It gives a picture of how trading volumes are distributed, pointing out areas where there's a lot of buying or selling pressure. For instance, if there's a big difference between buy and sell volumes, it could indicate a strong market move in one direction.
Fair Value Gap (FVG)
FVG is a pattern of three candles that shows when there's an imbalance or inefficiency in the market. It helps traders find areas where prices might move due to a lack of trading activity. For example, if there's a big gap between the close of one candle and the open of the next, it could signal a potential price movement.
These tools give traders insights into how orders flow, where trading volumes are concentrated, and where price movements might happen. For instance, Order Book Imbalance can reveal shifts in market sentiment, Volume Imbalance can highlight areas of strong buying or selling pressure, and FVG can guide traders to potential entry and exit points based on market liquidity. By using these tools together, traders can understand market imbalances better and make smarter trading decisions.
What are the pros and cons of imbalances?
- Pros:
- Cons:
- New trading opportunities
Imbalances in trading create fresh chances for traders to make money by spotting market inefficiencies and taking advantage of price changes caused by imbalanced orders - Market control identification
Imbalances help traders figure out who's in charge of the market at any given time. This insight gives them an idea of market trends and possible price movements based on whether aggressive buyers or sellers are dominating - Enhanced market analysis
Imbalance indicators like Order Book Imbalance and Volume Imbalance give traders a different view of how the market works. This helps them make better decisions by understanding order flow and volume distribution - Support and resistance confirmation Imbalances can confirm levels where prices tend to stop going up or down. This helps traders pick the right times to enter or exit trades and set stop levels to manage risks
- Competitive advantage
Using imbalance analysis gives traders an edge by letting them see information inside a bar in real-time. This helps them react quickly to changes in the market and make smart trading choices
- Fast reaction required
Successful imbalance trading means acting quickly to grab opportunities and make trades based on the imbalances identified. Traders need to be fast to catch these chances - Continuous market monitoring
Traders into imbalance trading must keep an eye on the market all the time. They need to watch closely to spot new imbalances and take action promptly - Intraday trading focus
Imbalance trading works best for short-term trading where prices move quickly because of imbalances. It's not as useful for longer-term trading strategies where prices change more slowly
Conclusion
In this article, we've explored the world of imbalance trading and gathered top tips from volume traders to help you navigate this strategy effectively. Imbalance trading involves identifying situations where there's an excess of buy or sell orders for a particular security, leading to potential price movements. To spot imbalances, traders can use tools like Order Book Imbalance, Tick Volume, Volume Imbalance, and Fair Value Gap. Once identified, traders can employ various strategies, including order imbalance analysis, imbalance continuation, and fading imbalances. These strategies help traders anticipate future price movements and make informed trading decisions.
FAQs
What does imbalance mean in trading?
In trading, imbalance refers to a situation where there's an excess of buy or sell orders for a particular security, potentially leading to significant price movements.
What is the best time frame for imbalance trading?
The best time frame for imbalance trading depends on individual trading preferences and market conditions. Shorter time frames, like intraday, are often favored for quick price movements driven by imbalances.
How to spot imbalance in Forex?
To spot imbalance in Forex, traders can look for significant differences between buy and sell orders, unusual price movements, or patterns indicating strong buying or selling pressure on Forex charts.
How do you read an imbalance chart?
Reading an imbalance chart involves analyzing the distribution of buy and sell orders, identifying areas of imbalance, and understanding how they may impact price movements. Traders also look for patterns and trends to make informed trading decisions.
Related Articles
Team that worked on the article
Parshwa is a content expert and finance professional possessing deep knowledge of stock and options trading, technical and fundamental analysis, and equity research. As a Chartered Accountant Finalist, Parshwa also has expertise in Forex, crypto trading, and personal taxation. His experience is showcased by a prolific body of over 100 articles on Forex, crypto, equity, and personal finance, alongside personalized advisory roles in tax consultation.
Dr. BJ Johnson is a PhD in English Language and an editor with over 15 years of experience. He earned his degree in English Language in the U.S and the UK. In 2020, Dr. Johnson joined the Traders Union team. Since then, he has created over 100 exclusive articles and edited over 300 articles of other authors.
Mirjan Hipolito is a journalist and news editor at Traders Union. She is an expert crypto writer with five years of experience in the financial markets. Her specialties are daily market news, price predictions, and Initial Coin Offerings (ICO).
In the Forex market, a “trend” is the label used to describe the general direction that the prices of currency pairs are moving in, over a specific period of time. Trends are basically the pattern that a currency pair appears to be following and can help traders determine when to enter and exit a trade.
BaFin is the Federal Financial Supervisory Authority of Germany. Along with the German Federal Bank and the Ministry of Finance, this government regulator ensures that licensees abide by eurozone laws.
Forex trading, short for foreign exchange trading, is the practice of buying and selling currencies in the global foreign exchange market with the aim of profiting from fluctuations in exchange rates. Traders speculate on whether one currency will rise or fall in value relative to another currency and make trading decisions accordingly. However, beware that trading carries risks, and you can lose your whole capital.
CFD is a contract between an investor/trader and seller that demonstrates that the trader will need to pay the price difference between the current value of the asset and its value at the time of contract to the seller.
Crypto trading involves the buying and selling of cryptocurrencies, such as Bitcoin, Ethereum, or other digital assets, with the aim of making a profit from price fluctuations.

-
 Afghanistan
-
 Albania
-
 Algeria
-
 Argentina
-
 Armenia
-
 Australia
-
 Austria
-
 Azerbaijan
-
 Bahamas
-
 Bahrain
-
 Bangladesh
-
 Belgium
-
 Botswana
-
 Brazil
-
 Brunei
-
 Bulgaria
-
 Burma
Burma
-
 Cambodia
-
 Cameroon
-
 Canada
-
 Chile
Chile
-
 China
China
-
 Colombia
-
 Costa Rica
-
 Cote d'Ivoire
-
 Croatia
-
 Cyprus
-
 Czech Republic
-
 Denmark
-
 Dominican Republic
-
 Ecuador
-
 Egypt
Egypt
-
 Estonia
-
 Eswatini
-
 Ethiopia
-
 Finland
-
 France
-
 Georgia
-
 Germany
-
 Ghana
Ghana
-
 Greece
-
 Haiti
Haiti
-
 Hong Kong
-
 Hungary
-
 India
India
-
 Indonesia
-
 Iran, Islamic republic
-
 Iraq
Iraq
-
 Ireland
-
 Israel
-
 Italy
Italy
-
 Jamaica
-
 Japan
Japan
-
 Jordan
-
 Kazakhstan
-
 Kenya
Kenya
-
 Korea
Korea
-
 Kuwait
-
 Kyrgyzstan
-
 Laos
Laos
-
 Latvia
-
 Lebanon
-
 Libyan Arab Jamahiriya
-
 Lithuania
-
 Luxembourg
-
 Macedonia
-
 Madagascar
-
 Malaysia
-
 Malta
Malta
-
 Mauritius
-
 Mexico
-
 Moldova
-
 Mongolia
-
 Montenegro
-
 Morocco
-
 Mozambique
-
 Namibia
-
 Nepal
Nepal
-
 Netherlands
-
 Nigeria
-
 Norway
-
 Oman
Oman
-
 Pakistan
-
 Palestine
-
 Papua New Guinea
-
 Peru
Peru
-
 Philippines
-
 Poland
-
 Portugal
-
 Puerto Rico
-
 Qatar
Qatar
-
 Romania
-
 Rwanda
-
 Saudi Arabia
-
 Serbia
-
 Singapore
-
 Slovakia
-
 Slovenia
-
 Somalia
-
 South Africa
-
 Spain
Spain
-
 Sri Lanka
-
 Sweden
-
 Switzerland
-
 Syrian Arab Republic
-
 Taiwan
-
 Tajikistan
-
 Tanzania, United Republic Of
-
 Thailand
-
 Trinidad and Tobago
-
 Tunisia
-
 Turkey
-
 UAE
UAE
-
 Uganda
-
 Ukraine
-
 United Kingdom
-
United States
-
 Uzbekistan
-
 Venezuela
-
 Vietnam
-
 Yemen
Yemen
-
 Zambia
-
 Zimbabwe
- Forex
- Crypto

