Supertrend Indicator: Settings And Strategies To Use


Editorial Note: While we adhere to strict Editorial Integrity, this post may contain references to products from our partners. Here's an explanation for How We Make Money. None of the data and information on this webpage constitutes investment advice according to our Disclaimer.
Supertrend settings and strategies:
Common settings: Multiplier (e.g., 3) and ATR Period (e.g., 10)
Adjust settings: based on volatility; higher multiplier reduces false signals
Strategies: Trend Following, combining with indicators like RSI or moving averages, using as a trailing stop-loss.
The Supertrend indicator is a powerful trend-following tool built on moving averages and volatility adjustments. It works effectively when combined with other indicators such as Parabolic SAR and MACD, making it a favored choice for long-term trading strategies.
Traders often seek an indicator that can precisely track trends, minimize false signals, and identify ideal entry and exit points. While no single tool can achieve this flawlessly, the Supertrend indicator is highly dependable for those who understand how to use it well.
This guide provides an in-depth look at the Supertrend indicator, offering insights on how it works, its calculation formula, and the best settings for platforms like MetaTrader 4. It also includes practical trading strategies and tips for beginners to confidently add the Supertrend to their trading toolkit.
Supertrend settings for MetaTrader 4 (MT4)
The Supertrend indicator is a widely used tool in technical analysis, designed to assist traders in identifying market trends and spotting potential entry and exit opportunities. It combines the principles of moving averages with volatility measurements to generate actionable signals. The indicator relies on the Average True Range (ATR) to measure market volatility and uses this data to plot a line either above or below the price. A green line below the price indicates an uptrend, while a red line above suggests a downtrend. This visually intuitive system enables traders to quickly analyze market conditions and make strategic decisions.
For traders using MetaTrader 4 (MT4), the Supertrend indicator is particularly popular for identifying trends and reversals. While MT4 does not include the indicator as a standard feature, it can be easily added by downloading and installing a custom file tailored for the platform.
Installing the Supertrend Indicator on MT4
Download the indicator. Obtain the Supertrend indicator file compatible with MT4 from a reputable source.
Access MT4's data folder.
Open MT4.
Click on “File” in the top menu.
Select “Open Data Folder”.
Navigate to the indicators folder:
In the data folder, open the “MQL4” directory.
Then, open the “Indicators” folder.
Install the indicator:
Copy the downloaded Supertrend indicator file into the 'Indicators' folder.
Restart MT4: Close and reopen the MT4 platform to load the new indicator.
Add the indicator to a chart:
Open a chart for the desired trading instrument.
Click on “Insert” in the top menu.
Hover over “Indicators”, then “Custom”, and select “Supertrend”.
Configuring supertrend settings
The Supertrend indicator in MT4 typically has two main parameters:
ATR period: This defines the number of periods used to calculate the Average True Range (ATR), which measures market volatility. A common default setting is 10 periods.
Multiplier: This value determines the distance of the Supertrend line from the price, affecting its sensitivity. A standard default is 3.0.
Adjusting settings
Increasing the ATR Period: A higher period (e.g., 14) makes the indicator less sensitive, reducing false signals but potentially delaying trend identification.
Decreasing the ATR Period: A lower period (e.g., 7) increases sensitivity, providing earlier signals but with a higher chance of false positives.
Adjusting the Multiplier: A higher multiplier (e.g., 4.0) places the Supertrend line further from the price, filtering out minor fluctuations. A lower multiplier (e.g., 2.0) brings the line closer, capturing more price movements but increasing the risk of false signals.
Top strategies for using the supertrend indicator
The Supertrend indicator is a practical tool for traders to identify trends and entry and exit points. Here are some strategies for using it effectively.
1. Trend following strategy
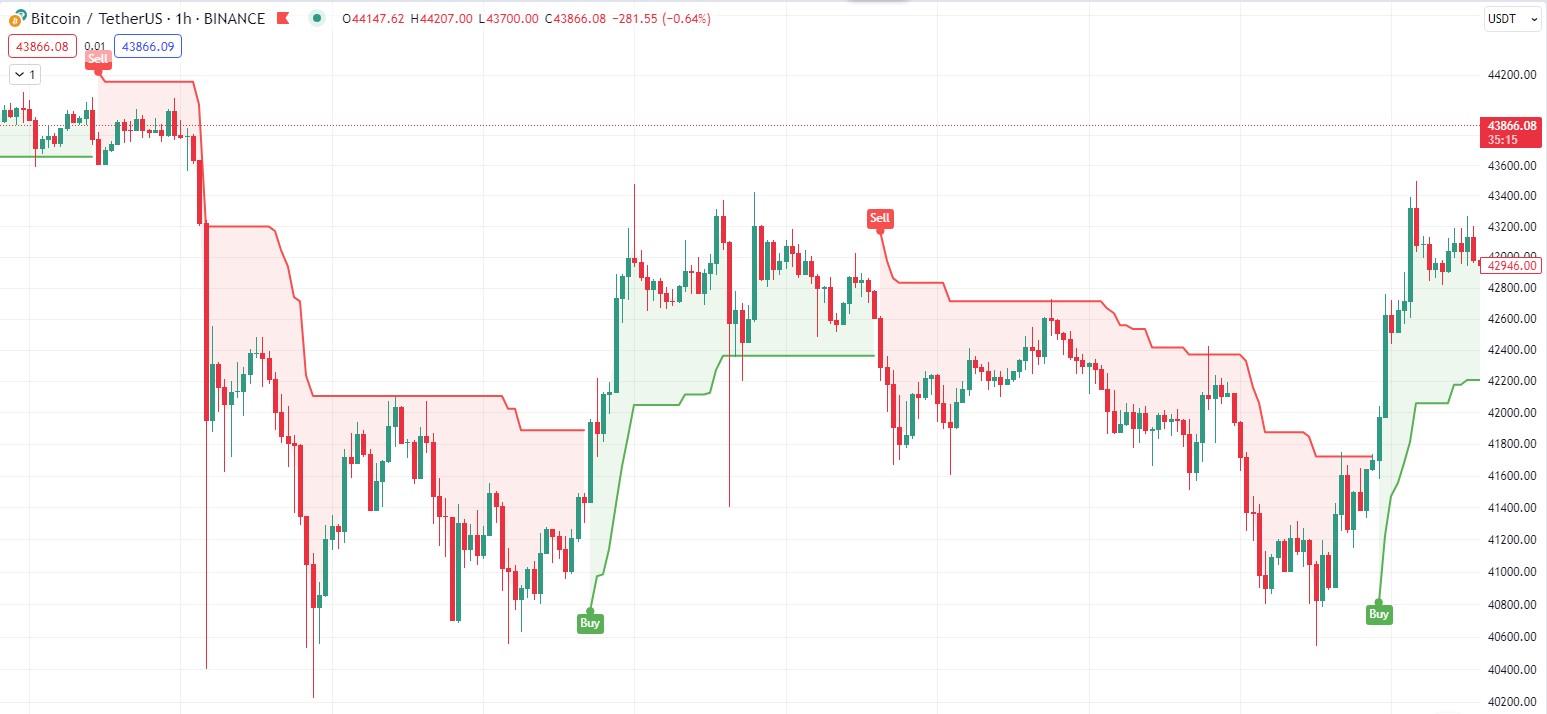
Buy signal. When the Supertrend line shifts below the price and turns green, it suggests an uptrend and a potential buy opportunity.
Sell signal. If the Supertrend line moves above the price and turns red, it indicates a downtrend, signaling a sell.
2. Combining with other indicators
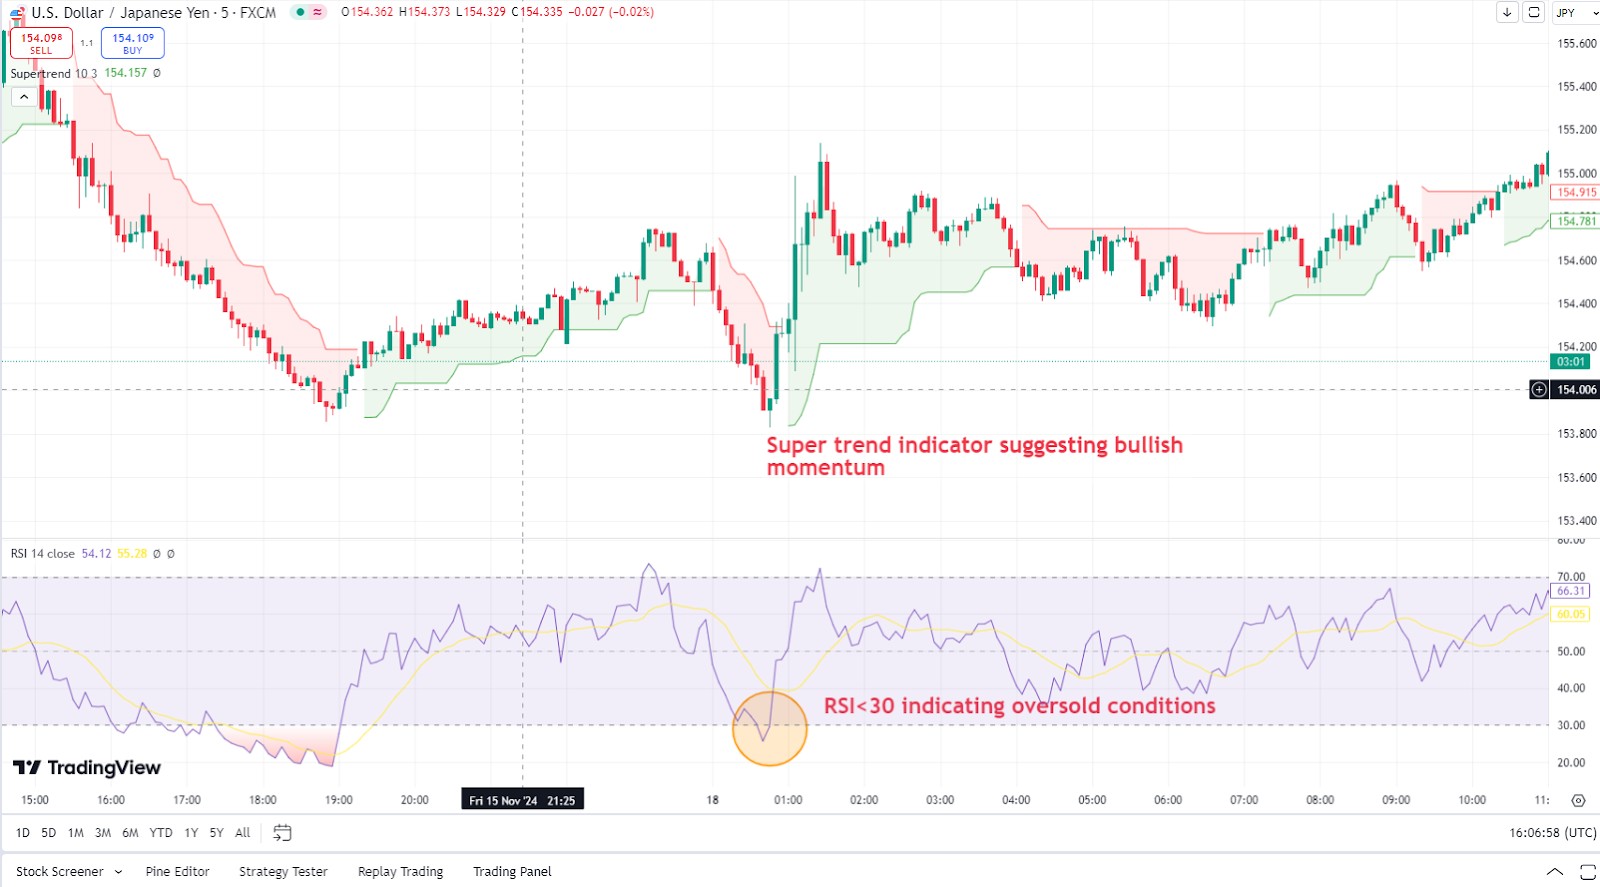
Moving averages. Using moving averages alongside the Supertrend helps confirm trends. If both show an uptrend, the signal strengthens.
Relative strength index (RSI). An oversold RSI reading paired with a Supertrend buy signal can indicate a strong buying opportunity.
3. Adjusting settings for different timeframes
Short-term trading. Lowering the ATR period and multiplier makes the indicator more responsive, fitting for day trading.
Long-term trading. A higher ATR period and larger multiplier filter out noise, better suited for swing or position trading.
4. Using as a trailing stop-loss
For long positions. Set the stop-loss just below the Supertrend line and move it up as the trend progresses.
For short positions. Position the stop-loss above the Supertrend line and lower it as the price drops.
5. Spotting breakouts
During consolidation. The Supertrend line stays close to the price in low volatility phases.
Breakout signal. A price move that causes the line to flip signals the start of a new trend, providing an entry point.
Best platforms for trading with the supertrend indicator
Selecting a suitable trading platform is essential for maximizing the potential of the Supertrend indicator. The ideal platforms provide features such as fast execution, customizable indicator settings, and compatibility with advanced analytical tools. Popular platforms like MetaTrader 4 (MT4), MetaTrader 5 (MT5), and cTrader are often used due to their powerful functionalities, including support for various technical indicators like the Supertrend. These platforms also offer competitive spreads, diverse asset access, and reliable performance for trend-based strategies.
| Demo | Min. deposit, $ | Min Spread EUR/USD, pips | Max Spread EUR/USD, pips | TradingView | MT4 | MT5 | cTrader | Open an account | |
|---|---|---|---|---|---|---|---|---|---|
| Yes | 100 | 0,5 | 0,9 | Yes | No | No | No | Open an account Your capital is at risk. |
|
| Yes | No | 0,5 | 1,5 | Yes | Yes | Yes | Yes | Open an account Your capital is at risk.
|
|
| Yes | No | 0,1 | 0,5 | Yes | Yes | Yes | No | Open an account Your capital is at risk. |
|
| Yes | 100 | 0,7 | 1,2 | Yes | Yes | Yes | No | Study review | |
| Yes | No | 0,2 | 0,8 | Yes | No | No | No | Open an account Your capital is at risk. |
Best assets for trading with the supertrend indicator
The Supertrend works best with assets that exhibit strong, directional trends. Suitable instruments include:
Major currency pairs: Pairs like EUR/USD and USD/JPY often display clear uptrends and downtrends, making them ideal for trend-based strategies.
Commodities: Assets such as gold, silver, and oil frequently trend in response to global market dynamics.
Stock indices: Indices like those representing major economies or sectors trend reliably over various timeframes.
Cryptocurrencies: High-volatility coins like Bitcoin and Ethereum offer strong trend signals suitable for the Supertrend indicator.
Assets to avoid: Instruments with limited or sideways price movement, such as some minor currency pairs or illiquid small-cap stocks, may produce misleading signals. Bonds and other fixed-income assets typically lack the volatility required for effective Supertrend use.
Tips for beginners using the supertrend indicator
To truly harness the power of the Supertrend indicator, consider integrating it with Heikin Ashi candlestick charts. Heikin Ashi charts smooth out price data, filtering out market noise and providing a clearer view of trends. When combined with the Supertrend indicator, this approach can enhance the accuracy of trend identification and reduce false signals. For instance, a study tested over 4,000 Supertrend trades and found that using Heikin Ashi charts improved the performance of most indicators, including Supertrend.
Another advanced strategy involves optimizing the Supertrend's parameters using Bayesian optimization techniques. Instead of relying on default settings, this method systematically searches for the most effective Average True Range (ATR) period and multiplier for a specific asset or market condition. Research has shown that applying Bayesian optimization to the Supertrend indicator's parameters can unlock profit potential by maximizing returns across diverse stock datasets. By tailoring the indicator's settings through data-driven methods, traders can achieve a more responsive and accurate tool, leading to better-informed trading decisions.
Pros and cons of the supertrend indicator
- Pros
- Cons
Provides highly accurate signals in trending markets.
Available on most trading platforms and is user-friendly, making it suitable for beginners.
Helps intraday traders make quick and informed decisions.
Not ideal for non-trending or choppy markets.
Requires pairing with other indicators for filtered and reliable signals.
Can lag during rapid market changes, capturing trends only after they occur.
Refine your use of the Supertrend indicator by adapting its settings to align with current market conditions.

Refine your use of the Supertrend indicator by adapting its settings to align with current market conditions. Instead of sticking with one set of ATR periods and multipliers, adjust them based on how volatile the market is and the volume of trades. This lets the indicator respond better to market changes, cutting down on misleading signals during flat markets and catching strong trends when volatility picks up. This simple tweak can help you sharpen your trading strategy, making your entries and exits more accurate.
Another advanced move is pairing the Supertrend indicator with harmonic patterns. When a harmonic pattern, like a Gartley or Bat, matches up with a Supertrend signal, it can be a solid sign that the trend might continue or reverse. Combining these setups means you're not relying on one indicator alone, but confirming your trades with a mix of signals, which can help manage risk and improve trade quality.
Conclusion
The Supertrend indicator is a powerful trend-following tool that simplifies trading decisions by providing clear buy and sell signals. Its straightforward design makes it ideal for beginners, while its versatility and adaptability to various asset classes ensure seasoned traders can also benefit. While the Supertrend shines in trending markets, combining it with other indicators and fine-tuning its settings are essential for optimal performance. Ultimately, its success depends on understanding market conditions and integrating it into a broader trading strategy.
FAQs
Can the Supertrend indicator be used alone?
Yes, the Supertrend can be used as a standalone indicator, but for better accuracy and filtered signals, it’s recommended to combine it with other tools like the MACD or Parabolic SAR.
What is the best time frame for using the Supertrend?
The best time frame depends on your trading style. Scalpers may prefer 1–15 minute charts, while swing traders often use daily or hourly charts for more comprehensive trend analysis.
Is the Supertrend suitable for all markets?
The Supertrend works best in trending markets. It may not perform well in sideways or low-volatility conditions, so avoid using it for assets that lack strong directional movement.
How can I optimize the Supertrend indicator settings?
To optimize the Supertrend, adjust the ATR and multiplier values based on the asset’s volatility and the time frame you are trading. Testing different settings in a demo account can help identify the best configuration for your strategy.
Related Articles
Team that worked on the article
Andrey Mastykin is an experienced author, editor, and content strategist who has been with Traders Union since 2020. As an editor, he is meticulous about fact-checking and ensuring the accuracy of all information published on the Traders Union platform. Andrey focuses on educating readers about the potential rewards and risks involved in trading financial markets.
He firmly believes that passive investing is a more suitable strategy for most individuals. Andrey's conservative approach and focus on risk management resonate with many readers, making him a trusted source of financial information.
Also, Andrey is a member of the National Union of Journalists of Ukraine (membership card No. 4574, international certificate UKR4492).
Chinmay Soni is a financial analyst with more than 5 years of experience in working with stocks, Forex, derivatives, and other assets. As a founder of a boutique research firm and an active researcher, he covers various industries and fields, providing insights backed by statistical data. He is also an educator in the field of finance and technology.
As an author for Traders Union, he contributes his deep analytical insights on various topics, taking into account various aspects.
Mirjan Hipolito is a journalist and news editor at Traders Union. She is an expert crypto writer with five years of experience in the financial markets. Her specialties are daily market news, price predictions, and Initial Coin Offerings (ICO).
Ethereum is a decentralized blockchain platform and cryptocurrency that was proposed by Vitalik Buterin in late 2013 and development began in early 2014. It was designed as a versatile platform for creating decentralized applications (DApps) and smart contracts.
Risk management is a risk management model that involves controlling potential losses while maximizing profits. The main risk management tools are stop loss, take profit, calculation of position volume taking into account leverage and pip value.
Forex indicators are tools used by traders to analyze market data, often based on technical and/or fundamental factors, to make informed trading decisions.
Supertrend Indicator is a trend-following indicator that helps traders identify potential entry and exit points in the market. It combines price and volatility data to plot a trend-following line that can be used to guide trading decisions. When the price is above the Supertrend line, it suggests a bullish trend, and when below, a bearish trend.
Index in trading is the measure of the performance of a group of stocks, which can include the assets and securities in it.

-
 Afghanistan
-
 Albania
-
 Algeria
-
 Argentina
-
 Armenia
-
 Australia
-
 Austria
-
 Azerbaijan
-
 Bahamas
-
 Bahrain
-
 Bangladesh
-
 Belgium
-
 Botswana
-
 Brazil
-
 Brunei
-
 Bulgaria
-
 Burma
Burma
-
 Cambodia
-
 Cameroon
-
 Canada
-
 Chile
Chile
-
 China
China
-
 Colombia
-
 Costa Rica
-
 Cote d'Ivoire
-
 Croatia
-
 Cyprus
-
 Czech Republic
-
 Denmark
-
 Dominican Republic
-
 Ecuador
-
 Egypt
Egypt
-
 Estonia
-
 Eswatini
-
 Ethiopia
-
 Finland
-
 France
-
 Georgia
-
 Germany
-
 Ghana
Ghana
-
 Greece
-
 Haiti
Haiti
-
 Hong Kong
-
 Hungary
-
 India
India
-
 Indonesia
-
 Iran, Islamic republic
-
 Iraq
Iraq
-
 Ireland
-
 Israel
-
 Italy
Italy
-
 Jamaica
-
 Japan
Japan
-
 Jordan
-
 Kazakhstan
-
 Kenya
Kenya
-
 Korea
Korea
-
 Kuwait
-
 Kyrgyzstan
-
 Laos
Laos
-
 Latvia
-
 Lebanon
-
 Libyan Arab Jamahiriya
-
 Lithuania
-
 Luxembourg
-
 Macedonia
-
 Madagascar
-
 Malaysia
-
 Malta
Malta
-
 Mauritius
-
 Mexico
-
 Moldova
-
 Mongolia
-
 Montenegro
-
 Morocco
-
 Mozambique
-
 Namibia
-
 Nepal
Nepal
-
 Netherlands
-
 Nigeria
-
 Norway
-
 Oman
Oman
-
 Pakistan
-
 Palestine
-
 Papua New Guinea
-
 Peru
Peru
-
 Philippines
-
 Poland
-
 Portugal
-
 Puerto Rico
-
 Qatar
Qatar
-
 Romania
-
 Rwanda
-
 Saudi Arabia
-
 Serbia
-
 Singapore
-
 Slovakia
-
 Slovenia
-
 Somalia
-
 South Africa
-
 Spain
Spain
-
 Sri Lanka
-
 Sweden
-
 Switzerland
-
 Syrian Arab Republic
-
 Taiwan
-
 Tajikistan
-
 Tanzania, United Republic Of
-
 Thailand
-
 Trinidad and Tobago
-
 Tunisia
-
 Turkey
-
 UAE
UAE
-
 Uganda
-
 Ukraine
-
 United Kingdom
-
United States
-
 Uzbekistan
-
 Venezuela
-
 Vietnam
-
 Yemen
Yemen
-
 Zambia
-
 Zimbabwe
- Forex
- Crypto

