How To Select Stocks: Beginner's Guide


Editorial Note: While we adhere to strict Editorial Integrity, this post may contain references to products from our partners. Here's an explanation for How We Make Money. None of the data and information on this webpage constitutes investment advice according to our Disclaimer.
To select stocks you need to use:
Stock analysis: evaluate a company's performance, market position, and potential.
Financial ratios: assess metrics like P/E ratio, debt-to-equity, and return on equity.
Stock screeners: filter stocks based on criteria such as industry, market cap, and valuation.
Risk management: implement strategies to balance potential gains with risk.
Picking the right stocks isn’t about taking wild guesses or jumping on whatever’s trending. It’s about using a straightforward system to make better choices. This guide breaks down how to read important numbers that show how a company is really doing and explains ways to manage risks so you don’t end up losing big. If you’ve ever felt confused about how pros turn analysis into solid picks, you’re about to get some answers.
How to select stocks: best methods to pick a stock
When choosing stocks, you should focus on strategies and asset types. For example, if the goal is long-term growth, preference is given to growth stocks or index funds that can generate significant profits over many years. If the priority is to receive regular income, then the emphasis is on dividend stocks or stable companies that regularly pay income to investors.
Before starting to invest, you should also study the market and financial indicators of the companies of interest to assess their stability and prospects. In-depth analysis of financial statements and knowledge of market conditions allows you to avoid hasty decisions and reduce the risk of losses. First of all, this is useful for beginners, since studying the company, its income, debt burden and prospects in the industry forms a more realistic expectation of profitability.
Stock analysis
Fundamental analysis focuses on studying the internal state of a company to determine the fair value of shares. The main sources of data are annual (10-K) and quarterly (10-Q) reports. For public companies, they are publicly available, for example, on platforms such as the SEC EDGAR. Such reports include information on the company's revenue, profit, assets, and liabilities. By studying the reports, investors can assess the company's sustainability, its potential for growth, and its ability to manage debt. Ratios such as the P/E (price to earnings) ratio and ROE (return on equity) help assess how effectively a company uses its resources to generate profits and grow.
Technical analysis focuses on price and trading volume changes, examining historical charts and patterns to predict future stock movements. One of the basic tools is moving averages, which help identify trends. Support and resistance lines built on historical highs and lows can show possible entry and exit points. Platforms such as TradingView and Yahoo Finance offer technical analysis tools and are available for free use, providing charts and indicators useful for short-term and long-term forecasts.
Financial ratios
The P/E (price to earnings) ratio measures the current market price of a stock relative to the company's earnings per share (EPS). This ratio is used to assess how expensive or cheap a stock is relative to its earnings.
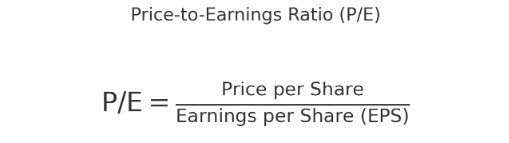
A high P/E may indicate that a stock is overvalued or that the company is expected to grow, while a low P/E may indicate the opposite. P/E can help compare companies in the same industry or evaluate a stock relative to the market as a whole. For example, investors can use a company's current P/E and compare it to historical values for its industry or the S&P 500 index to determine whether the current price is attractive to buy or sell.
ROE (return on equity) measures how effectively a company uses shareholder capital to generate profits. This ratio is calculated by dividing net income by shareholder equity.

A high ROE is an indication of management's success in returning shareholder investment. It is often a sign of a company's financial health and competitive advantage. By comparing ROE of companies in the same industry, investors can identify those that use resources most efficiently, but it should also be taken into account that high profitability can be artificially increased, for example, by buying back shares.
Debt-to-Equity Ratio is the ratio of a company's liabilities to its equity. This ratio allows you to assess how dependent the company is on borrowed funds.
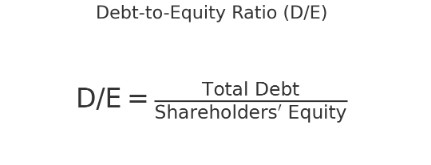
A high debt load indicates significant liabilities, which can increase the risk for shareholders, especially in conditions of financial instability. However, for companies that successfully cope with high debt and have stable cash flows, a higher ratio may be acceptable. Debt analysis is useful for determining the sustainability of a company and its ability to meet debt obligations in the long term.
Stock screeners
Stock screeners help investors sort stocks by various criteria, making it easier to find the right assets. Screeners allow you to filter stocks by market capitalization, dividend yield, price to earnings (P/E), and other financial metrics. Screeners allow you to more objectively evaluate the potential of investments. For example, an investor can set parameters such as high dividends or low debt ratios to quickly find stocks that match their investment preferences and strategy.
Popular platforms such as Yahoo Finance and Morningstar provide easy-to-use screeners with a variety of filters.
Yahoo Finance offers an intuitive interface and support for a variety of criteria, including ESG (environmental, social, and governance) filters, which appeals to investors focused on sustainability.
Morningstar provides expert stock ratings and filters for ETFs and mutual funds for deeper analysis.
Finviz is also popular for its wide range of filters, including IPO and current stock offering data, making it useful for more advanced investors.
Screeners save time and improve the quality of investor decisions, especially if the goal is to quickly identify suitable stocks based on specified parameters.
Risk management
Portfolio diversification is a strategy of spreading assets across different industries and asset types to minimize risk. The basic idea behind diversification is that the decline in returns on one asset can be offset by the gains on another. Investors can reduce the negative impact of losses in one market segment by combining stocks from different companies and sectors, as well as adding assets such as bonds or funds. This helps balance the overall risk of the portfolio and makes it more resilient to market volatility.
Loss-limiting strategies include the use of stop-loss orders, which automatically sell an asset if its price falls to a certain level. This approach protects investors from significant losses, especially in volatile markets. In addition to stop-losses, some investors use trailing stop orders, which follow the price, providing profit protection. These strategies help limit losses without the need for constant market monitoring, which is especially useful for beginners and long-term investors.
Individual stocks carry significantly higher risk than funds because the return on an individual company's stock is highly dependent on its financial health and overall stability. Index funds, unlike individual stocks, provide built-in diversification because they include stocks from many companies following a specific market index. This makes them more resilient to declines in the value of individual companies and reduces risk for long-term investors, especially those who prefer stable income with less market volatility.
In order to trade shares, you do not have to own them directly. For this, there are CFDs and brokers who provide CFDs for many shares, among which you will definitely find those you need.
| Stocks | Demo | Min. deposit, $ | Max. leverage | Apple CFD spread | Investor protection | Open an account | |
|---|---|---|---|---|---|---|---|
| Yes | Yes | 100 | 1:300 | 1,63 | €20,000 £85,000 SGD 75,000 | Open an account Your capital is at risk. |
|
| Yes | Yes | No | 1:500 | 0,4 | £85,000 €20,000 €100,000 (DE) | Open an account Your capital is at risk.
|
|
| Yes | Yes | No | 1:200 | 1,2 | £85,000 SGD 75,000 $500,000 | Open an account Your capital is at risk. |
|
| Yes | Yes | 100 | 1:50 | 0,5 | £85,000 | Study review | |
| Yes | Yes | No | 1:30 | 0,5 | $500,000 £85,000 | Open an account Your capital is at risk. |
How can I avoid selecting wrong stocks?
Staying away from bad stock picks isn't just about following hype or jumping on trends. Start by checking if a company is making money consistently. If their sales aren’t growing or they’ve borrowed too much, be careful — it might not be a wise bet. Just because a company is popular doesn’t mean it’s a safe choice.
Also, look at who’s running the show. If the leadership seems shaky or there’s a revolving door of executives, that’s a red flag. It’s smart to see what big investment funds are doing, too. If they’re bailing out of a stock, take the hint and figure out why. And finally, spread your bets across different stocks so one bad pick doesn’t wipe you out.
How much should I invest in stocks?
How much to put into stocks depends a lot on what’s going on in your life and what you’re aiming for. If you’re just dipping your toes into the market, start with money you won’t miss anytime soon — something you’re okay with letting sit for five to ten years. Why? Because stocks can be a rollercoaster ride, and you don’t want to have to pull out cash during a market slump.
A good starting point might be 10-20% of your savings, then you can bump it up as you learn the ropes. But always keep your safety net intact — no investment is worth the risk of not being able to handle an emergency.
When is the right time to sell your stocks?
Reevaluate your original reasons for buying. Check if the initial reasons for purchasing the stock still hold; if not, it may be time to consider selling.
Assess the company's performance. If the company’s financial health is declining or competitors are outpacing it, selling could be a wise choice.
Consider your personal financial goals. If the stock reaches a price target you set for paying off a loan or funding an important goal, it might be a good time to sell.
Account for tax implications. Be cautious of selling too soon, as this could result in a higher tax burden.
Stay focused on your financial goals. Regularly review your objectives and avoid getting swayed by market hype or outside noise.
When choosing stocks, pay attention to economic cycles

When choosing stocks, pay attention to macroeconomic trends. Understanding the economic cycle helps you more accurately assess which sectors of the economy are likely to show growth. During periods of low interest rates, consumer-focused stocks tend to attract more investment, as consumers have higher purchasing power. It is important to follow the news and reports of major economic agencies, such as the Federal Reserve or the European Central Bank, to understand how their actions may affect the market.
Additionally, remember about psychological factors when making investment decisions. Even the best financial indicators do not guarantee success if decisions are made under the influence of emotions. I strongly recommend developing discipline and creating clear rules for exiting and entering trades based on your financial goals and risk tolerance. Understanding your own psychological resilience to market fluctuations can be just as important as technical and fundamental indicators.
Conclusion
Picking the right stocks isn’t just about crunching numbers or reading up on risk—it’s about using these insights to shape your financial path. As you get more experience, keep an eye on market changes, tweak your methods, and stay flexible. The truth is, investing is something you get better at with practice. While there’s no magic formula for success, having a solid game plan makes a big difference. So get in there, learn from what happens, and let every choice make you a smarter, stronger investor.
FAQs
What are the alternatives to diversify without investing in index funds?
In addition to index funds, investors can consider ETFs, which provide diversification across a specific index or sector but allow them to trade like stocks. There are also real estate exchange-traded funds and combined portfolios that include bonds, which reduce risk and help spread assets.
How do macroeconomic factors affect stock selection?
Macroeconomic factors such as inflation, interest rates, and the economic cycle can significantly affect stock returns. For example, in a low interest rate environment, growth stocks may outperform, while in a downturn, more stable companies with high dividend yields become more favorable.
How can I best manage risk if I am a beginner investor?
As a beginner investor, it is recommended to focus on diversification and choosing stable assets. Avoid too much exposure to one stock and spread your funds across different sectors and asset classes. Determine your risk tolerance and set stop-losses in advance to minimize potential losses.
Do time frames matter when analyzing stocks?
Yes, time frames matter: short-term traders typically use daily and hourly charts to catch price swings, while long-term investors turn to weekly and monthly charts to track trends and account for seasonal fluctuations.
Related Articles
Team that worked on the article
Maxim Nechiporenko has been a contributor to Traders Union since 2023. He started his professional career in the media in 2006. He has expertise in finance and investment, and his field of interest covers all aspects of geoeconomics. Maxim provides up-to-date information on trading, cryptocurrencies and other financial instruments. He regularly updates his knowledge to keep abreast of the latest innovations and trends in the market.
Chinmay Soni is a financial analyst with more than 5 years of experience in working with stocks, Forex, derivatives, and other assets. As a founder of a boutique research firm and an active researcher, he covers various industries and fields, providing insights backed by statistical data. He is also an educator in the field of finance and technology.
As an author for Traders Union, he contributes his deep analytical insights on various topics, taking into account various aspects.
Mirjan Hipolito is a journalist and news editor at Traders Union. She is an expert crypto writer with five years of experience in the financial markets. Her specialties are daily market news, price predictions, and Initial Coin Offerings (ICO).
Volatility refers to the degree of variation or fluctuation in the price or value of a financial asset, such as stocks, bonds, or cryptocurrencies, over a period of time. Higher volatility indicates that an asset's price is experiencing more significant and rapid price swings, while lower volatility suggests relatively stable and gradual price movements.
A Trailing Stop Order is a type of order that automatically adjusts the stop-loss level as the market price moves in a favorable direction, helping to protect profits.
Fundamental analysis is a method or tool that investors use that seeks to determine the intrinsic value of a security by examining economic and financial factors. It considers macroeconomic factors such as the state of the economy and industry conditions.
Cryptocurrency is a type of digital or virtual currency that relies on cryptography for security. Unlike traditional currencies issued by governments (fiat currencies), cryptocurrencies operate on decentralized networks, typically based on blockchain technology.
Index in trading is the measure of the performance of a group of stocks, which can include the assets and securities in it.


-
 Afghanistan
-
 Albania
-
 Algeria
-
 Argentina
-
 Armenia
-
 Australia
-
 Austria
-
 Azerbaijan
-
 Bahamas
-
 Bahrain
-
 Bangladesh
-
 Belgium
-
 Botswana
-
 Brazil
-
 Brunei
-
 Bulgaria
-
 Burma
Burma
-
 Cambodia
-
 Cameroon
-
 Canada
-
 Chile
Chile
-
 China
China
-
 Colombia
-
 Costa Rica
-
 Cote d'Ivoire
-
 Croatia
-
 Cyprus
-
 Czech Republic
-
 Denmark
-
 Dominican Republic
-
 Ecuador
-
 Egypt
Egypt
-
 Estonia
-
 Eswatini
-
 Ethiopia
-
 Finland
-
 France
-
 Georgia
-
 Germany
-
 Ghana
Ghana
-
 Greece
-
 Haiti
Haiti
-
 Hong Kong
-
 Hungary
-
 India
India
-
 Indonesia
-
 Iran, Islamic republic
-
 Iraq
Iraq
-
 Ireland
-
 Israel
-
 Italy
Italy
-
 Jamaica
-
 Japan
Japan
-
 Jordan
-
 Kazakhstan
-
 Kenya
Kenya
-
 Korea
Korea
-
 Kuwait
-
 Kyrgyzstan
-
 Laos
Laos
-
 Latvia
-
 Lebanon
-
 Libyan Arab Jamahiriya
-
 Lithuania
-
 Luxembourg
-
 Macedonia
-
 Madagascar
-
 Malaysia
-
 Malta
Malta
-
 Mauritius
-
 Mexico
-
 Moldova
-
 Mongolia
-
 Montenegro
-
 Morocco
-
 Mozambique
-
 Namibia
-
 Nepal
Nepal
-
 Netherlands
-
 Nigeria
-
 Norway
-
 Oman
Oman
-
 Pakistan
-
 Palestine
-
 Papua New Guinea
-
 Peru
Peru
-
 Philippines
-
 Poland
-
 Portugal
-
 Puerto Rico
-
 Qatar
Qatar
-
 Romania
-
 Rwanda
-
 Saudi Arabia
-
 Serbia
-
 Singapore
-
 Slovakia
-
 Slovenia
-
 Somalia
-
 South Africa
-
 Spain
Spain
-
 Sri Lanka
-
 Sweden
-
 Switzerland
-
 Syrian Arab Republic
-
 Taiwan
-
 Tajikistan
-
 Tanzania, United Republic Of
-
 Thailand
-
 Trinidad and Tobago
-
 Tunisia
-
 Turkey
-
 UAE
UAE
-
 Uganda
-
 Ukraine
-
 United Kingdom
-
United States
-
 Uzbekistan
-
 Venezuela
-
 Vietnam
-
 Yemen
Yemen
-
 Zambia
-
 Zimbabwe
- Forex
- Crypto
