How To Trade Trendlines In Forex


Editorial Note: While we adhere to strict Editorial Integrity, this post may contain references to products from our partners. Here's an explanation for How We Make Money. None of the data and information on this webpage constitutes investment advice according to our Disclaimer.
Best trendline trading strategies
Strategia 1. Opening trades with the trend.
Strategia 2. Selling in a downtrend.
Strategia 3. Trading against the trend.
Strategia 4. Trading breakouts on pullbacks.
Among the numerous strategies of trading in financial and commodity markets, the most popular remains to be trendline trading. For most traders, this is the simplest and clearest strategy.
It was popular many years ago, still is, and will be popular in the foreseeable future, because by opening positions with the trend, you can get the highest profit at minimal risk. In this article, we'll take a look at how to draw and trade trendlines.
Best trendline trading strategies
Here are the top trendline trading strategies:
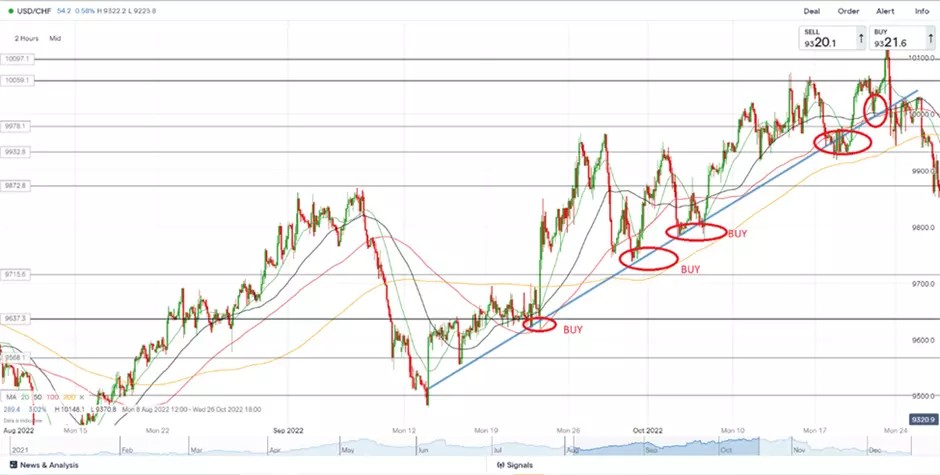
Opening trades with the trend
The most reliable trendline strategy is trading with the trend. In an uptrend, identify the ascending support line and buy on pullbacks to it. Close the trade when the price approaches the ascending resistance line or based on your calculations. Place a stop loss slightly below the trendline to account for potential breakouts.
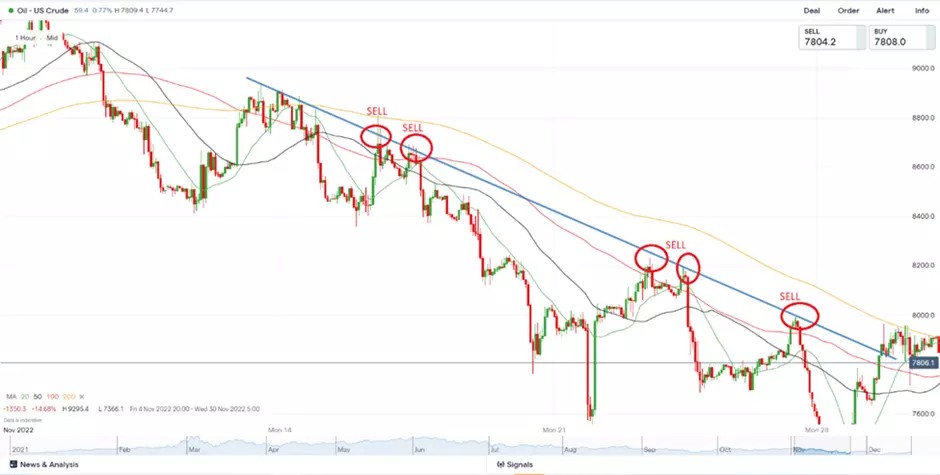
Selling in a downtrend
In a downtrend, draw a descending resistance line and sell on pullbacks to it. Place the stop loss above the line, factoring in false breakouts. This strategy offers a strong risk/reward ratio, especially when the trend is steady.
Trading against the trend
Experienced traders may sell at highs in an uptrend (expecting a pullback to support) or buy at lows in a downtrend (anticipating a move to resistance). This approach is risky and not recommended for beginners due to the potential for rapid, unpredictable price movements.
Trading breakouts on pullbacks
After a trendline is broken, traders can sell or buy on a pullback to the line. A breakout may signal a trend reversal, but false breakouts are common in strong movements, so caution is needed.
What is a trendline?
A trendline is a straight line drawn on a price chart to represent the direction of a trend in financial markets.
In an uptrend, the trendline is drawn along the support levels by connecting the lows, while in a downtrend, it is drawn along the resistance levels by connecting the highs. This simple tool helps traders visualize the trend direction and identify potential support or resistance areas.
Support line
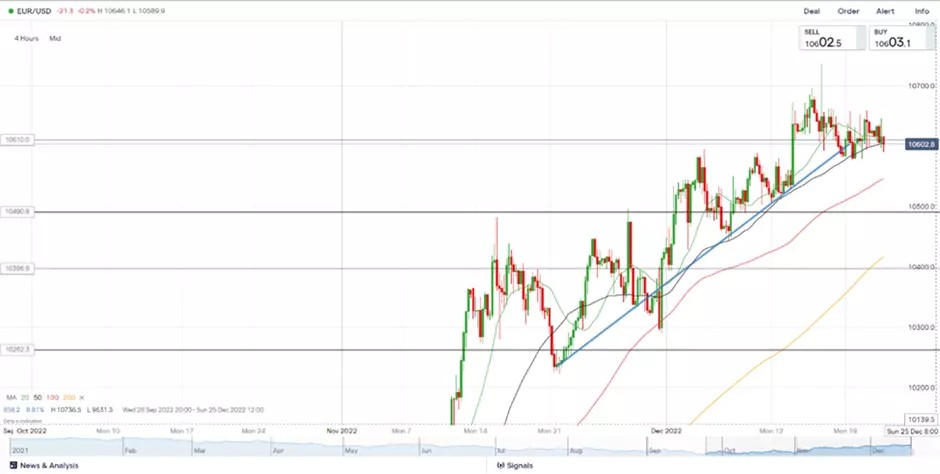
On this EUR/USD chart, you see a strongly pronounced uptrend. The blue line drawn along the support levels clearly shows the trend direction and is an ascending support line.
There is a rule that a trendline is valid if it’s drawn through at least three lower or higher points, i.e., support or resistance levels.
Therefore, the above example demonstrates a valid trendline confirmed by several touches of the price.
Resistance line
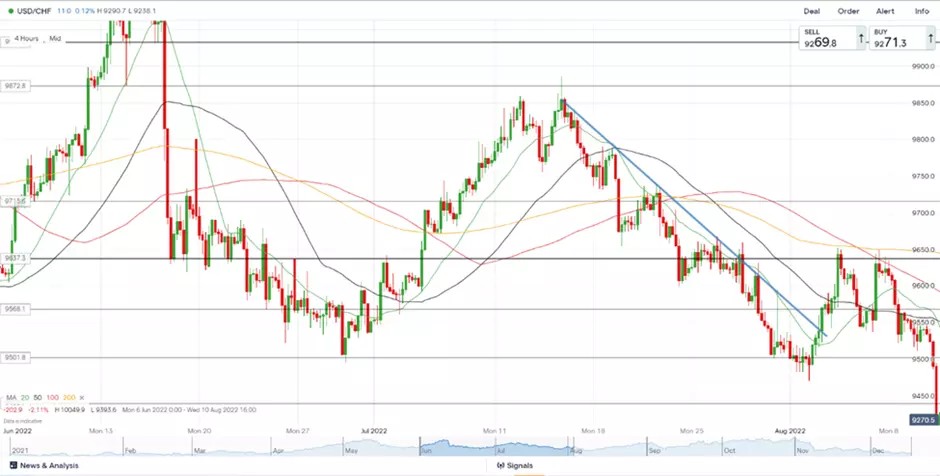
This example displays a downtrend of USD/CHF. Here, the trendline connects the highs, or resistance levels, and clearly shows the trend direction. After the price touches the highs three times during pullbacks, the trendline can be safely deemed confirmed, and a trader can prepare to sell the asset.
It’s worth noting – and professional traders know it perfectly well – that during pullbacks, the price doesn’t always clearly touch support or resistance lines. As the trend develops, bears or bulls are constantly trying to take control of the situation, and their efforts can be more active or less active. That is why the price may either not reach the trendline or cross it, making a false breakout.
Therefore, novices should not wait for obvious touches of a trendline, otherwise, instead of becoming traders, they may become “waiters”, which will hardly bring them any income. On the other hand, waiting skills may be good for some other activities or jobs, but this article does not include any tips on that.
How to draw trendlines correctly
For a trendline to be valid, the price must touch it at least three times. To avoid misreading trends, traders should analyze price action on both small and large scales. On smaller time frames, a pullback might appear as a new trend, leading to incorrect decisions.
For example, on a 30-minute chart, a strong downtrend in GBP/USD may seem significant. However, when zoomed out to a 4-hour chart, the same move could be just a pullback within a larger uptrend. Viewing the bigger picture allows traders to identify long-term trends, spot buying opportunities (like pullbacks to an ascending trendline), and avoid costly mistakes.

Here are a few tips you must follow:
Wait for confirmation
Beginners should look for at least three touches of the trendline.
Combine trendlines with indicators like Moving Averages (MAs) or Bollinger Bands. If a trendline aligns with an MA, it confirms a strong support or resistance level.
Indicators matter
Bollinger Bands. Widening bands signal a strong trend.
Use MAs and Bollinger Bands to place stop-loss orders.
The angle of the trendline
Ideally, the trendline angle should be around 45 degrees.
Less than 45°. The trend is weak or fading.
More than 45°. The price moves too quickly, making pullbacks difficult to trade.
For example, in a rapid USD/JPY move (with an angle steeper than 45°), entries are challenging as the price barely touches the trendline.
Choosing the right time frame
Short-term trades. 15- to 45-minute charts.
Medium-term short-term trades. 1- to 4-hour charts.
Long-term trades. 4-hour charts or longer.
Medium and long-term trends tend to be the most reliable. Beginners should focus on these time frames for steadier analysis and stronger trends.
Pros and cons of trendlines
- Pros:
- Cons:
Easy to learn. Suitable for traders of all experience levels.
Objective analysis. Helps remove emotional biases from trading decisions.
Better trade timing. Improves entry and exit points to maximize profits and minimize losses.
Versatile. Can be combined with technical indicators like moving averages for greater accuracy.
Subjectivity. Identifying patterns and drawing trendlines can vary between traders.
False signals. These tools may produce unreliable signals, leading to losses.
Experience required. Accurate use depends on a trader's skill and practice.
Over-reliance. Focusing too much on patterns may cause traders to overlook key market events or data.
Which strategy beginners should use
It is quite clear that the best strategy for beginners is to trade with the trend during pullbacks to the trendline. All other strategies are too risky and, therefore, more suitable for professional traders.
For beginners, the choice of broker is also as important as the choice of strategy. To help them make this choice, we have prepared a list of top Forex brokers offering advanced trading tools:
| Plus500 | Pepperstone | OANDA | FOREX.com | Interactive Brokers | |
|---|---|---|---|---|---|
|
Demo |
Yes | Yes | Yes | Yes | Yes |
|
Min. deposit, $ |
100 | No | No | 100 | No |
|
Min Spread EUR/USD, pips |
0,5 | 0,5 | 0,1 | 0,7 | 0,2 |
|
Max. leverage |
1:300 | 1:500 | 1:200 | 1:50 | 1:30 |
|
TradingView |
Yes | Yes | Yes | Yes | Yes |
|
Autochartist |
No | Yes | Yes | Yes | No |
|
Deposit fee, % |
No | No | No | No | No |
|
Max. Regulation Level |
Tier-1 | Tier-1 | Tier-1 | Tier-1 | Tier-1 |
|
Open an account |
Open an account Your capital is at risk. |
Open an account Your capital is at risk.
|
Open an account Your capital is at risk. |
Study review | Open an account Your capital is at risk. |
Use trend zones and volume spikes to trade trendlines better

Trading trendlines in Forex isn’t just about drawing straight lines — think about what other traders are doing. Draw wider trend zones instead of perfect lines to cover price wicks and avoid false breakouts. This shows where many traders might set stop losses, helping you place orders where the price is likely to bounce or reverse.
Another smart trick is to check trading volume when price touches a trendline. If volume is low, the bounce might not last. But if there’s a volume surge, it means serious buying or selling is happening. Use this as proof to avoid false breakouts and time your trades better.
Conclusion
Trading trendlines in Forex can be a powerful strategy when used correctly. By identifying key support and resistance levels, traders can make more informed decisions about entry and exit points. Combining trendlines with other tools like candlestick patterns, indicators, and proper risk management can further enhance accuracy and profitability. Mastering trendline trading requires practice and discipline, but with time, it can become a valuable part of your trading toolkit.
FAQs
What is a trendline?
It’s a line drawn through the highs in a downtrend or the lows in an uptrend.
What confirms the validity of a trendline?
A trendline is valid if the price touches it at least three times. When the price is rising, it touches an ascending support line. When the price falls, it touches a descending resistance line.
What is the most popular and reliable trendline trading strategy?
Opening positions with the trend on pullbacks to the trendline.
What is the riskiest trendline trading strategy?
It is to sell when the price is rising or to buy when the price is falling, counting on a pullback.
Related Articles
Team that worked on the article
Alamin Morshed is a contributor at Traders Union. He specializes in writing articles for businesses that want to improve their Google search rankings to compete with their competition. With expertise in search engine optimization (SEO) and content marketing, he ensures his work is both informative and impactful.
Chinmay Soni is a financial analyst with more than 5 years of experience in working with stocks, Forex, derivatives, and other assets. As a founder of a boutique research firm and an active researcher, he covers various industries and fields, providing insights backed by statistical data. He is also an educator in the field of finance and technology.
As an author for Traders Union, he contributes his deep analytical insights on various topics, taking into account various aspects.
Mirjan Hipolito is a journalist and news editor at Traders Union. She is an expert crypto writer with five years of experience in the financial markets. Her specialties are daily market news, price predictions, and Initial Coin Offerings (ICO).
Trend trading is a trading strategy where traders aim to profit from the directional movements of an asset's price over an extended period.
Bollinger Bands (BBands) are a technical analysis tool that consists of three lines: a middle moving average and two outer bands that are typically set at a standard deviation away from the moving average. These bands help traders visualize potential price volatility and identify overbought or oversold conditions in the market.
Forex leverage is a tool enabling traders to control larger positions with a relatively small amount of capital, amplifying potential profits and losses based on the chosen leverage ratio.
Risk management is a risk management model that involves controlling potential losses while maximizing profits. The main risk management tools are stop loss, take profit, calculation of position volume taking into account leverage and pip value.
Price action trading is a trading strategy that relies primarily on the analysis of historical price movements and patterns in financial markets, such as stocks, currencies, or commodities. Traders who use this approach focus on studying price charts, candlestick patterns, support and resistance levels, and other price-related data to make trading decisions.


-
 Afghanistan
-
 Albania
-
 Algeria
-
 Argentina
-
 Armenia
-
 Australia
-
 Austria
-
 Azerbaijan
-
 Bahamas
-
 Bahrain
-
 Bangladesh
-
 Belgium
-
 Botswana
-
 Brazil
-
 Brunei
-
 Bulgaria
-
 Burma
Burma
-
 Cambodia
-
 Cameroon
-
 Canada
-
 Chile
Chile
-
 China
China
-
 Colombia
-
 Costa Rica
-
 Cote d'Ivoire
-
 Croatia
-
 Cyprus
-
 Czech Republic
-
 Denmark
-
 Dominican Republic
-
 Ecuador
-
 Egypt
Egypt
-
 Estonia
-
 Eswatini
-
 Ethiopia
-
 Finland
-
 France
-
 Georgia
-
 Germany
-
 Ghana
Ghana
-
 Greece
-
 Haiti
Haiti
-
 Hong Kong
-
 Hungary
-
 India
India
-
 Indonesia
-
 Iran, Islamic republic
-
 Iraq
Iraq
-
 Ireland
-
 Israel
-
 Italy
Italy
-
 Jamaica
-
 Japan
Japan
-
 Jordan
-
 Kazakhstan
-
 Kenya
Kenya
-
 Korea
Korea
-
 Kuwait
-
 Kyrgyzstan
-
 Laos
Laos
-
 Latvia
-
 Lebanon
-
 Libyan Arab Jamahiriya
-
 Lithuania
-
 Luxembourg
-
 Macedonia
-
 Madagascar
-
 Malaysia
-
 Malta
Malta
-
 Mauritius
-
 Mexico
-
 Moldova
-
 Mongolia
-
 Montenegro
-
 Morocco
-
 Mozambique
-
 Namibia
-
 Nepal
Nepal
-
 Netherlands
-
 Nigeria
-
 Norway
-
 Oman
Oman
-
 Pakistan
-
 Palestine
-
 Papua New Guinea
-
 Peru
Peru
-
 Philippines
-
 Poland
-
 Portugal
-
 Puerto Rico
-
 Qatar
Qatar
-
 Romania
-
 Rwanda
-
 Saudi Arabia
-
 Serbia
-
 Singapore
-
 Slovakia
-
 Slovenia
-
 Somalia
-
 South Africa
-
 Spain
Spain
-
 Sri Lanka
-
 Sweden
-
 Switzerland
-
 Syrian Arab Republic
-
 Taiwan
-
 Tajikistan
-
 Tanzania, United Republic Of
-
 Thailand
-
 Trinidad and Tobago
-
 Tunisia
-
 Turkey
-
 UAE
UAE
-
 Uganda
-
 Ukraine
-
 United Kingdom
-
United States
-
 Uzbekistan
-
 Venezuela
-
 Vietnam
-
 Yemen
Yemen
-
 Zambia
-
 Zimbabwe
- Forex
- Crypto
