Using Economic Calendars for Forex Trading | Full Guide


Editorial Note: While we adhere to strict Editorial Integrity, this post may contain references to products from our partners. Here's an explanation for How We Make Money. None of the data and information on this webpage constitutes investment advice according to our Disclaimer.
To use economic for Forex trading, follow these simple steps:
Choose a reliable economic calendar provider.
Set up filters based on country, currency, and impact level.
Identify high-impact events such as GDP reports, CPI releases, and central bank meetings.
Analyze market expectations by comparing forecasted values with actual data.
Plan trades around events, deciding whether to trade before, during, or after high-volatility periods.
Economic calendars can help traders make better decisions, anticipate market movements, and manage their risk more effectively. This article will discuss different aspects of using economic calendars for Forex trading, offering insights and practical tips for both beginners and advanced traders.
Using economic calendars for Forex trading
What is an economic calendar?
An economic calendar is a tool that lists upcoming economic events and data releases that may impact financial markets. These events include GDP reports, employment data, inflation figures, and central bank meetings.
Economic calendars include:
Release times. When the data will be published.
Previous values. Data from the previous release.
Forecasted values. Market expectations for the upcoming data.
Actual values. Data released at the time of the event.
Impact indicators. Levels indicating the potential market impact (low, medium, high).
Step-by-step guide how to use economic calendar for Forex trading
Choosing a reliable economic calendar. Selecting a reliable economic calendar is the first step. Look for options that offer comprehensive data and user-friendly interfaces.
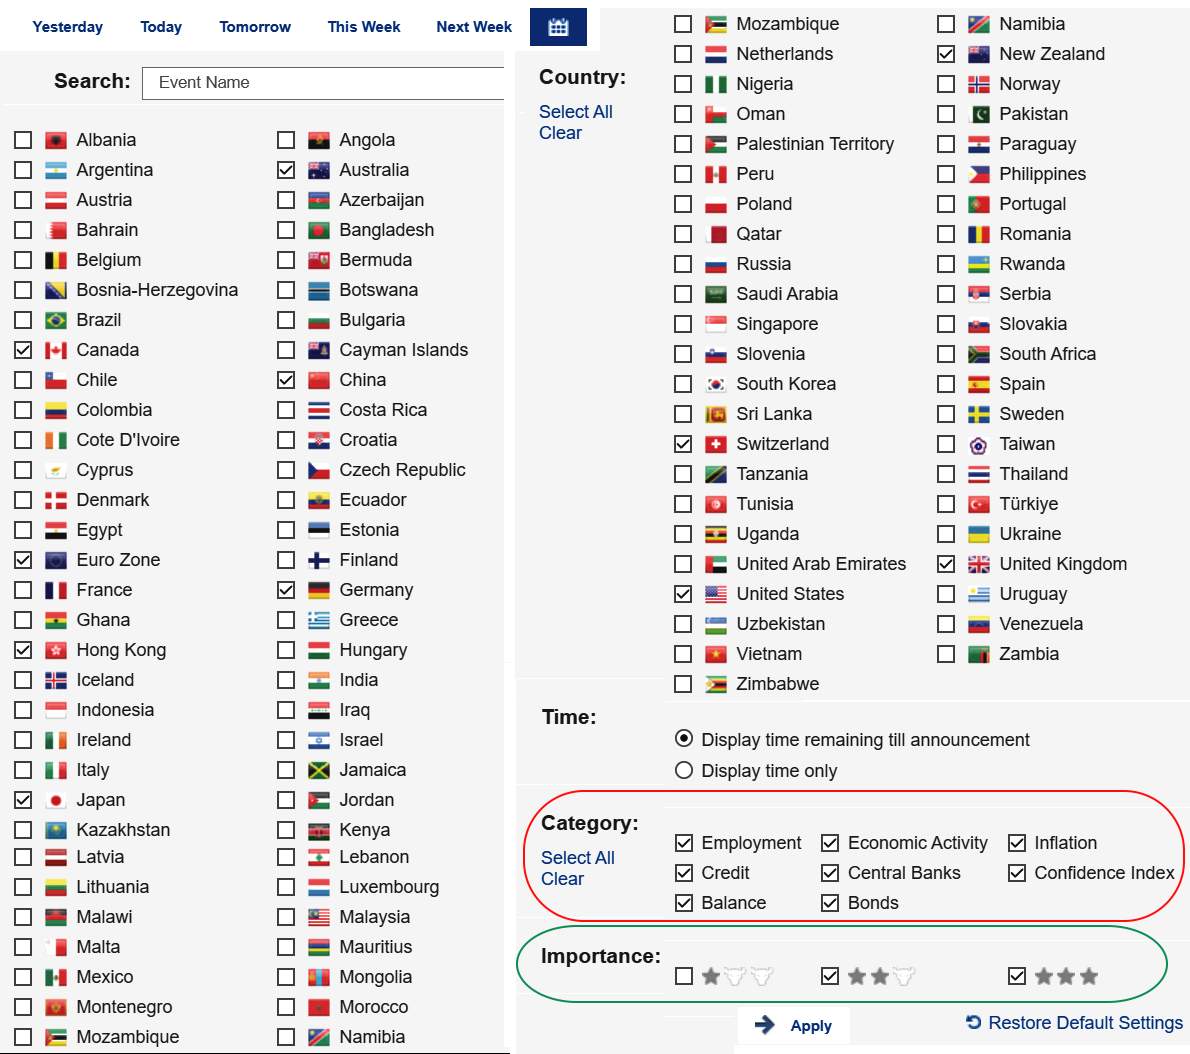
Setting up filters. Adjust the calendar to your needs by setting filters for country, currency, and impact level, so you focus on relevant events.
Identifying high-impact events. High-impact events, such as GDP reports, CPI releases, and central bank meetings, can cause significant market volatility. Understanding these events helps traders prepare and capitalize on market movements.
Analyzing market expectations. Forecasts are important for market reactions. By looking at predicted values and actual data, traders can understand market sentiment and possible movements.
Planning trades around events. It's important to plan trades around economic releases. Some traders avoid trading during volatile times, while others take advantage of big price moves.
Example scenarios. Consider a scenario where the U.S. Non-Farm Payroll (NFP) report is due. A higher-than-expected NFP can strengthen the USD, while a lower figure might weaken it. Knowing this, traders can plan their trades accordingly.

How to interpret calendar data
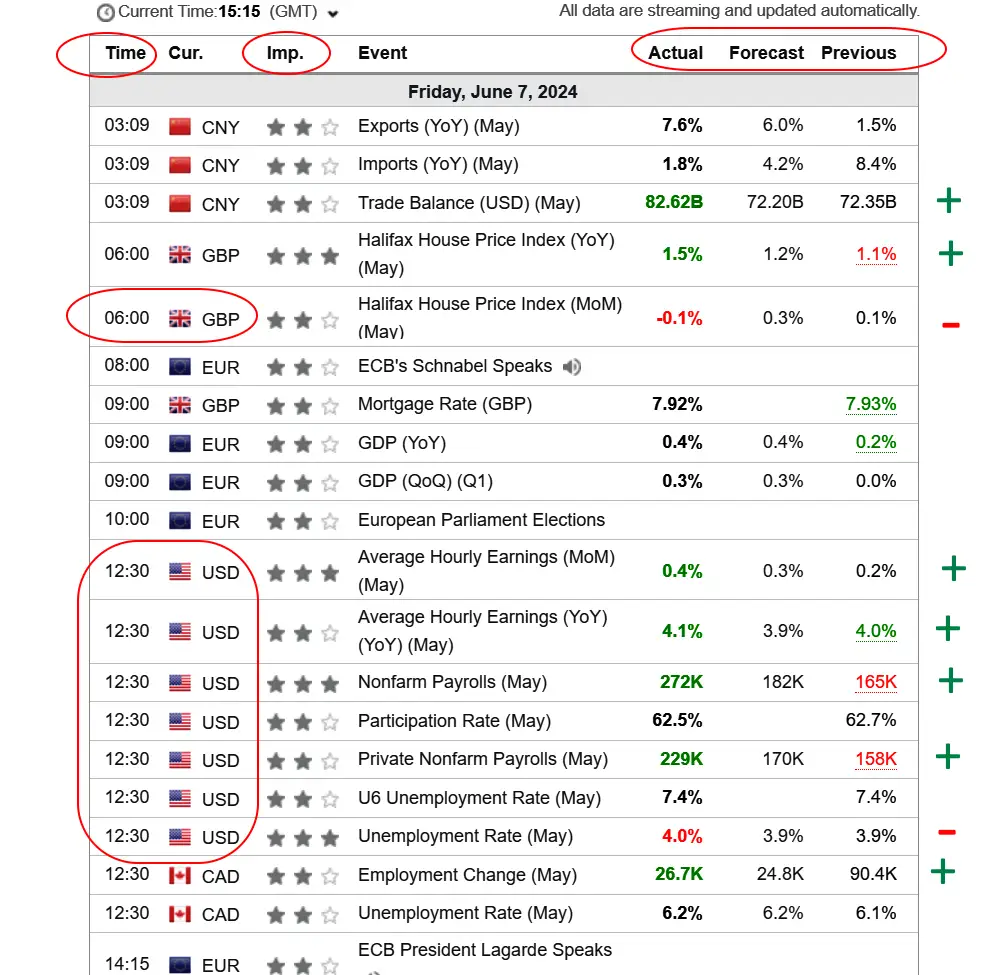
Reading the calendar. Understanding the layout and symbols of an economic calendar is the primary step. Key data points include previous, forecasted, and actual values, which help traders make informed decisions.
Assessing market impact. Assessing how past events affected the market can provide insights into potential future movements. Historical data and patterns help traders predict reactions to upcoming events.
Tools for tracking economic events
Popular economic calendars. Such tools offer comprehensive and user-friendly economic calendars.
Setting up alerts. Customizing alerts for specific events ensures traders stay informed about critical developments without constantly checking the calendar.
Key events to watch
By closely monitoring these key events and understanding their potential impacts, traders can develop strategies to take advantage of market movements and better manage their risk in the Forex.
Major economic indicators
Gross Domestic Product (GDP) measures the overall economic output of a country and is a critical indicator of economic health. It can significantly impact currency values. For example, if the U.S. releases a higher-than-expected GDP growth rate, the USD might strengthen as investors gain confidence in the U.S. economy.
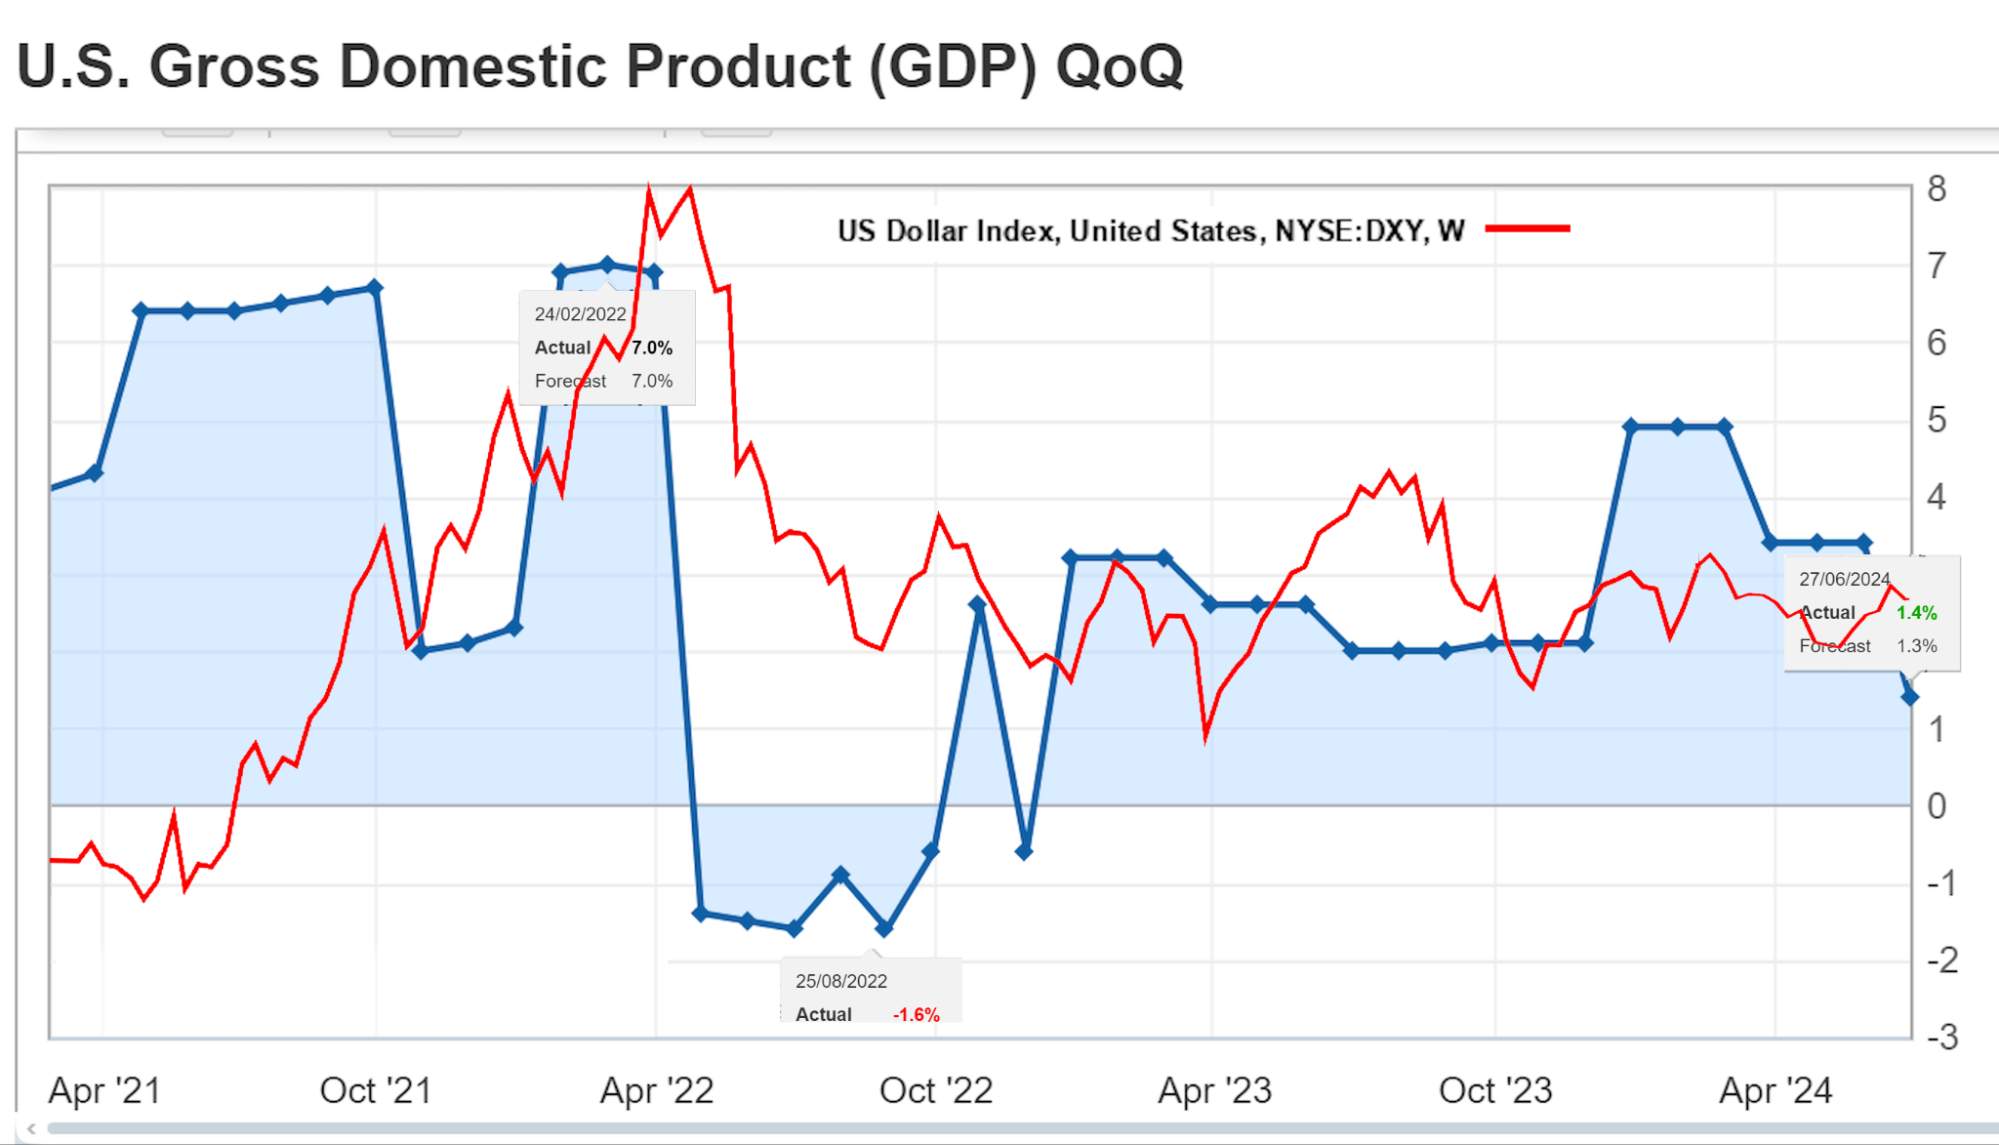
The reaction of the U.S. Dollar Index (DXY) to U.S. Gross Domestic Product (GDP) data usually depends on how closely the actual GDP data matches or deviates from market expectations.
Examples:
GDP Growth Above Expectations: For the period Q4 2020 - Q1 2021, U.S. GDP posted a record 33.1% year-over-year growth, which exceeded expectations. This led to a stronger dollar as the market anticipated a faster economic recovery and a possible tightening of monetary policy.
Slower GDP growth: In the first quarter of 2022, US GDP data showed a 1.4% decline in the first quarter, which was worse than forecasts. This weakened the dollar as investors revised their expectations for higher interest rates.
Steady recovery: U.S. GDP grew by 3.4% in the fourth quarter of 2023, which also exceeded forecasts. This helped strengthen the dollar as investors expected the Fed to continue tightening monetary policy to control inflation.
Consumer Price Index (CPI) measures inflation by tracking the changes in the price level of a basket of consumer goods and services. Central banks monitor CPI closely to adjust monetary policy, influencing currency values. Example:
2010-2013: CPI: Moderate inflation. DXY: Relative stability of the dollar index.
2014-2016: CPI: Moderate increase in inflation.DXY: Significant strengthening of the dollar. Correlation: Dollar strengthening may be related to expectations of higher interest rates in response to rising inflation and a strong U.S. economy.
2017-2020: CPI: Moderate fluctuations in inflation. DXY: Fluctuations in the dollar index with some decline in 2020. Correlation: Economic uncertainty and lower interest rates in response to the COVID-19 pandemic led to a weaker dollar.
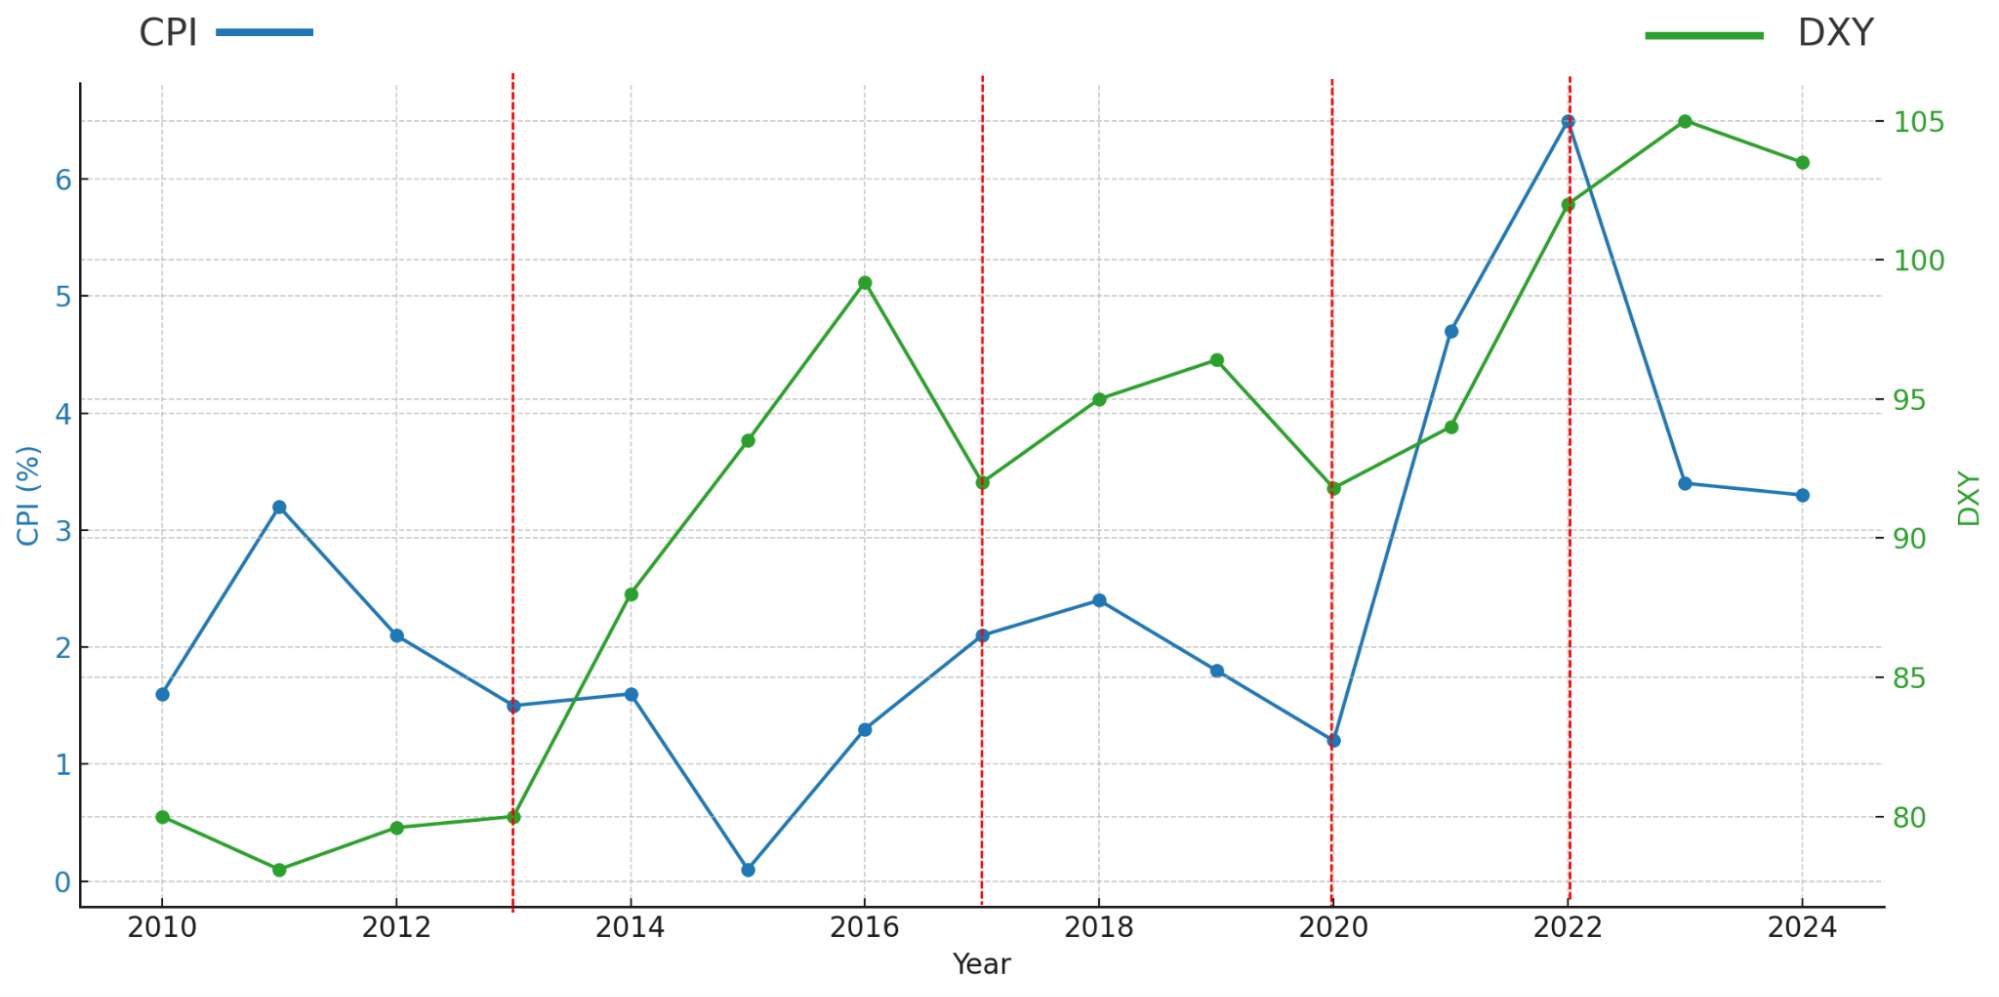
2021-2022: CPI: Significant increase in inflation. DXY: Dollar strengthening. Correlation:In response to high inflation, the Fed began raising interest rates, which strengthened the dollar.
2023-2024: CPI: Gradual decline in inflation. DXY: Slight decline in the dollar index after peaking in 2022. Correlation: Slowing inflation may signal a stabilizing economy and possible monetary policy easing, which weakens the dollar.
Producer Price Index (PPI) measures the average change in selling prices received by domestic producers for their output. It is an early indicator of consumer inflation, as producers often pass on higher costs to consumers. Example: In November 2021, China’s PPI increased by 13.5% year-over-year, the highest in 26 years. This surge indicated rising costs in the production sector, affecting global markets and leading to a temporary depreciation of the CNY due to inflationary concerns.
Non-Farm Payrolls (NFP) data reflects the number of jobs added or lost in the U.S. economy, excluding the farming sector. It is a crucial indicator of economic health and labor market conditions, often causing significant market volatility. Example: In July 2024, the U.S. NFP report showed an addition of 277,000 jobs, surpassing the forecast of 165,000. This positive surprise led to a sharp rise in the USD, as it suggested strong economic recovery and potential tightening of monetary policy.
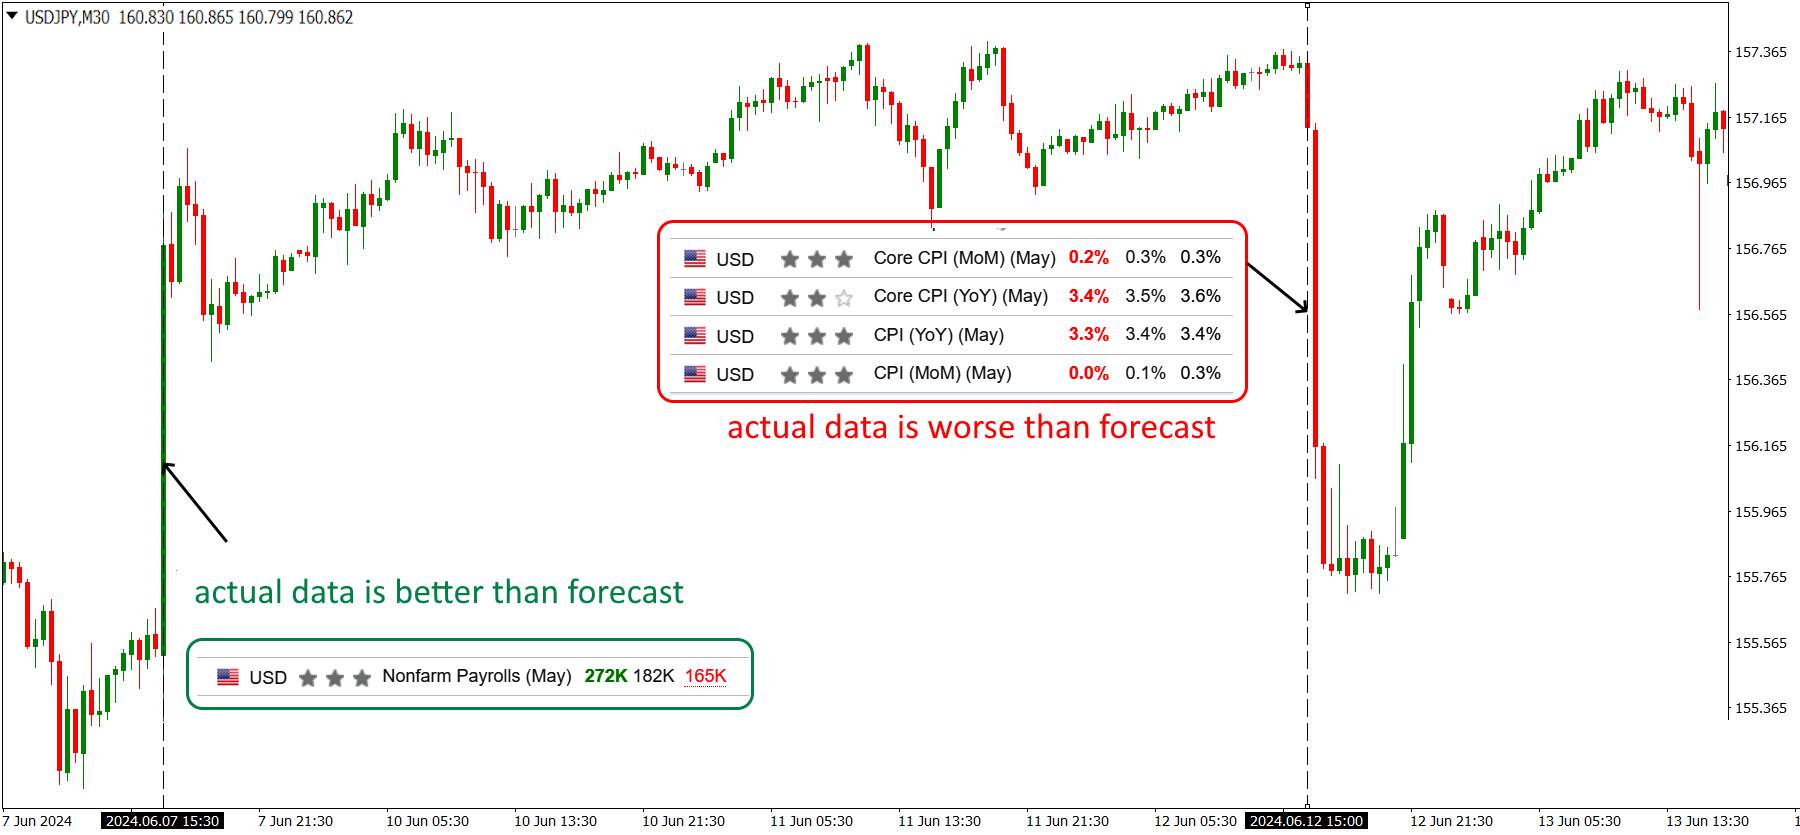
Some time later, the US inflation data was released, which turned out to be worse than forecast, and the USD/JPY pair showed an inverse reaction.
Central bank meetings, such as those held by the Federal Reserve, European Central Bank (ECB), and Bank of England (BoE), are also major events. Decisions on interest rates and monetary policy guidance can drastically affect currency values.
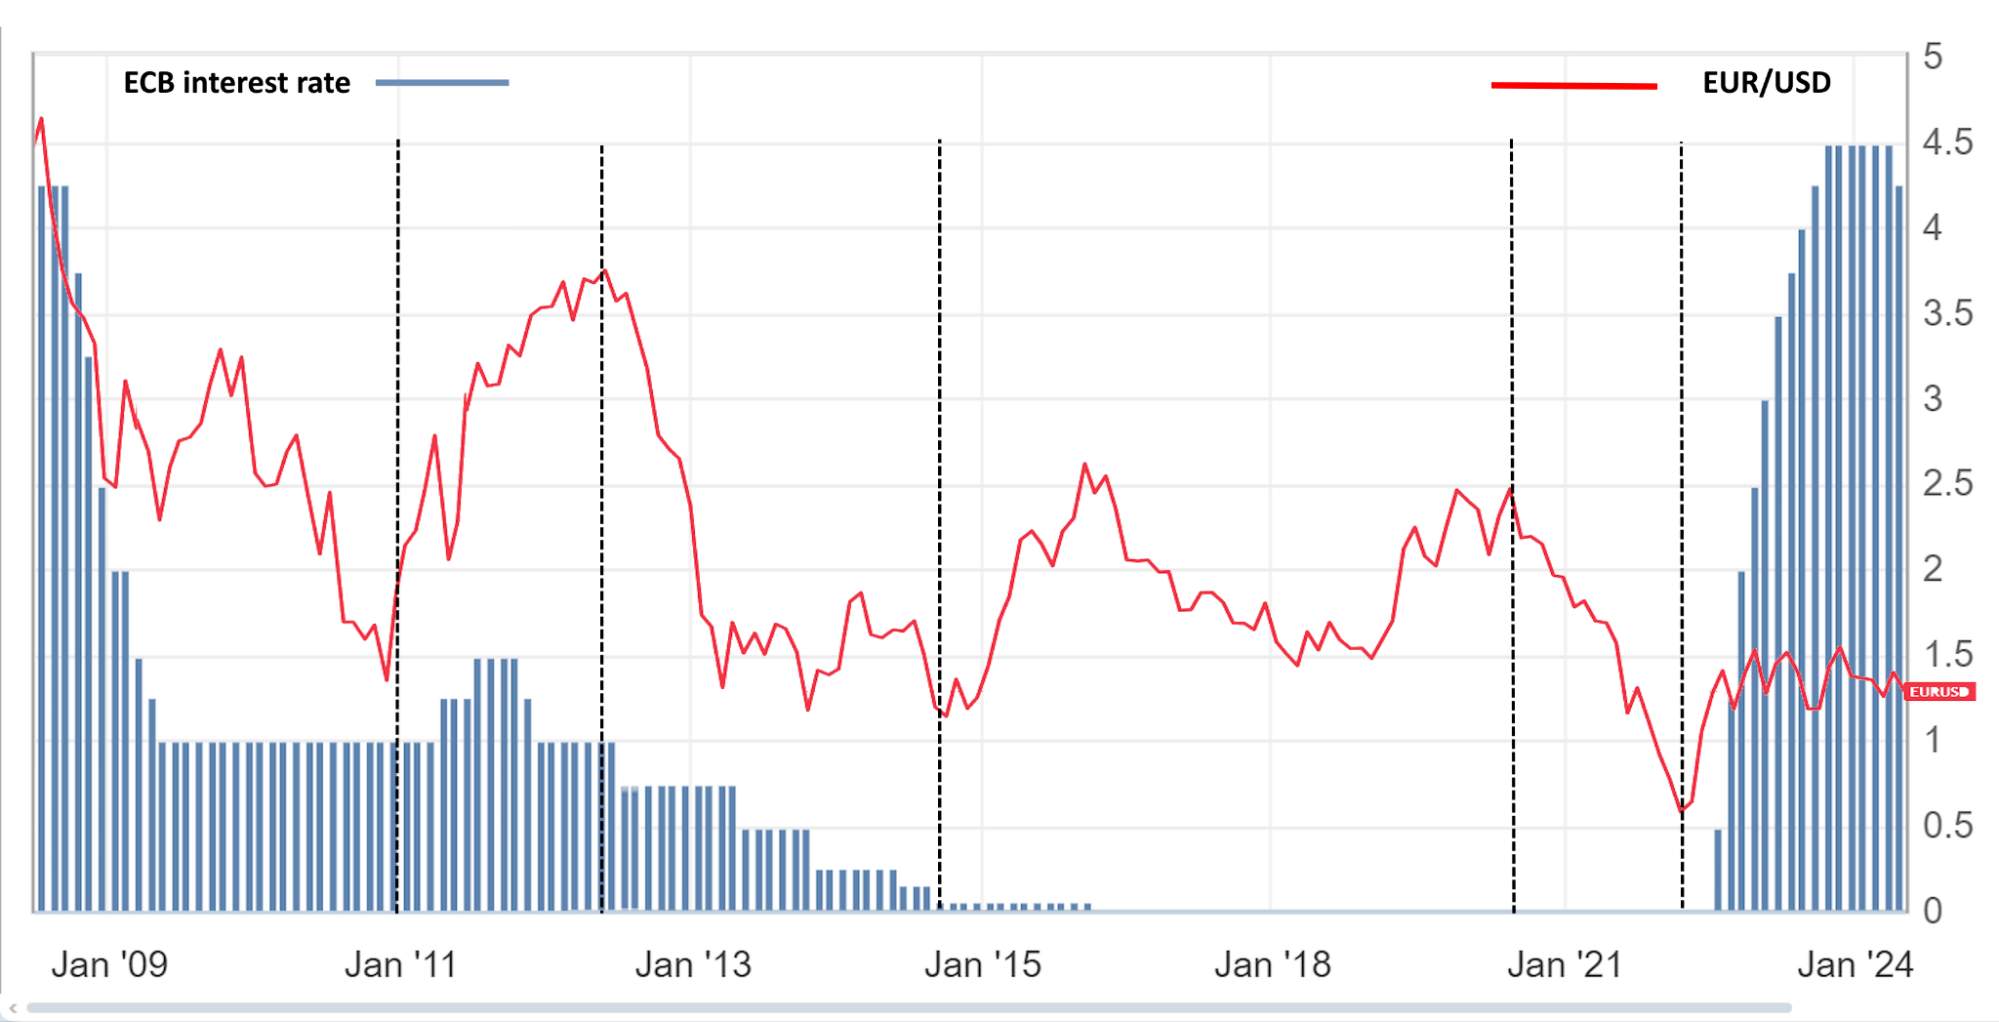
Example: ECB interest rates have a significant impact on the value of the euro. Higher rates make the euro more attractive to investors, which can lead to its appreciation.
2010-2014: The ECB kept rates low due to the effects of the 2008 financial crisis and the sovereign debt crisis in the Eurozone. EUR/USD was relatively volatile, with a downward trend until 2014 due to the weak eurozone economy.
2015-2019: In 2015, the ECB began its QE program and continued to cut rates. EUR/USD fell to 1.05 in 2015, reflecting the weakening of the euro due to the ECB's stimulus measures.
2015-2019: In 2015, the ECB began its QE program and continued to cut rates. EUR/USD fell to 1.05 in 2015, reflecting the weakening of the euro due to the ECB's stimulus measures.
2020-2021: The COVID-19 pandemic led to further rate cuts and ECB stimulus measures. EUR/USD fluctuated in response to global economic conditions, peaking around 1.23 in early 2021.
2022-2023: In response to high inflation, the ECB began raising rates, leading to a stronger euro. EUR/USD varied, peaking around 1.05 in 2022 and strengthening in 2023.
2023: The ECB raises rates several times to cope with inflation. In June 2023, the refinancing rate reached 4.00%, helping to strengthen the euro.
2024: Rates continued to rise in 2024, but fluctuations in the euro were small. In June 2024, the refinancing rate was at 4.50%, which helped keep the euro at around 1.09 against the dollar.
Impact of specific events
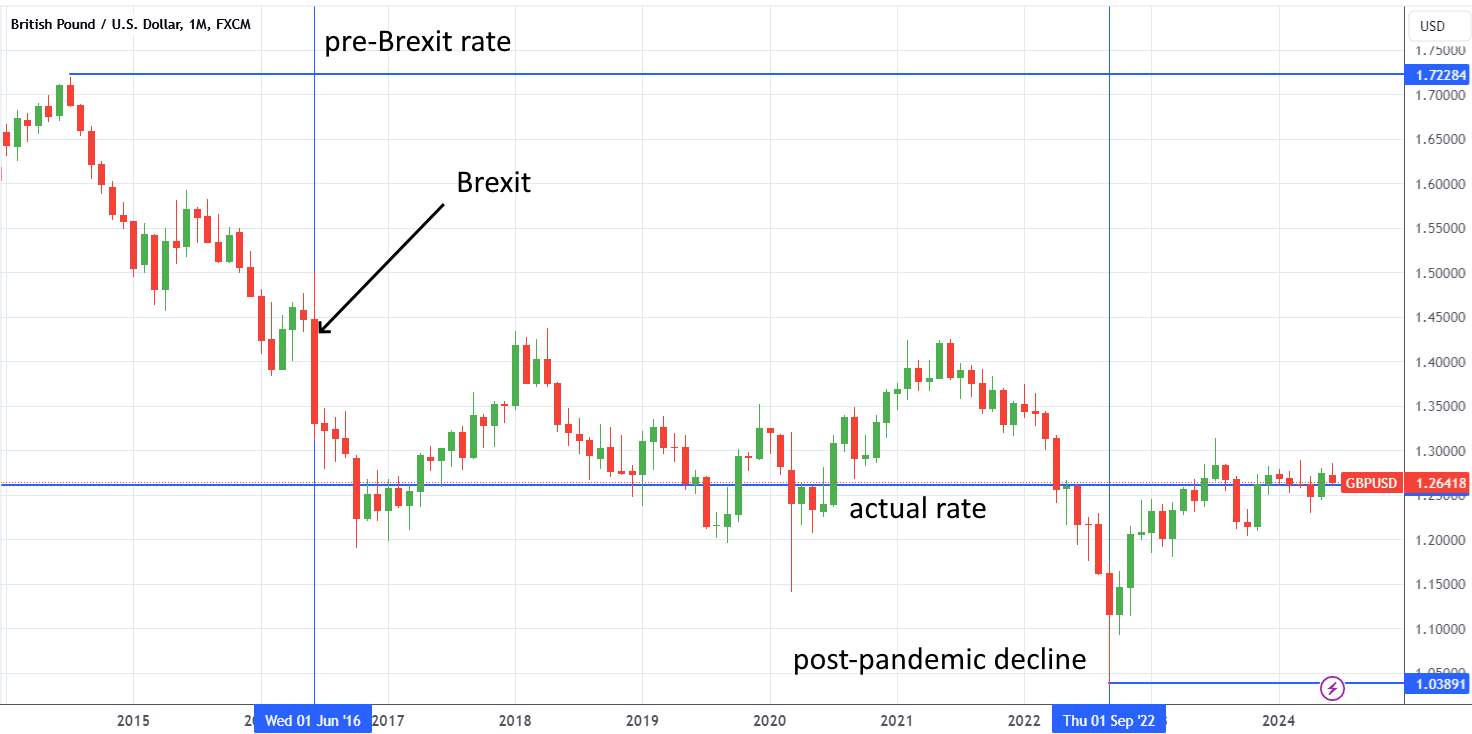
Brexit Referendum (June 2016). The unexpected result of the Brexit referendum, where the UK voted to leave the European Union, caused significant turmoil in the financial markets. The GBP/USD pair plummeted from around 1.50 to 1.32 within hours of the announcement, reflecting investor uncertainty and fears of economic instability.
Before Brexit, the GBP/USD exchange rate held steady at $1.50-1.72, but after the decision to leave the EU, the exchange rate dropped to $1.25-1.17, and never got out of this range.
WTI oil price reaction to the military conflict in Israel (October 7, 2023):
Israel is in a strategically important region where any military action could raise concerns about disruptions to oil supplies through key logistical routes such as the Suez Canal.
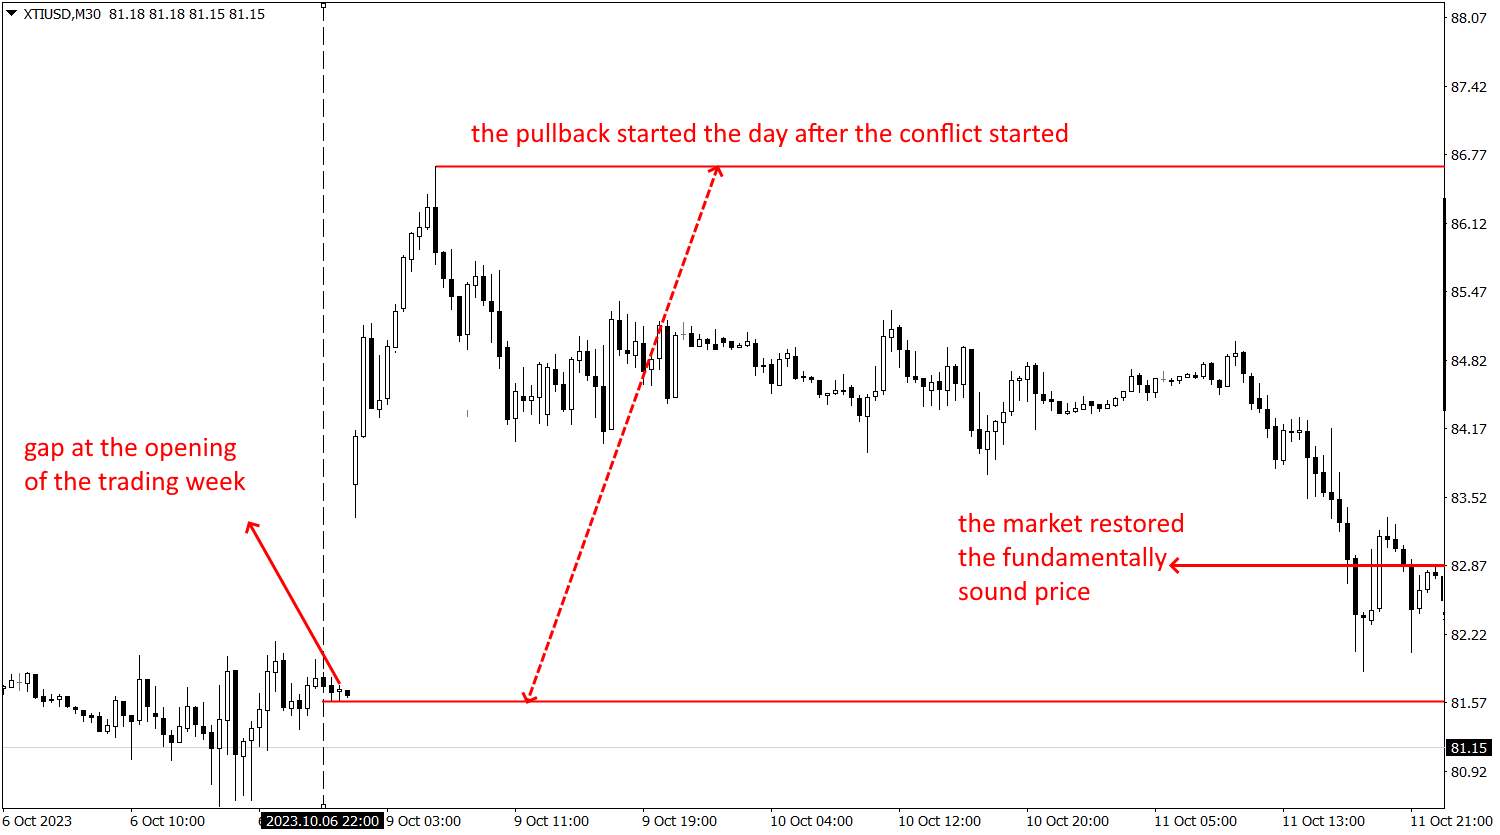
On the first day after the attack, the price of WTI rose more than $5 (to $87) per barrel. In the following days, the market managed to close the gap, but as the conflict progressed, the price went back up and reached $91-92 per barrel as early as November 2023. At the beginning of 2024, the price of WTI oil fluctuated within $87-90 per barrel, i.e. the speculative factor of the conflict start was fully worked out by the market in about three months
Pros and cons of using economic calendars for Forex trading
- Advantages
- Disadvantages
- Keeps traders informed. Economic calendars provide up-to-date information on upcoming economic events, helping traders stay aware of significant market-moving events.
- Incorporating calendar events into trading plans. By knowing the schedule of economic events, traders can strategically plan their trades around these events, taking advantage of potential market movements.
- Aids in risk management. Traders can use economic calendars to set stop-loss and take-profit orders around significant events, helping to manage and mitigate risk.
- Improves market understanding. Regularly following economic calendars helps traders develop a deeper understanding of how economic events affect currency markets.
- Enhances trading strategy. Combining economic calendar data with technical analysis can lead to more comprehensive and effective trading strategies.
- Over-reliance on forecasts. Traders may rely too heavily on forecasts and predictions, which can sometimes be inaccurate, leading to poor trading decisions.
- Potential for overtrading. Frequent trading based on numerous economic events can lead to overtrading, which can increase transaction costs and reduce overall profitability.
- Market volatility. Economic events can cause sudden and extreme market volatility, which can be challenging to manage and may lead to significant losses if not properly handled.
- Misinterpretation of data. There is a risk of misinterpreting the significance of certain events or data releases, leading to incorrect trading actions.
- Emotional trading. Reacting to economic events without a clear strategy can lead to emotional trading decisions, which are often less rational and more prone to error.
Risk management
Effective risk management is crucial when trading around economic events. This involves setting stop-loss and take-profit orders to protect against unexpected market movements.
For beginners: It's advisable to avoid trading during high-impact events due to the high risk of volatility. Instead, beginners can use this time to observe how the market reacts to different economic data releases and learn from these movements.
For experienced Traders: Experienced traders can exploit the volatility around economic events by using strategies such as straddle trades, where they place both a buy and sell order around a significant price level, capitalizing on whichever direction the market moves.
Economic calendars are no less than game-changers

As someone who has been trading Forex for many years, I can't stress enough the importance of using economic calendars in your trading strategy. Over the years, I've seen countless traders make avoidable mistakes simply because they weren't aware of critical economic events that could significantly impact the market.
In my experience, the best approach is to integrate economic calendar data with your technical analysis. This combined strategy provides a more comprehensive view of the market, allowing you to make decisions based on both historical data and upcoming economic events. For example, if technical indicators suggest a bullish trend but there's an impending economic report that could disrupt this trend, you might decide to hold off on entering a trade until after the report is released.
Keep yourself updated, plan your trades around important events, and always be mindful of risk. With time and practice, you'll see that these tips not only help you understand market changes but also boost your confidence in making better trading decisions.
Conclusion
Economic calendar is a must for Forex trading. It lists key economic events like GDP reports, employment data, and central bank meetings, which can impact currency markets. By learning how to read and use these calendars, traders can predict market changes, plan trades, and manage risks better.
This article explained the basics of economic calendars, gave a step-by-step guide on using them, and shared tips for both beginners and advanced traders. Key points include choosing a good calendar, setting filters, spotting important events, and using calendar data with other trading tools.
FAQs
How do I choose the best economic calendar for my trading needs?
Look for economic calendars from well-established financial websites and judge them based on their reliability, comprehensive data, and ease of use.
What should I focus on in an economic calendar to improve my trading?
Focus on high-impact events such as GDP reports, CPI releases, Non-Farm Payrolls (NFP), and central bank meetings. These events typically cause significant market movements and present trading opportunities.
How can I set up alerts for important economic events?
To set up alerts for important economic events, use an economic calendar platform and configure filters for key events. Make sure to enable notifications for those events to remain alert.
How do I interpret the data on an economic calendar effectively?
Try to compare the forecasted values with the actual data released. A mismatch between the two generally leads to heightened market volatility on either side.
Related Articles
Team that worked on the article
Chinmay Soni is a financial analyst with more than 5 years of experience in working with stocks, Forex, derivatives, and other assets. As a founder of a boutique research firm and an active researcher, he covers various industries and fields, providing insights backed by statistical data. He is also an educator in the field of finance and technology.
As an author for Traders Union, he contributes his deep analytical insights on various topics, taking into account various aspects.
Dr. BJ Johnson is a PhD in English Language and an editor with over 15 years of experience. He earned his degree in English Language in the U.S and the UK. In 2020, Dr. Johnson joined the Traders Union team. Since then, he has created over 100 exclusive articles and edited over 300 articles of other authors.
Mirjan Hipolito is a journalist and news editor at Traders Union. She is an expert crypto writer with five years of experience in the financial markets. Her specialties are daily market news, price predictions, and Initial Coin Offerings (ICO).
Economic indicators — a tool of fundamental analysis that allows to assess the state of an economic entity or the economy as a whole, as well as to make a forecast. These include: GDP, discount rates, inflation data, unemployment statistics, industrial production data, consumer price indices, etc.
Cryptocurrency is a type of digital or virtual currency that relies on cryptography for security. Unlike traditional currencies issued by governments (fiat currencies), cryptocurrencies operate on decentralized networks, typically based on blockchain technology.
Risk management in Forex involves strategies and techniques used by traders to minimize potential losses while trading currencies, such as setting stop-loss orders and position sizing, to protect their capital from adverse market movements.
A Forex trading scam refers to any fraudulent or deceptive activity in the foreign exchange (Forex) market, where individuals or entities engage in unethical practices to defraud traders or investors.
Risk management is a risk management model that involves controlling potential losses while maximizing profits. The main risk management tools are stop loss, take profit, calculation of position volume taking into account leverage and pip value.

-
 Afghanistan
-
 Albania
-
 Algeria
-
 Argentina
-
 Armenia
-
 Australia
-
 Austria
-
 Azerbaijan
-
 Bahamas
-
 Bahrain
-
 Bangladesh
-
 Belgium
-
 Botswana
-
 Brazil
-
 Brunei
-
 Bulgaria
-
 Burma
Burma
-
 Cambodia
-
 Cameroon
-
 Canada
-
 Chile
Chile
-
 China
China
-
 Colombia
-
 Costa Rica
-
 Cote d'Ivoire
-
 Croatia
-
 Cyprus
-
 Czech Republic
-
 Denmark
-
 Dominican Republic
-
 Ecuador
-
 Egypt
Egypt
-
 Estonia
-
 Eswatini
-
 Ethiopia
-
 Finland
-
 France
-
 Georgia
-
 Germany
-
 Ghana
Ghana
-
 Greece
-
 Haiti
Haiti
-
 Hong Kong
-
 Hungary
-
 India
India
-
 Indonesia
-
 Iran, Islamic republic
-
 Iraq
Iraq
-
 Ireland
-
 Israel
-
 Italy
Italy
-
 Jamaica
-
 Japan
Japan
-
 Jordan
-
 Kazakhstan
-
 Kenya
Kenya
-
 Korea
Korea
-
 Kuwait
-
 Kyrgyzstan
-
 Laos
Laos
-
 Latvia
-
 Lebanon
-
 Libyan Arab Jamahiriya
-
 Lithuania
-
 Luxembourg
-
 Macedonia
-
 Madagascar
-
 Malaysia
-
 Malta
Malta
-
 Mauritius
-
 Mexico
-
 Moldova
-
 Mongolia
-
 Montenegro
-
 Morocco
-
 Mozambique
-
 Namibia
-
 Nepal
Nepal
-
 Netherlands
-
 Nigeria
-
 Norway
-
 Oman
Oman
-
 Pakistan
-
 Palestine
-
 Papua New Guinea
-
 Peru
Peru
-
 Philippines
-
 Poland
-
 Portugal
-
 Puerto Rico
-
 Qatar
Qatar
-
 Romania
-
 Rwanda
-
 Saudi Arabia
-
 Serbia
-
 Singapore
-
 Slovakia
-
 Slovenia
-
 Somalia
-
 South Africa
-
 Spain
Spain
-
 Sri Lanka
-
 Sweden
-
 Switzerland
-
 Syrian Arab Republic
-
 Taiwan
-
 Tajikistan
-
 Tanzania, United Republic Of
-
 Thailand
-
 Trinidad and Tobago
-
 Tunisia
-
 Turkey
-
 UAE
UAE
-
 Uganda
-
 Ukraine
-
 United Kingdom
-
United States
-
 Uzbekistan
-
 Venezuela
-
 Vietnam
-
 Yemen
Yemen
-
 Zambia
-
 Zimbabwe
- Forex
- Crypto

