10 Best Mutual Funds Of 2026

Best mutual fund broker - eOption
The top 10 mutual funds for smart portfolio are:
-
Gateway Fund A (GATEX) – Option collar strategy for reduced volatility
-
Boston Trust Walden Small Cap Fund (BOSOX) – High growth potential in small-cap companies.
-
Fidelity Cash Fund (FCASH) – Safety, liquidity, and consistent returns.
-
Hartford Core Equity Fund (HGIYX) – Strong historical performance, large-cap focus
-
DFA U.S. Micro Cap Portfolio (DFSCX) – High growth potential in micro-cap stocks
-
Schwab S&P 500 Index Fund (SWPPX) – Low-cost, passive S&P 500 tracking
-
Vanguard International Growth Fund (VWIGX) – Global growth exposure, focus on emerging markets
-
Fidelity Investment Grade Bond Fund (FBNDX) – Conservative, income generation, and hedging
-
Dodge & Cox Income Fund (DODIX) – Proven track record, low expense ratio
-
Leuthold Core Investment Fund Adv (LCORX) – Dynamic asset allocation, bear equity allocation
In this article, TU experts delve into strategic investment considerations for 2026, discussing a range of mutual funds tailored for diverse investor goals. The focus is on funds employing, micro-cap opportunities, low-cost index tracking, global growth exposure, and balanced bond investments. Experts analyze each fund's historical performance, management approach, and portfolio composition, offering insights into potential benefits and risks. The article also features tips for constructing a successful portfolio, taking into account factors like volatility, growth potential, and capital preservation in the current economic landscape.
-
What are the potential benefits of investing in funds focusing on large-cap companies?
Funds with a large-cap focus provide stability, lower volatility, and a level of protection during economic downturns, making them suitable for investors seeking resilience.
-
How do micro-cap stocks contribute to a smart investment portfolio?
Micro-cap stocks offer high growth potential, diversification, and a passive management strategy, making them a consideration for investors aiming for significant returns.
-
What advantages do low-cost index funds bring to a portfolio?
Low-cost index funds, such as S&P 500 trackers, offer simplicity, diversification, and historically strong performance, making them attractive for long-term investors.
-
Why consider international growth funds in a smart portfolio?
International growth funds provide exposure to global markets, diversification, and potential opportunities in emerging economies, enhancing overall portfolio growth.
Top 10 mutual funds for smart portfolio
| Fund Name | AUM ($ Billion)* | Expense Ratio |
|---|---|---|
Gateway Fund A (GATEX) |
11.04 |
0.45% |
Boston Trust Walden Small Cap Fund (BOSOX) |
5.72 |
0.72% |
Fidelity Cash Fund (FCASH) |
72.58 |
0.04% |
Hartford Core Equity Fund (HGIYX) |
12.8 |
0.66% |
DFA U.S. Micro Cap Portfolio (DFSCX) |
5.98 |
0.65% |
Schwab S&P 500 Index Fund (SWPPX) |
86.02 |
0.02% |
Vanguard International Growth Fund (VWIGX) |
102.56 |
0.34% |
Fidelity Investment Grade Bond Fund (FBNDX) |
81.07 |
0.57% |
Dodge & Cox Income Fund (DODIX) |
64.21 |
0.57% |
Leuthold Core Investment Fund Adv (LCORX) |
14.38 |
0.76% |
Assets Under Management as of January, 2024.
Gateway Fund A (GATEX)

Return simulation for GATEX
Investing in Gateway Fund A (GATEX) in 2026 offers several strategic advantages for investors seeking global growth exposure with a value-oriented approach. Here's a breakdown of why it might be a considerable choice:
Focus on Undervalued Growth
Historical performance for GATEX
GATEX strategically targets non-U.S. companies with high growth potential that may be undervalued by the market.
Value Investing Approach
The fund employs a rigorous research process to select companies with strong fundamentals, healthy cash flow, and attractive valuations.
Global Diversification
GATEX goes beyond the U.S. market, providing exposure to promising companies across various regions and sectors globally. This diversification strategy enhances the potential for sustained growth while reducing dependence on the performance of a single market.
Investment Strategy
GATEX's strategy involves investing in a diversified portfolio of stocks tracking the S&P 500. Additionally, it employs an "option collar" strategy, selling index call options and buying index put options. This dual strategy is designed to reduce fund volatility and generate cash flow.
Top 10 holdings
| Rank | Company Name | Stock Ticker | Percentage of Assets |
|---|---|---|---|
1 |
Apple, Inc. |
AAPL |
7.50% |
2 |
Microsoft Corp. |
MSFT |
7.50% |
3 |
Amazon.com, Inc. |
AMZN |
3.60% |
4 |
NVIDIA Corp. |
NVDA |
3.10% |
5 |
Alphabet, Inc., Class C |
GOOG |
3.00% |
6 |
Berkshire Hathaway, Inc., Class B |
BRK.B |
2.20% |
7 |
Meta Platforms, Inc., Class A |
META |
1.90% |
8 |
Tesla, Inc. |
TSLA |
1.80% |
9 |
UnitedHealth Group, Inc. |
UNH |
1.60% |
10 |
JPMorgan Chase & Co. |
JPM |
1.40% |
Boston Trust Walden Small Cap Fund (BOSOX)
Investing in Boston Trust Walden Small Cap Fund (BOSOX) for 2026 can be a strategic choice for several reasons:
Portfolio Diversification
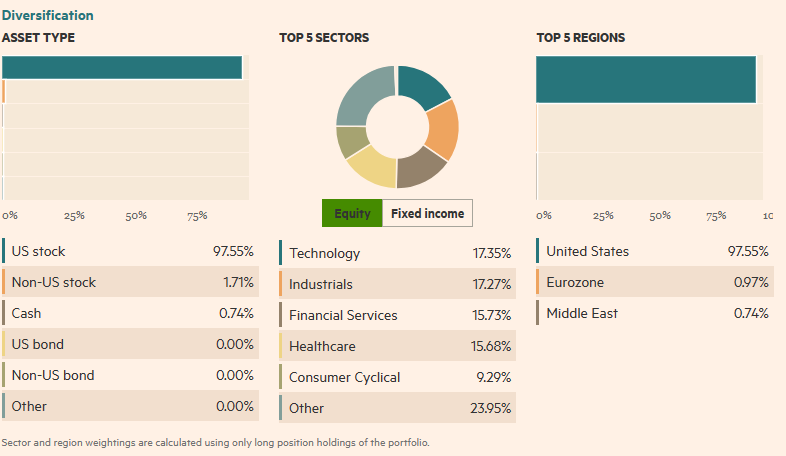
Diversification metrics for BOSOX
Investing in small caps enhances portfolio diversification, reducing dependence on large-cap companies and minimizing exposure to a single market segment. This can help spread risk and enhance overall stability.
Strong Track Record
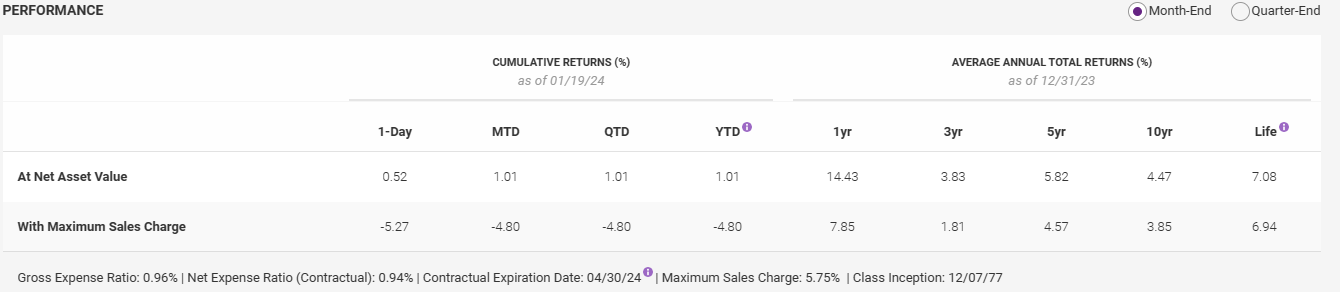
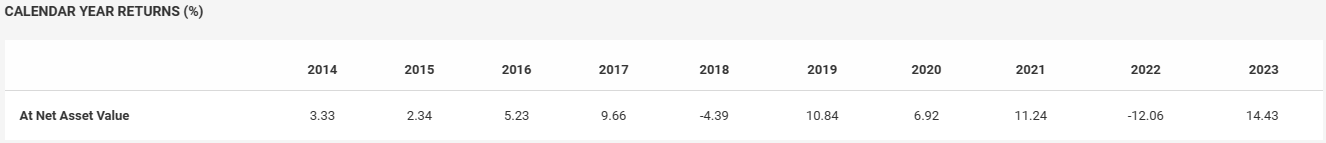
BOSOX has historically outperformed its benchmark, the Russell 2000 Index, showcasing its ability to deliver competitive returns over various market cycles.
ESG Focus
For sustainability-focused investors, BOSOX holds a Morningstar Sustainability Rating of 5 globes, indicating low ESG risk relative to peers in the Morningstar US Equity Small Cap category. This reflects the fund's consideration of environmental, social, and governance factors.
Recent Performance
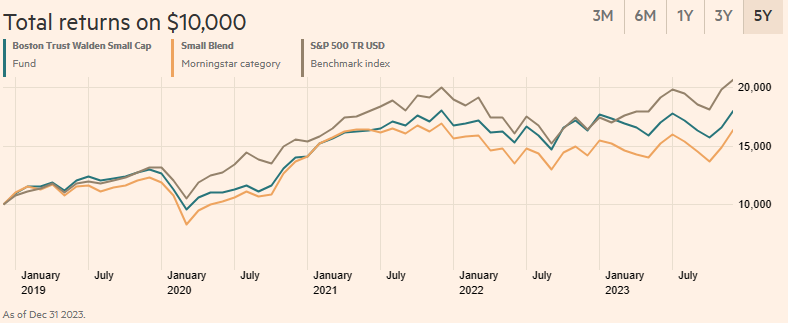
Return simulation for BOSOX
Despite a slightly lower return in 2023 (7.89%) compared to its benchmark (10.07%), BOSOX remains positioned for potential growth, with the underperformance attributed to challenges faced by specific industries within the small-cap space.
Top 10 holdings
| Company Name | Stock Ticker | Portfolio Weight |
|---|---|---|
Chemed Corp |
CHE |
2.36% |
Selective Insurance Group Inc |
SIGI |
2.24% |
Cactus Inc |
WHD |
2.23% |
Haemonetics Corp |
HAE |
2.20% |
Sprouts Farmers Market Inc |
SFM |
2.20% |
Helmerich and Payne Inc |
HP |
2.17% |
Aptargroup Inc |
ATR |
2.13% |
Applied Industrial Technologies Inc |
AIT |
2.10% |
Medpace Holdings Inc |
MEDP |
2.10% |
Power Integrations Inc |
POWI |
2.03% |
Fidelity Cash Fund (FCASH)
Experts prefer Fidelity Cash Fund (FCASH) for investment in 2026 for several reasons:
Safety and Capital Preservation
FCASH prioritizes the preservation of capital, making it a secure option during market uncertainties. Its conservative management strategy aims to safeguard your investment with minimal risk to your capital.
Dividend Income
Despite the small yield, FCASH offers regular dividends based on the interest earned on its holdings. This provides a steady income stream, making it attractive for investors seeking reliable cash flow.
Diversification Benefits
Including FCASH in your portfolio enhances diversification by introducing a low-risk, low-return asset. This balanced approach helps reduce overall portfolio risk, providing a counterbalance to potential volatility in other parts of your investment portfolio.
Fidelity's Expertise
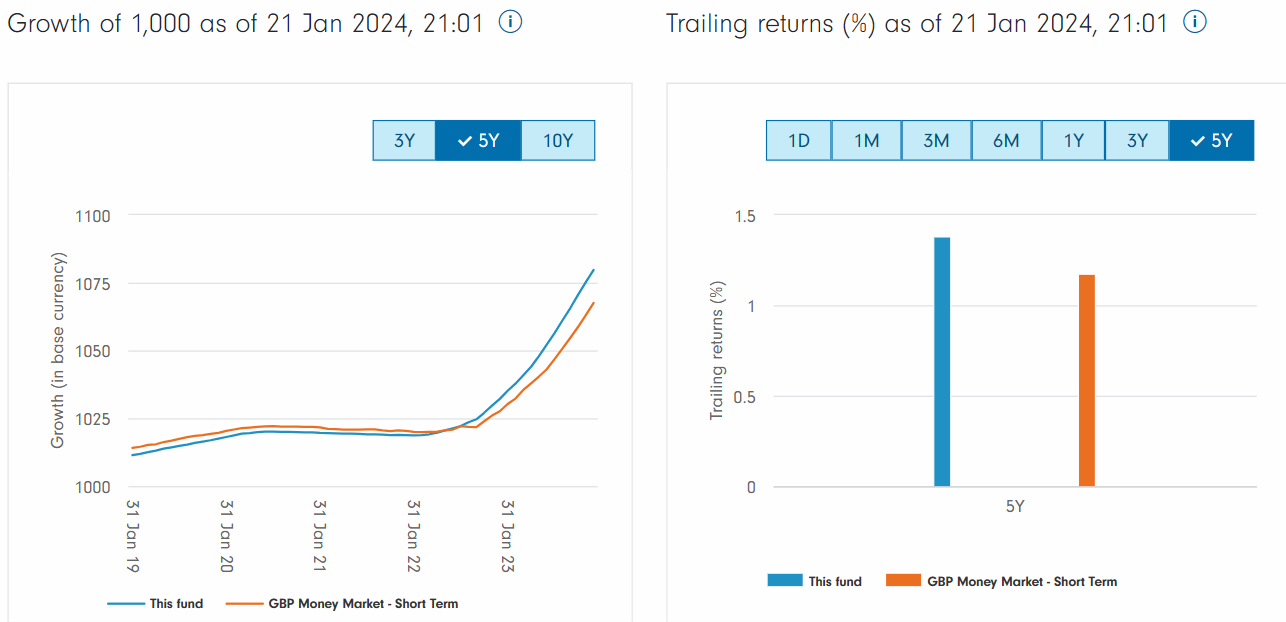
Return simulation for FCASH
Investors can benefit from Fidelity's extensive experience in managing money market investment strategies and their robust credit research process. Fidelity's expertise adds an additional layer of confidence for investors looking for a well-managed and secure investment option.
Top 10 holdings
| Security Name | Country | % of Assets |
|---|---|---|
SUMITOMO MITSUI TRUST BANK LTD TD 5.15% |
Japan |
7.13 |
DZ BANK AG DEUT ZENT GENOSBANK TD 5.14% |
Germany |
7.13 |
LANDESBANK HESS-THURNGN(UNGTD) TD 5.19% |
Germany |
7.13 |
MIZUHO CORPOR BK LIMITED LONDON BRH TD 5.18% |
United Kingdom |
3.6 |
Nationwide Building Society 5.18% |
United Kingdom |
3.57 |
SG Issuer S.A. 0% |
Luxembourg |
2.6 |
Jyske Bank A/S 5.37% |
Denmark |
2.14 |
Mizuho Bank, Ltd. London Branch 0% |
Japan |
2.13 |
Paccar Financial Europe BV 5.3% |
United States |
2.12 |
Mitsubishi Corporation Finance PLC 5.5% |
United Kingdom |
2.12 |
Hartford Core Equity Fund (HGIYX)
Hartford Core Equity Fund (HGIYX) offers capital growth with a focus on large-cap blend mutual funds. Here are several reasons why experts love this fund:
Strong Historical Performance
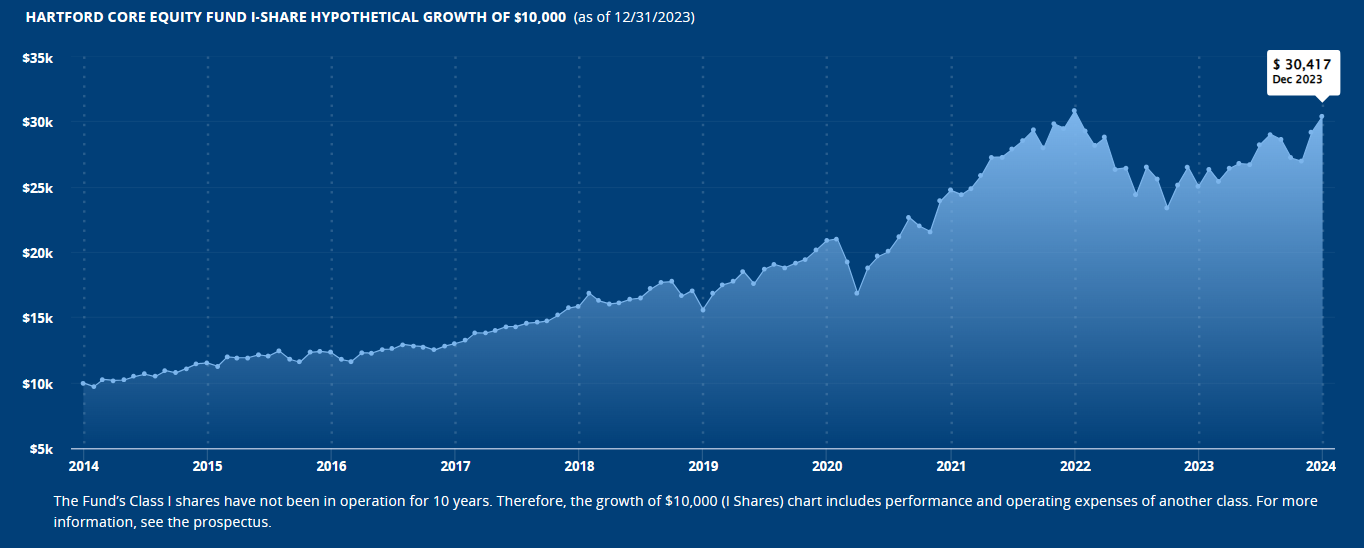
Performance of HGIYX over the past decade
Over the past decade, HGIYX has consistently outperformed the S&P 500, delivering an average annual return of 11.15% compared to the S&P 500's 9.51%. This indicates the fund's ability to select stocks with growth potential.
| Performance Metric | HGIYX | S&P 500 |
|---|---|---|
10-Year Return |
11.15% |
9.51% |
Large-Cap Allocation
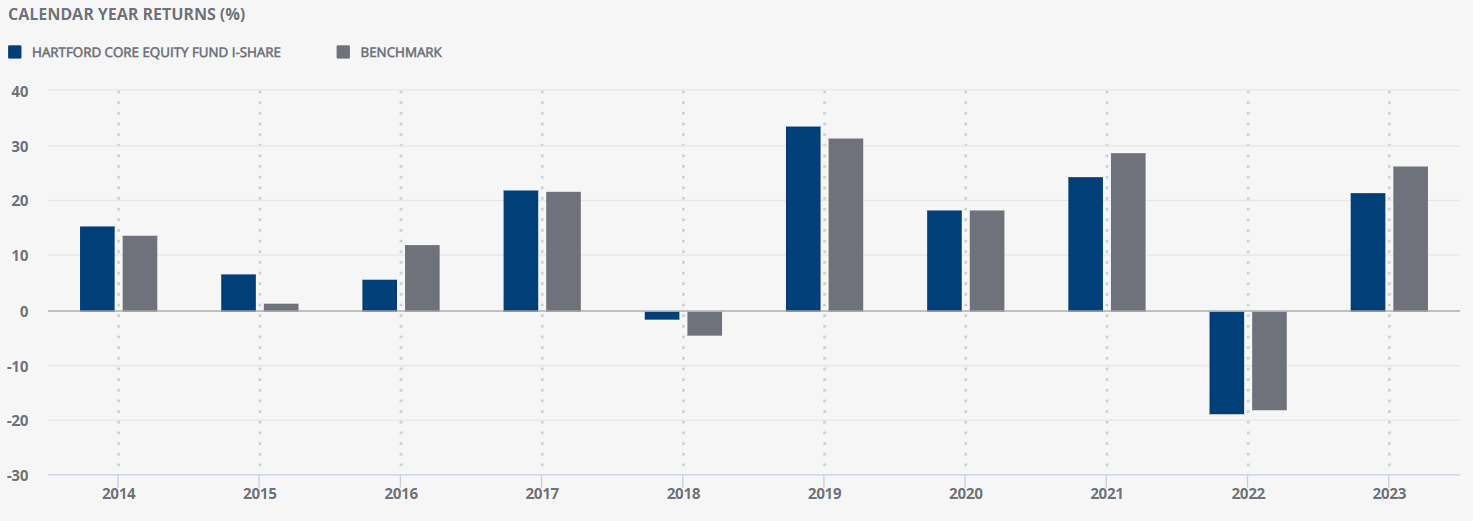
Calendar year performance of HGIYX vis-à-vis fund-recognised benchmark
The fund's emphasis on large-cap companies provides stability and lower volatility, making it a suitable option for investors looking for resilience during economic downturns.
Experienced Management
HGIYX is managed by Wellington Management, a team known for its rigorous research and value investing approach. The fund benefits from their extensive experience with large-cap companies and deep fundamental research.
Portfolio Management Approach
The fund employs a patient, long-term approach, focusing on what a company may look like over the next three to five years rather than seeking short-term catalysts. This results in a concentrated portfolio of 60 to 90 holdings, allowing for a more focused selection.
Market Outlook Considerations
Given the uncertain 2024 market outlook with concerns about rising interest rates and a potential economic slowdown, HGIYX's focus on large-cap and quality stocks could provide a level of protection compared to more aggressive investments.
Top 10 holdings
| Company | Ticker | Percentage |
|---|---|---|
Microsoft Corp |
MSFT |
7.72% |
Apple Inc |
AAPL |
6.17% |
Alphabet Inc |
GOOGL |
5.14% |
Amazon.com Inc |
AMZN |
4.85% |
UnitedHealth Group Inc |
UNH |
4.54% |
Visa Inc |
V |
4.44% |
Mastercard Inc |
MA |
4.13% |
Johnson & Johnson |
JNJ |
3.96% |
Exxon Mobil Corp |
XOM |
3.83% |
Berkshire Hathaway Inc |
BRK.A |
3.74% |
DFA U.S. Micro Cap Portfolio (DFSCX)
| Characteristic | Value |
|---|---|
Number of Holdings |
1,562 |
% in Top 10 Holdings |
4.05 |
Weighted Avg. Mkt. Cap. (Millions) |
$2,120 |
Price-to-Book |
1.8 |
Annual Turnover (10/31/2023) |
22% |
The DFA U.S. Micro Cap Portfolio (DFSCX) might be an attractive option for investors seeking exposure to micro-cap stocks. Here are some reasons experts have shortlisted this fund:
High Growth Potential
Micro-cap stocks, with market capitalizations below $300 million, have the potential for explosive growth. So, DFSCX provides an opportunity for significant returns compared to larger-cap stocks, though at the cost of higher volatility.
Passive Management
The fund follows a market-capitalization-weighted approach, which means it tracks the performance of the overall micro-cap market. This passive management strategy tends to result in lower management fees and expenses compared to actively managed funds, potentially improving overall returns for investors.
Strong Historical Performance
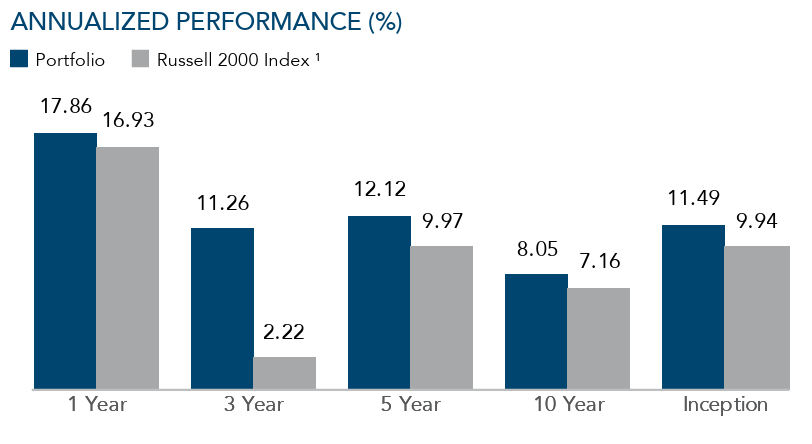
Annualized performance of DFSCX vis-à-vis Russell 2000 Index
DFSCX has demonstrated strong historical performance over the past decade, outperforming the Russell Microcap Index. The fund's average annual return of 10.7% compares favorably to the index's 8.5%, indicating effective management in capturing the potential growth within the micro-cap segment.
| Performance Metric | DFSCX | Russell Microcap Index |
|---|---|---|
10-Year Average Annual Return |
10.70% |
8.50% |
Top 10 holdings and sectoral allocation
| Company | Ticker | Percentage |
|---|---|---|
Acuity Brands Inc. |
AYI |
1.02% |
First Horizon Corp. |
FHN |
0.98% |
CoreLogic Inc. |
CLGX |
0.91% |
The Trade Desk Inc. |
TTD |
0.89% |
Axon Enterprise Inc. |
AXON |
0.86% |
Vertiv Holdings Co. |
VRT |
0.85% |
The Chemours Co. |
CC |
0.84% |
Zimmer Biomet Holdings Inc. |
ZBH |
0.83% |
Cantel Medical Corp. |
CMD |
0.82% |
Envista Corp. |
NVST |
0.82% |
Sectoral Allocation of DFSCX
Schwab S&P 500 Index Fund (SWPPX)
SWPPX, a low-cost, passively managed index fund tracking the S&P 500, is an attractive investment option in 2026 for several compelling reasons:
Simplicity and Diversification
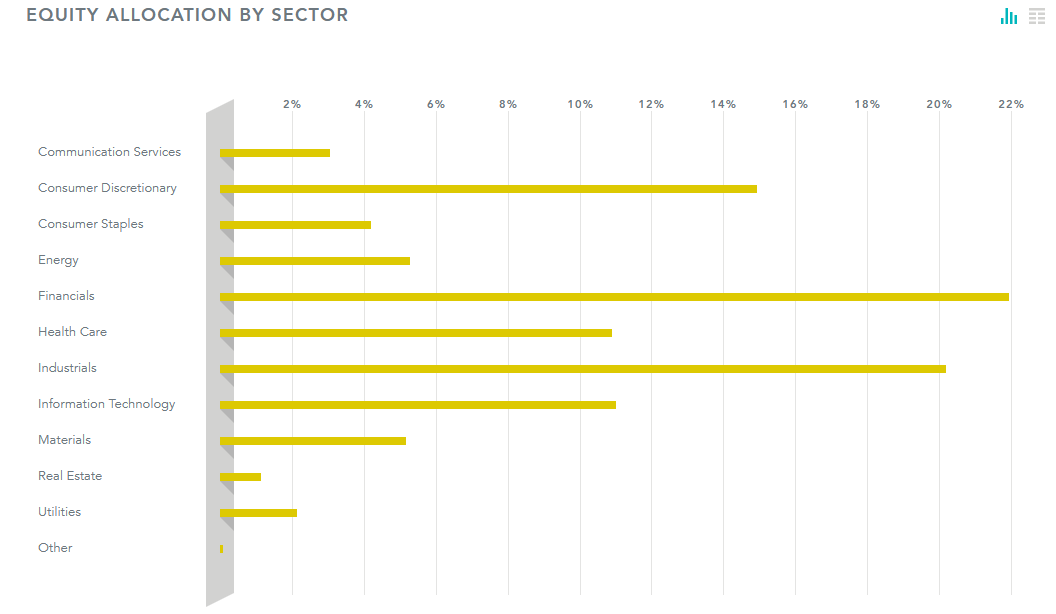
SWPPX offers easy access to the performance of the entire US stock market, providing diversification across various sectors and industries. Here is the sectoral weightage of the fund for reference:
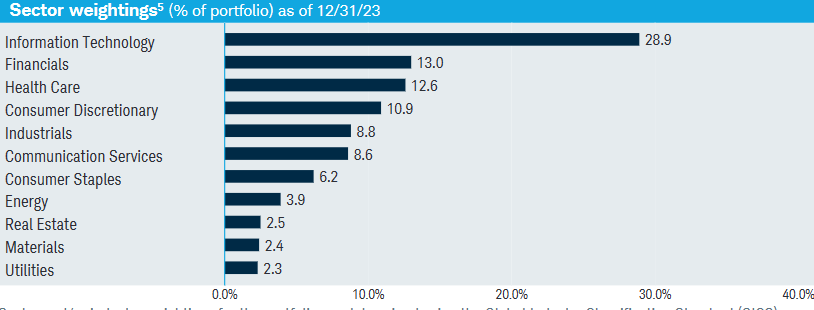
Sectoral Allocation of SWPPX
Low Cost
With a minimal expense ratio of 0.02%, SWPPX is surely a cost-effective investment. The low fees translate to only $2 in costs for every $10,000 invested annually, significantly reducing the long-term impact on returns.
Passive Management
The fund's "buy-and-hold" strategy minimizes transaction costs and avoids the challenges of market timing. This aligns with long-term investment goals and is particularly suitable for investors looking for a steady, hands-off approach.
No Minimum Investment
SWPPX allows investors to start with any amount, making it accessible to individuals with varying capital levels.
Positive Outlook
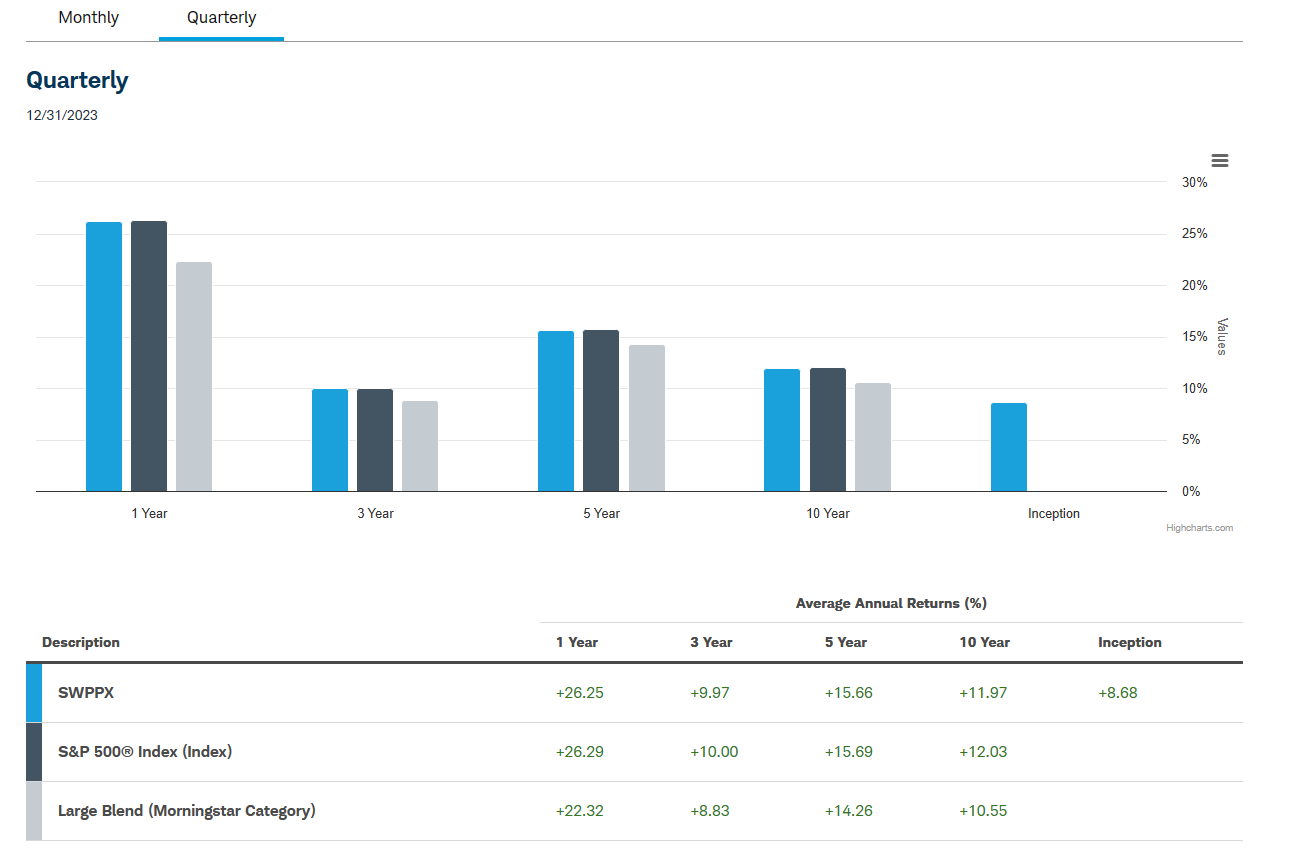
Return history of SWPPX vis-à-vis benchmarks
In 2023, SWPPX showed an annual return of 14.54%, slightly lower than the S&P 500's 15.73%. However, the fund's cost efficiency, attributed to its low fees, resulted in better net returns for investors.
Looking ahead to 2026, despite uncertainties related to inflation and interest rates, there is a favorable projection for the growth of the US economy. This positive outlook extends to the S&P 500 and SWPPX, suggesting potential continued growth for investors
Top 10 holdings
| Company | Ticker | Percentage |
|---|---|---|
Microsoft Corp. |
MSFT |
7.55% |
Apple Inc. |
AAPL |
6.80% |
Alphabet Inc. |
GOOGL |
4.23% |
Amazon.com Inc. |
AMZN |
3.80% |
Tesla Inc. |
TSLA |
3.31% |
Johnson & Johnson |
JNJ |
2.27% |
Berkshire Hathaway Inc. |
BRK.A |
2.25% |
Bank of America Corp. |
BAC |
1.90% |
Exxon Mobil Corp. |
XOM |
1.87% |
JPMorgan Chase & Co. |
JPM |
1.81% |
Vanguard's International Growth Fund (VWIGX)
| Fundamental Metrics | VWIGX | Benchmark |
|---|---|---|
Number of Stocks |
128 |
2,312 |
Median Market Cap (Billion USD) |
$56.5 |
$45.6 |
Earnings Growth Rate (%) |
15.50% |
12.70% |
Short-term Reserves (%) |
1.60% |
— |
P/E Ratio |
23.2x |
11.0x |
P/B Ratio |
3.8x |
1.8x |
Turnover Rate (FY-end 08/31/2023) |
13.70% |
— |
Return on Equity (%) |
12.90% |
12.60% |
Foreign Holdings (%) |
76.30% |
— |
Investing in Vanguard's International Growth Fund (VWIGX) presents a strategic opportunity for those seeking global growth exposure in their investment portfolio. Experts primarily focus on these aspects of the fund:
Growth-oriented Approach
VWIGX strategically targets non-U.S. companies with high growth potential, providing investors with exposure to promising global businesses. This focus allows for potential returns beyond what the saturated U.S. market may offer.
Exposure to Emerging Markets
About 25% of VWIGX's holdings are in emerging markets, unlocking opportunities in potentially high-growth economies. This exposure allows investors to tap into markets that may offer untapped potential and contribute to overall portfolio growth.
Competitive Expense Ratio
VWIGX maintains a reasonable expense ratio of 0.34%, making it a cost-effective choice for an actively managed international fund.
Performance in 2023
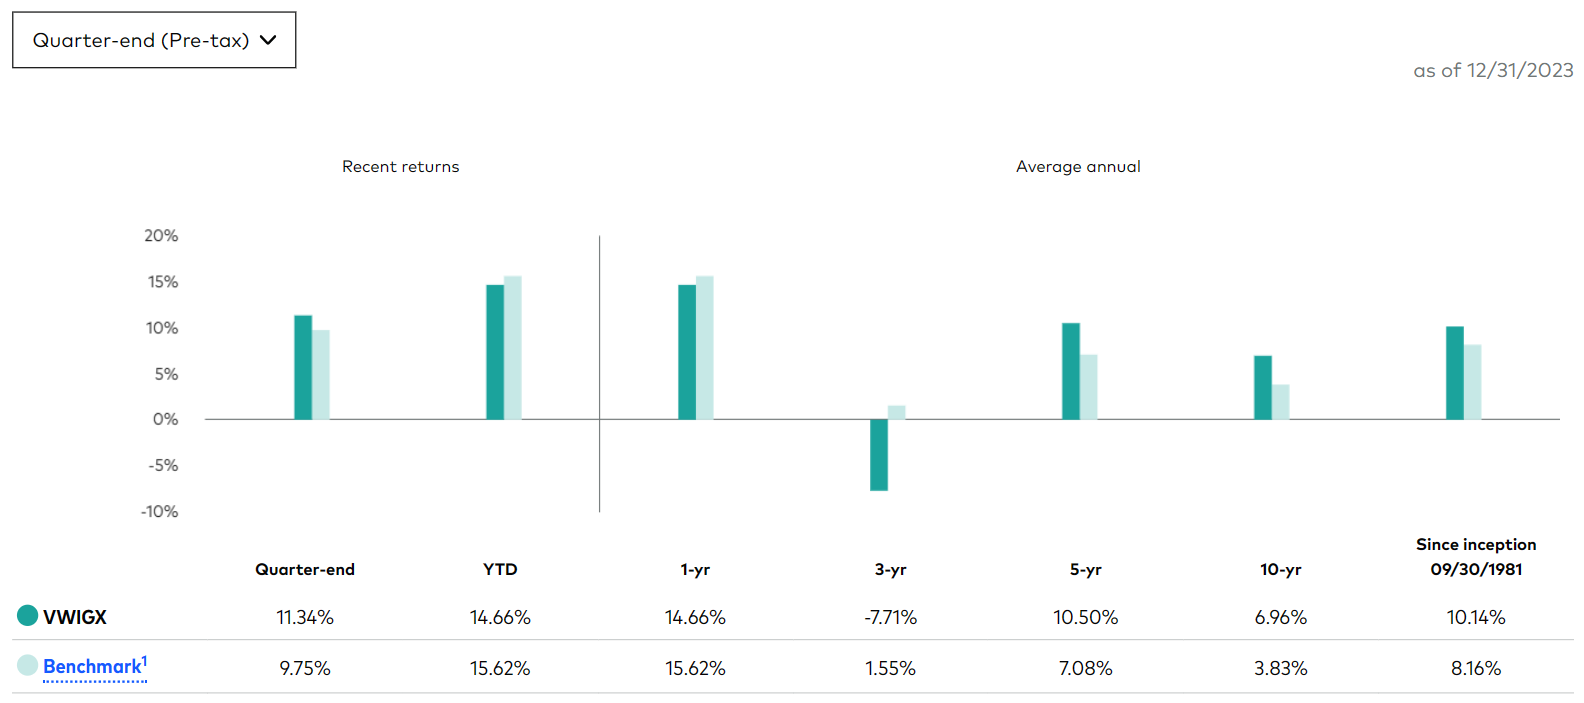
Return history of VWIGX vis-à-vis benchmarks
Despite returning 6.27% in 2023, slightly underperforming the MSCI All-Country World ex-US Index, this could be attributed to the fund's specific focus on growth companies in a challenging global market. The underperformance in 2023 doesn't discount its potential, and the fund is well-positioned for 2026, possibly benefiting from a more favorable market environment.
Top 10 holdings
| Company Name | Stock Ticker | Percentage |
|---|---|---|
MercadoLibre Inc |
MELI |
5.17% |
ASML Holding NV |
ASML.AS |
4.84% |
Spotify Technology SA |
SPOT |
3.27% |
argenx SE |
ARGX.BR |
3.08% |
Tencent Holdings Ltd |
0700.HK |
2.96% |
Taiwan Semiconductor Manufacturing Co Ltd |
2330.TW |
2.88% |
Moderna Inc |
MRNA |
2.38% |
Genmab A/S |
GMAB.CO |
2.12% |
Ferrari NV |
RACE.MI |
2.09% |
Atlas Copco AB Class A |
ATCO-A.ST |
1.99% |
Fidelity Investment Grade Bond Fund (FBNDX)
Investing in Fidelity Investment Grade Bond Fund (FBNDX) in 2026 holds several potential advantages for investors seeking a balanced and stable approach to their portfolio.
Conservative Focus
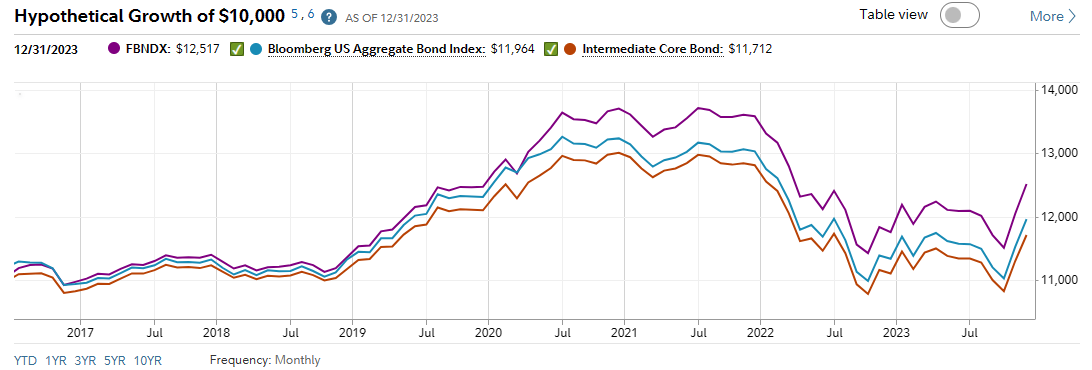
Simulated Returns of FBNDX vis-à-vis benchmarks
FBNDX's exclusive focus on investment-grade bonds/notes ensures a conservative investment approach, targeting bonds issued by financially robust entities with low default risk.
Diversification
The fund offers diversification by holding a mix of corporate and government bonds across various sectors and maturities. This diversification strategy mitigates concentrated risk by providing broader exposure to the bond market and enhancing overall portfolio stability.
Income Generation
FBNDX aims to deliver regular interest payments, making it an attractive option for investors seeking a reliable source of income. The consistent cash flow from interest payments can contribute to financial stability and meet income requirements for investors.
Hedge Against Volatility
Bonds, especially investment-grade ones, tend to act as a hedge during periods of stock market volatility. When equities experience downturns, bond prices often rise as investors seek the safety and stability offered by fixed-income securities.
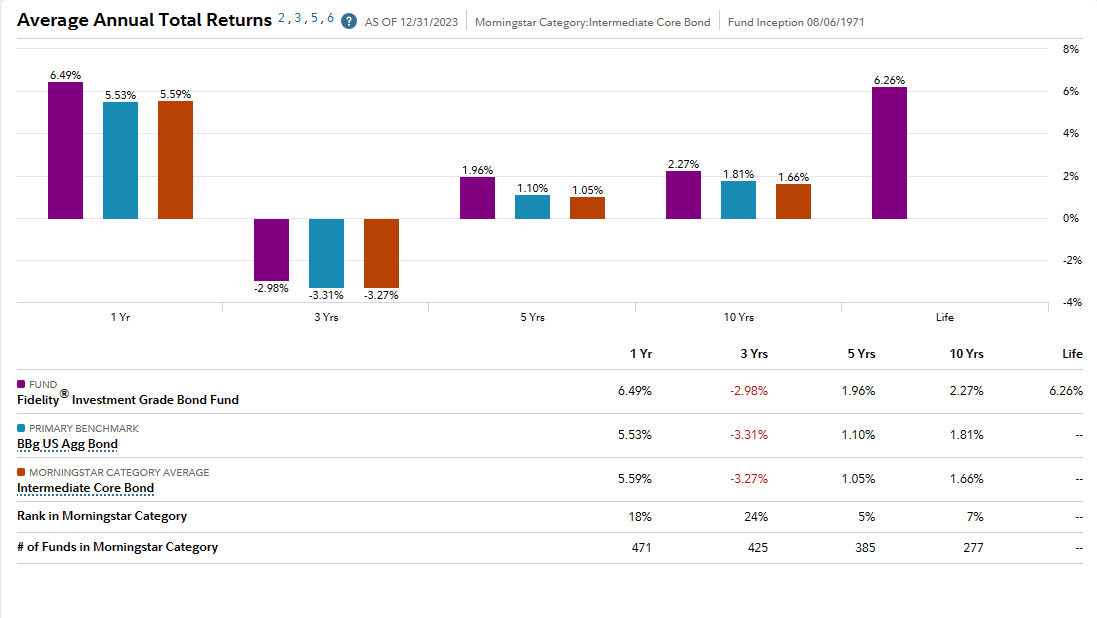
Average annual total returns of FBNDX compared over various terms
Top 10 holdings
| Holding | Percentage |
|---|---|
Fidelity® Cash Central Fund |
5.24% |
United States Treasury Notes 3.5% |
4.94% |
United States Treasury Notes 3.375% |
4.16% |
United States Treasury Bonds 2.375% |
3.91% |
United States Treasury Notes 3.875% |
3.61% |
United States Treasury Notes 4% |
2.93% |
United States Treasury Notes 4.125% |
2.62% |
United States Treasury Notes 2.875% |
2.42% |
United States Treasury Notes 4% |
2.33% |
United States Treasury Notes 3.625% |
1.96% |
Dodge & Cox Income Fund (DODIX)
| Fund Details | |
|---|---|
Inception Date |
01-03-1989 |
Minimum Initial Investment |
$2,500 |
Minimum Initial IRA Investment |
$1,000 |
Minimum Subsequent Investment |
$100 |
Expense Ratio |
0.41% |
Considering Dodge & Cox Income Fund (DODIX) for 2026 could be a prudent choice, given its proven track record, emphasis on quality and diversification, and active management expertise.
Proven Track Record
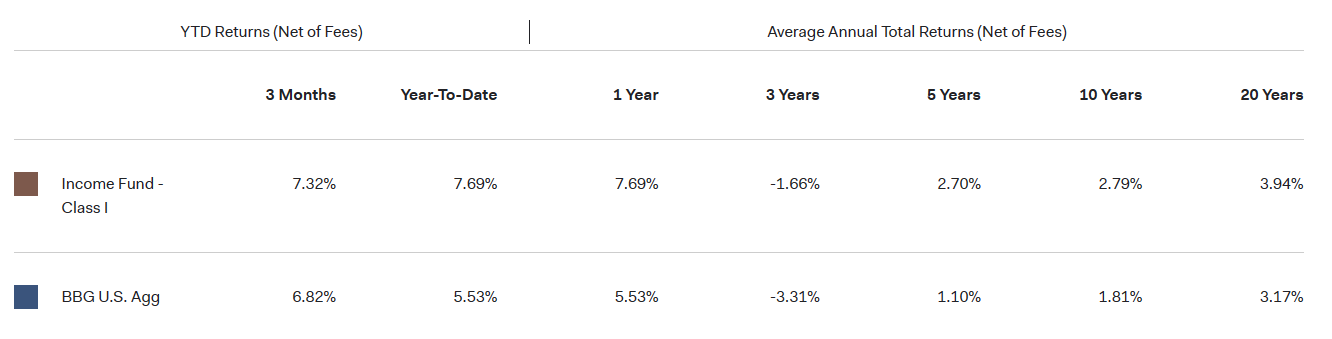
Returns of DODIX vis-à-vis benchmark
DODIX has demonstrated consistent outperformance against its benchmark, the Barclays Aggregate Bond Index, over the long term. With positive returns in 35 out of the past 37 years, the fund showcases resilience in navigating diverse market conditions.
Quality and Diversification
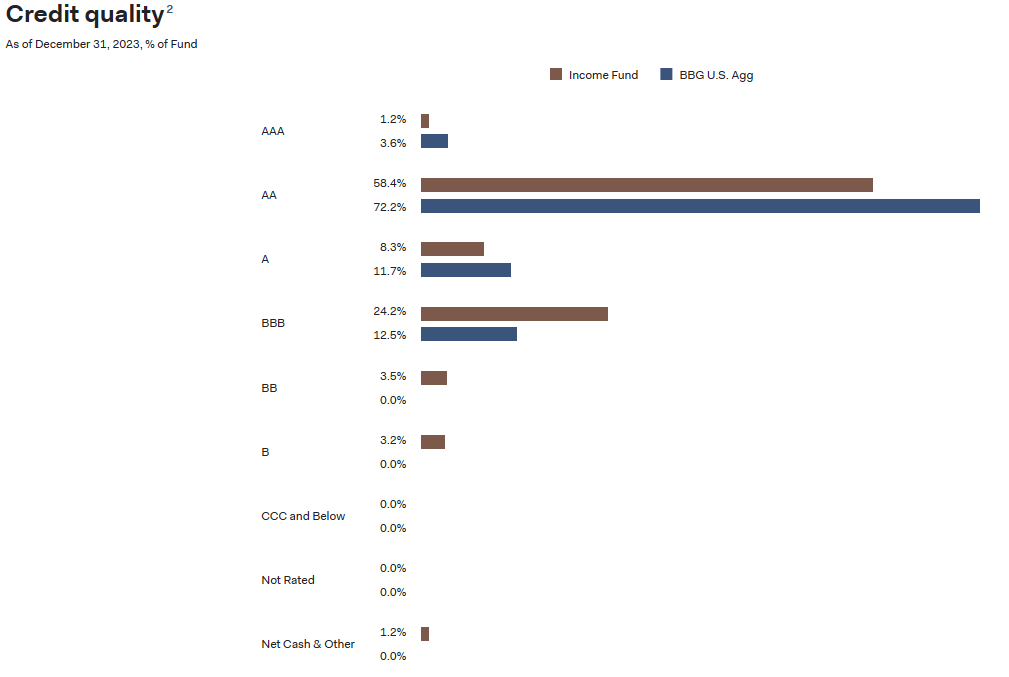
Credit quality metrics of DODIX vis-à-vis benchmark
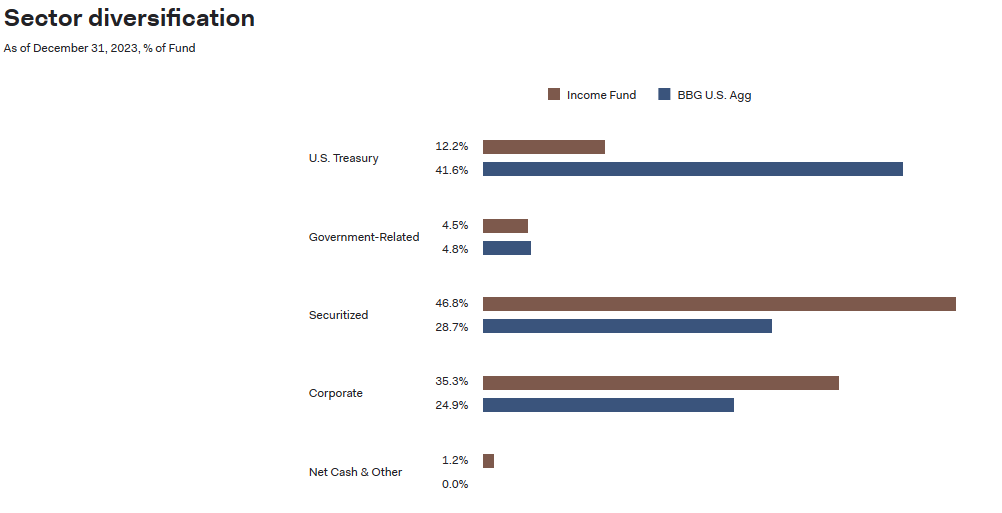
Sectoral diversification metrics of DODIX vis-à-vis benchmark
The fund strategically focuses on investment-grade debt securities, including government, corporate, and municipal bonds. This diversified approach spreads risk and prioritizes the security of income payments.
Durable Income Stream
The fund consistently provides attractive quarterly income payments, offering a reliable source of cash flow. For investors seeking income generation, DODIX stands out with its commitment to delivering consistent and reliable returns.
Performance in 2023
Despite a slightly lower return in 2023 (5.24% vs. benchmark's 5.51%), the fund's dynamic portfolio strategy, including strategic duration management and sector adjustments, reflects an expert response to market dynamics.
Historical Total Returns
Here’s how DODIX’s historical total returns compare to its benchmark over the past 5 years:
| Year | Income Fund - Class I (%) | BBG U.S. Agg (%) |
|---|---|---|
2023 |
7.69 |
5.53 |
2022 |
-10.87 |
-13.01 |
2021 |
-0.91 |
-1.54 |
2020 |
9.45 |
7.51 |
2019 |
9.73 |
8.72 |
Top 10 holdings
| Company Name | Percentage |
|---|---|
United States Treasury Bonds |
3.04% |
Federal National Mortgage Association |
3.03% |
Federal Home Loan Mortgage Corp. |
1.82% |
United States Treasury Notes |
1.50% |
United States Treasury Notes |
1.31% |
United States Treasury Bonds |
1.22% |
United States Treasury Bonds |
1.04% |
United States Treasury Notes |
1.00% |
Fnma Pass-Thru I |
0.90% |
United States Treasury Bonds |
0.87% |
Leuthold Core Investment Fund Adv (LCORX)
| Fund Details | |
|---|---|
Net Expense Ratio |
1.38% |
Min. Initial Investment |
$10,000.00 USD |
Min. Additional Investment |
$100.00 USD |
Initial IRA |
$1,000.00 USD |
Additional IRA |
$100.00 USD |
Investing in Leuthold Core Investment Fund Adv (LCORX) in 2026 offers several compelling reasons, making it a worthy consideration:
Dynamic Asset Allocation
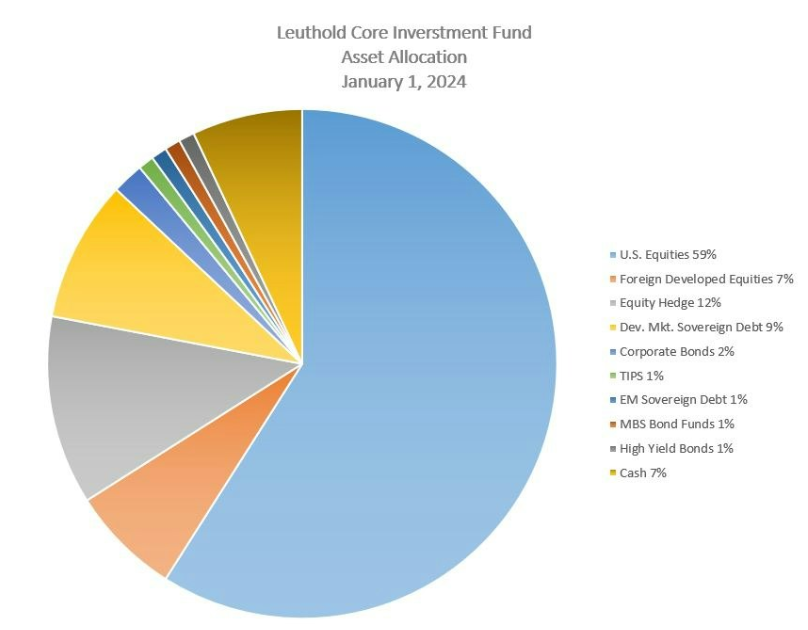
Asset allocation mix of LCORX
LCORX stands out for its adaptive approach to asset allocation, dynamically adjusting exposure to stocks and bonds based on market conditions and quantitative indicators.
Bear Equity Allocation
A distinctive feature of LCORX is its ability to allocate a portion of the fund to assets specifically intended to profit from declining stock markets. This "bear equity" allocation sets it apart, potentially mitigating losses during market downturns and enhancing overall risk management.
Outperformance Potential
Historically, LCORX has demonstrated the ability to outperform its benchmark, the Lipper Flexible Portfolio Funds Index, over various market cycles. This outperformance suggests the potential for delivering competitive returns in diverse market conditions.
Performance in 2023 and Portfolio Changes
LCORX showcased robust performance in 2023, returning 21.44%, significantly surpassing its benchmark. The fund's recent portfolio changes, such as increased exposure to semiconductor firms, indicate an adaptive strategy to capitalize on potential growth in cyclical sectors.
| Performance (as of 12/31/2023) | LCORX (%) | LCRIX (%) | S&P 500 (%) | Bbg. Barclays Global Agg. (%) |
|---|---|---|---|---|
December |
3.58 |
3.58 |
4.54 |
4.16 |
Q4 |
7.94 |
7.98 |
11.69 |
8.1 |
YTD |
11.7 |
11.85 |
26.29 |
5.72 |
1 Year |
11.7 |
11.85 |
26.29 |
5.72 |
3 Year |
6.24 |
6.34 |
10 |
-5.51 |
5 Year |
8.05 |
8.15 |
15.69 |
-0.32 |
10 Year |
6.04 |
6.14 |
12.03 |
0.38 |
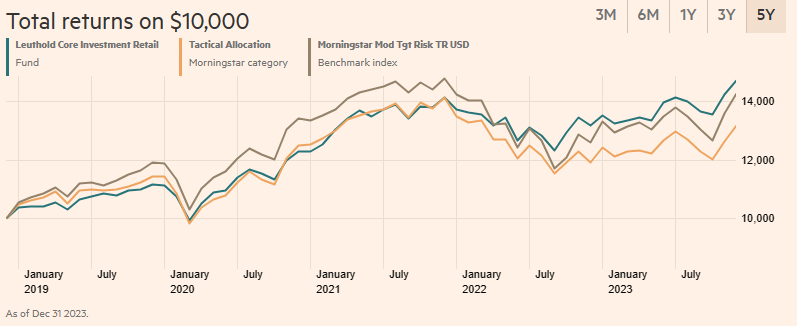
Historical Performance of LCORX
Top 10 holdings
| Company Name | Stock Ticker | Percentage |
|---|---|---|
Fidelity® Inv MM Government I |
- |
17.51% |
Microsoft Corp |
MSFT |
3.49% |
United States Treasury Bills 0% |
- |
3.22% |
Lam Research Corp |
LRCX |
2.81% |
Apple Inc |
AAPL |
2.54% |
United States Treasury Notes 3.88% |
- |
2.22% |
France (Republic Of) 3% |
- |
2.10% |
Meta Platforms Inc Class A |
META |
2.03% |
Applied Materials Inc |
AMAT |
1.99% |
Alphabet Inc Class A |
GOOGL |
1.89% |
Best Stock brokers


Tips for building smart mutual fund portfolio
| Smart Portfolio Building Tips | Explanation |
|---|---|
Define Your Financial Goals |
Clearly outline short-term and long-term financial objectives, such as saving for a home, education, or retirement. |
Assess Your Risk Tolerance |
Honestly evaluate comfort with market fluctuations to guide asset allocation and fund selection. |
Diversification is Key |
Spread investments across different asset classes to reduce risk and mitigate the impact of poor-performing investments. |
Understand Asset Allocation |
Allocate investments based on risk tolerance and goals; consider a higher equity allocation for longer investment horizons. |
Research Mutual Funds |
Thoroughly investigate factors like historical performance, expense ratios, and fund manager track records for consistency. |
Expense Ratios Matter |
Choose funds with low expense ratios as fees can significantly impact returns over time. Low-cost index funds or ETFs are popular choices. |
Consider Your Investment Horizon |
Align fund choices with your investment time frame; short-term goals may benefit from more conservative funds, while long-term goals can withstand equity fund volatility. |
Regularly Review and Rebalance |
Periodically review your portfolio to ensure alignment with goals and risk tolerance; rebalance if necessary, especially after significant market movements. |
Don't Panic During Market Downturns |
Stay calm during market fluctuations; resist impulsive decisions. Long-term investment provides opportunities for recovery and growth. |
Glossary for novice traders
-
1
Risk Management
Risk management is a risk management model that involves controlling potential losses while maximizing profits. The main risk management tools are stop loss, take profit, calculation of position volume taking into account leverage and pip value.
-
2
Volatility
Volatility refers to the degree of variation or fluctuation in the price or value of a financial asset, such as stocks, bonds, or cryptocurrencies, over a period of time. Higher volatility indicates that an asset's price is experiencing more significant and rapid price swings, while lower volatility suggests relatively stable and gradual price movements.
-
3
SIPC
SIPC is a nonprofit corporation created by an act of Congress to protect the clients of brokerage firms that are forced into bankruptcy.
-
4
Index
Index in trading is the measure of the performance of a group of stocks, which can include the assets and securities in it.
-
5
Options trading
Options trading is a financial derivative strategy that involves the buying and selling of options contracts, which give traders the right (but not the obligation) to buy or sell an underlying asset at a specified price, known as the strike price, before or on a predetermined expiration date. There are two main types of options: call options, which allow the holder to buy the underlying asset, and put options, which allow the holder to sell the underlying asset.


Team that worked on the article

Chinmay Soni is a financial analyst with more than 5 years of experience in working with stocks, Forex, derivatives, and other assets. As a founder of a boutique research firm and an active researcher, he covers various industries and fields, providing insights backed by statistical data. He is also an educator in the field of finance and technology.
As an author for Traders Union, he contributes his deep analytical insights on various topics, taking into account various aspects.

Dr. BJ Johnson is a PhD in English Language and an editor with over 15 years of experience. He earned his degree in English Language in the U.S and the UK. In 2020, Dr. Johnson joined the Traders Union team. Since then, he has created over 100 exclusive articles and edited over 300 articles of other authors.

Tobi Opeyemi Amure is an editor and expert writer with over 7 years of experience. In 2023, Tobi joined the Traders Union team as an editor and fact checker, making sure to deliver trustworthy and reliable content. The topics he covers include trading signals, cryptocurrencies, Forex brokers, stock brokers, expert advisors, binary options.
Tobi Opeyemi Amure motto: The journey of a thousand miles begins with a single step.
