How are Ticks Calculated in Trading?


Editorial Note: While we adhere to strict Editorial Integrity, this post may contain references to products from our partners. Here's an explanation for How We Make Money. None of the data and information on this webpage constitutes investment advice according to our Disclaimer.
A tick is a basic unit of price measurement in financial markets. Knowing the exact tick value helps traders to accurately calculate the potential profit or loss from trades. Tick value differs for different assets:
- for example, in the futures market a tick can be equal to 0.01 dollars;
- in the foreign exchange market (Forex) a tick is usually equal to 0.0001 for most currency pairs;
- in the cryptocurrency market, the tick size can vary greatly depending on the exchange and asset. For example, for Bitcoin, 1 tick can be equal to 1 dollar.
A tick in trading is the minimum price change by which the value of a financial instrument can change. Understanding how ticks work helps traders to better analyze price movements, develop strategies and manage risk. The problem is that sometimes a tick can refer to different aspects of trading. In this article, I will take a closer look at what a tick is and how it is used in trading different assets, and what can be the nuances associated with ticks.
How a tick works in trading
Tick plays a key role in the standardization of trading. An exchange sets a minimum price change value for each asset traded on it to make it easier for buyers and sellers to agree on a price for a trade - regardless of where in the world they are located, which broker they trade through, or which trading platform they use.
Taking tick size into account is important when developing strategies, planning profits and losses, and in general - tick is a basic concept for trading. If you feel that you do not fully understand what a tick means in trading, continue reading to solve this problem using numerous examples for beginners.
Best Forex brokers


How much is 1 tick in trading?
The size of the minimum possible change in the price of an asset traded on the exchange can vary greatly:
Futures: The tick value for futures contracts depends on the contract specifications, usually a fraction of a percent of the asset value.
Forex: In the foreign exchange market, the tick is often 0.0001 for major currency pairs such as EUR/USD.
Equities: For stocks on most exchanges, the tick size is $0.01.
Cryptocurrencies: In cryptocurrency trading, the tick size can vary depending on the platform and specifics of the cryptocurrency.
Let's take a closer look at tick sizes for each of the market types.
What is a tick in futures trading?
In futures trading, a "tick" refers to the minimum price increment at which the price of a futures contract can change. The size of a tick varies by the specific futures contract being traded and is established by the exchange on which the contract is traded. Each tick represents a specific monetary value, which can impact profit and loss calculations for traders.
Example. Gold futures traded on the COMEX have a tick size of $0.10 per troy ounce.
 Gold futures have a tick size of $0.10
How much is 1 tick on NQ?
To most accurately answer this question, it is always best to go to the primary source - the site of the exchange.
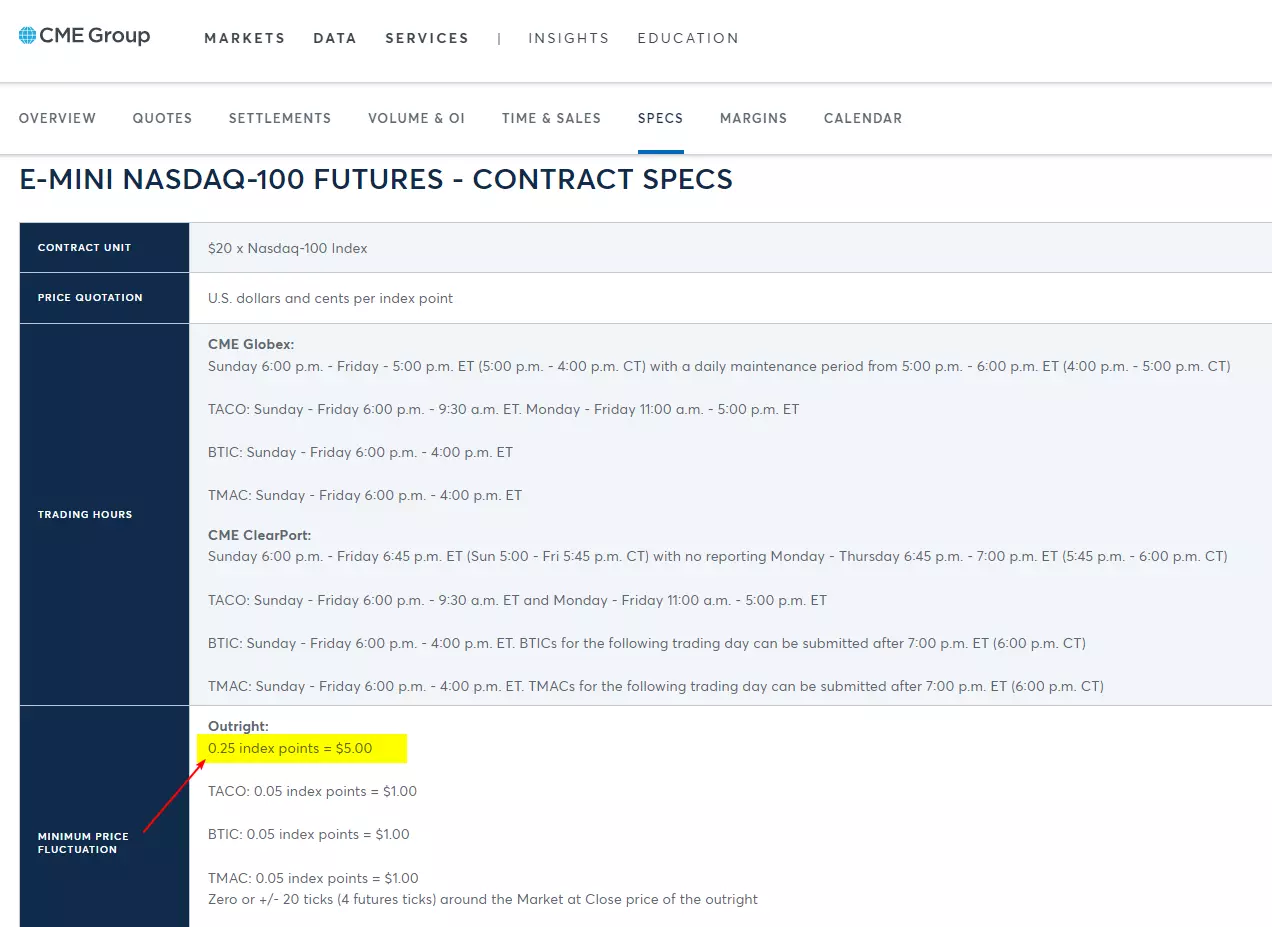 0.25 index points = $5.00
For the E-mini NASDAQ-100 futures (NQ), traded on the Chicago Mercantile Exchange (CME), the tick size is 0.25 index points. Each point of the index has a monetary value of $20, so each tick movement (0.25 points) represents a monetary change of $5. This means that for each 0.25 point the NQ futures price moves, the value of one contract changes by $5.
What is a tick in the S&P 500?
The tick size for E-mini S&P 500 futures traded on the Chicago Mercantile Exchange (CME) is 0.25 index points. Given that each point of the index is worth $50, each tick movement represents a monetary value of $12.50. Therefore, if the E-mini S&P 500 futures price moves from 4100.00 to 4100.25, it means the contract value has changed by $12.50.
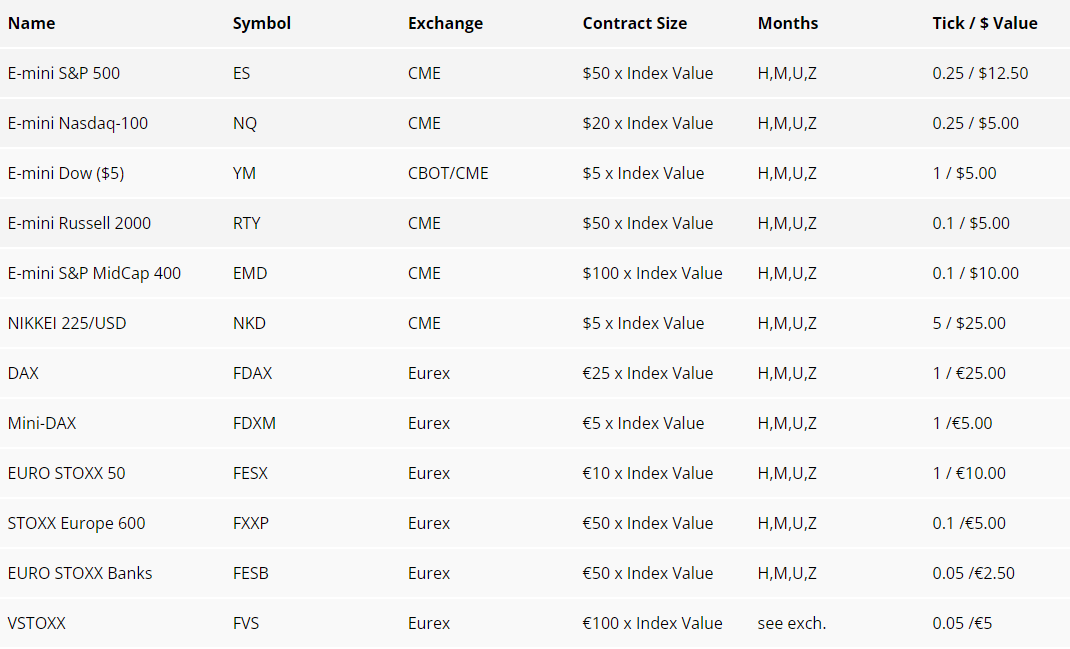 Tick sizes for different contracts
Another source of information regarding the tick size and the change in the contract value when the quote changes by 1 tick is brokers' websites, where clients can specify the contract specifications, as well as the size of the commission. This is important when planning trading, developing a strategy, estimating the amount of capital required to start trading.
What is the difference between a tick and a point in trading?
In trading, a tick and a point represent measurements of price changes, but they differ in their scope and scale.
| Tick | Point |
|---|---|
A tick is the smallest possible price change on the scale | A point represents a larger unit of price change |
Ticks can represent different actual values depending on the market and the instrument. | In the stock market, one point equates to a one-dollar change in the stock price. |
The relationship between ticks and points can vary widely across different markets and trading instruments. In many cases, it takes multiple ticks to make up one point. For example, if the tick size for a stock is $0.01 (one cent), it would take 100 ticks to make one point (one dollar).
What is a tick in Forex trading?
In Forex trading, a "tick" represents the smallest possible change in the price of a currency pair.
Examples of ticks in Forex Trading:
For most major currency pairs, such as EUR/USD, GBP/USD, or USD/JPY, the tick size is typically 0.00001 of the quoted price. This increment is often referred to as a " pip" (percentage in point). For instance, if the EUR/USD pair moves from 1.10500 to 1.10501, that 0.00001 increase in the exchange rate is one tick.
For pairs involving the Japanese yen, like USD/JPY, the pip or tick size is 0.001 because the yen is quoted to only three decimal places. So, if USD/JPY moves from 140.405 to 140.406, that's a one tick move.
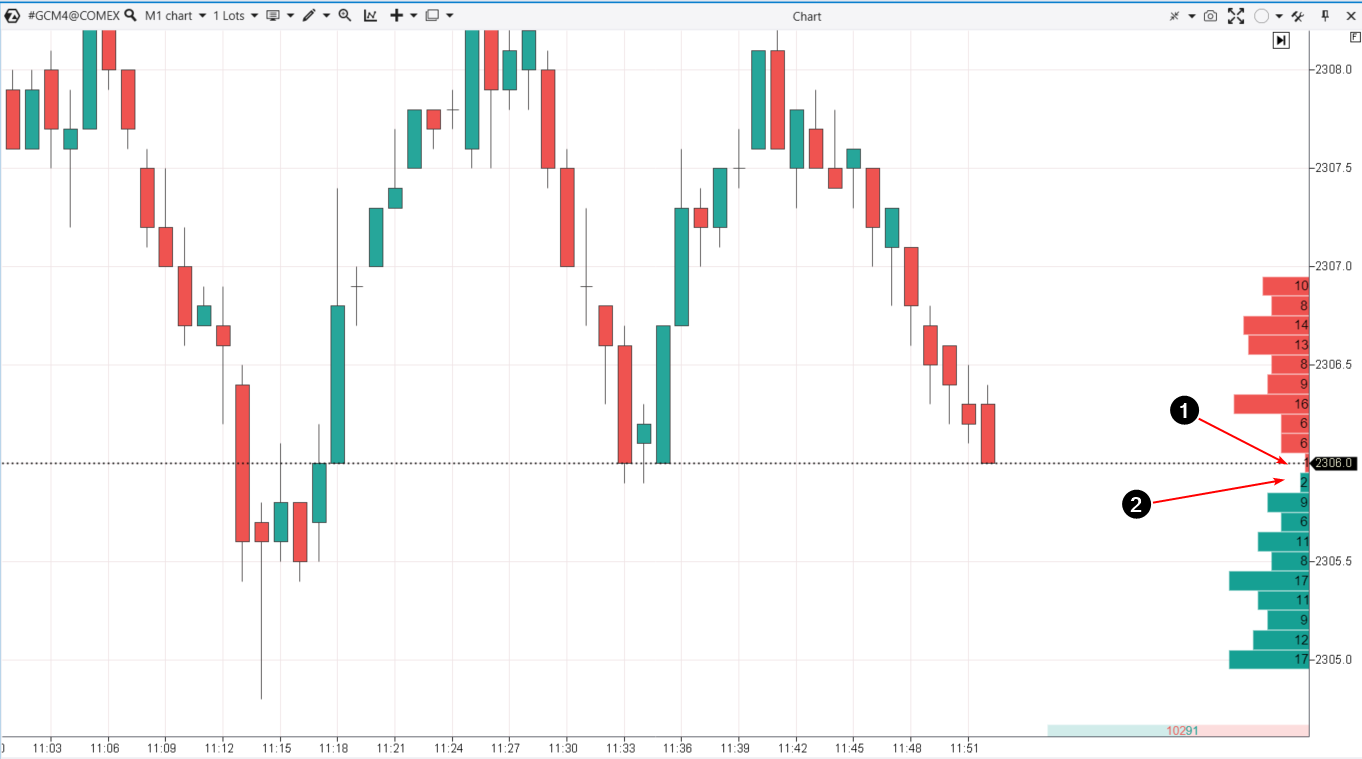
Some of the misunderstanding may have to do with tick volumes.
If you add a volume indicator to the chart, it will tick volumes - in this case 1 tick means 1 price change per unit of timeframe.
 When analyzing tick volumes, 1 tick can mean 1 price change
Example. For 1 minute the tick volume histogram shows the value = 57 ticks (above).
It means that the price changed 57 times in a minute, and the opening price can be equal to the closing price.
What is a tick in trading stocks?
In stock trading, a "tick" refers to the minimum price movement of a stock or other security, as defined by the exchange where the stock is traded. The concept of a tick is important because it dictates the smallest increment by which a stock price can change.
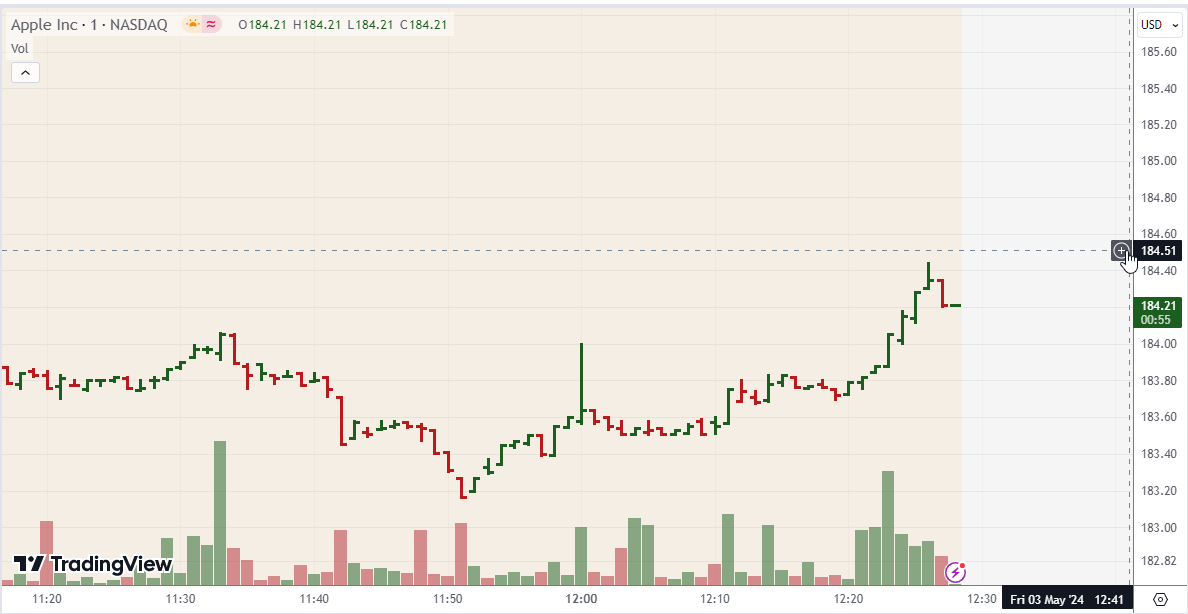 The size of 1 tick for the AAPL stock market is 1 US cent
The Securities and Exchange Commission ( SEC) in the United States does not specifically define "tick" for all stocks uniformly. Instead, the minimum tick size can vary based on the market, the specific rules of the exchange, and the price of the stock.
However, a few specific rules and pilot programs have been established to explore the impacts of varying tick sizes:
Regular Tick Size. For most U.S. stocks, the standard tick size is $0.01. This means that the stock price must move in increments of at least one cent.
Fractional Ticks. Before the decimalization in 2001, stock prices in the U.S. were quoted in fractions (e.g., 1/16 of a dollar, equivalent to $0.0625). Decimalization changed this, making $0.01 the smallest legal tick size for most stocks.
Tick Size Pilot Program. The SEC initiated a Tick Size Pilot Program which ran from October 2016 to September 2018. This program was designed to explore the effects of a larger tick size on trading, liquidity, and market quality. Under this program, the tick size for some smaller-cap stocks was increased to $0.05. In conclusion, the Tick Size Pilot Program's outcomes led to the decision not to implement wider tick sizes more broadly across the market. The findings suggested that while the theory behind increasing tick sizes to bolster market quality for smaller-cap stocks sounded plausible, the practical results did not support widespread benefits and showed potential downsides like increased cost and reduced liquidity.
What is a tick in trading crypto?
In cryptocurrency trading, a "tick" refers to the smallest possible price movement of a cryptocurrency pair on an exchange. Like in other forms of trading, the tick size determines the minimum increment by which the price of the cryptocurrency can change.
Example of Tick Sizes:
For major cryptocurrencies like Bitcoin (BTC) traded against the U.S. dollar (USD), an exchange might set a tick size of $0.10 or even smaller like $0.01. This means the smallest price movement for BTC/USD can be 10 cents or 1 cent.
For altcoins or less liquid cryptocurrencies, the tick size might be a fraction of a cent, or for very low-value coins, even smaller fractions.
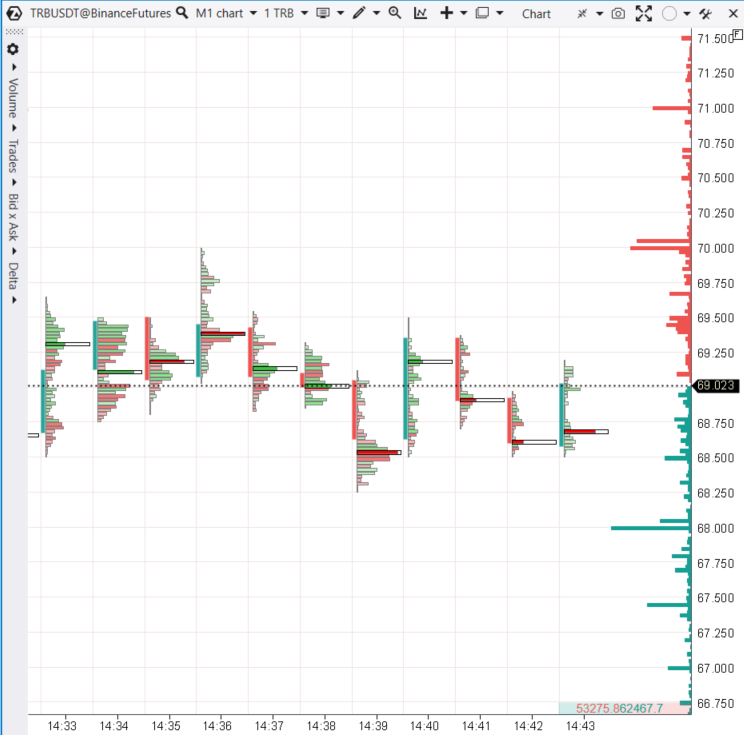 The size of 1 tick for the TRB/USDT market is 0.001 USD. Source: Binance Futures
The tick size in cryptocurrency trading can vary significantly depending on the exchange and the specific cryptocurrency pair being traded. Unlike more regulated markets like stocks or Forex, crypto exchanges independently set their tick sizes, which can be quite different across platforms. For instance, Ethereum (ETH) might be quoted at $1,750.123 on one exchange and $1,750.12 on another, indicating a difference in the tick size.
Expert Advice

When trading different cryptocurrencies, it is important for you to adapt your trading strategy to the tick size of different markets each time while 1 BTC can be worth 50 thousand dollars and 1 PEPE = $0.00001. Therefore, you can use percentages instead of measuring levels for stop loss and take profit orders.
What is a tick chart in trading?
A tick chart in trading is a type of chart that displays transactions or "ticks" instead of time intervals, which are used in more traditional charts like minute or hour charts. Each tick in the chart represents a trade, regardless of the size of the trade or the time it took place. This provides a different view of market dynamics compared to time-based charts.
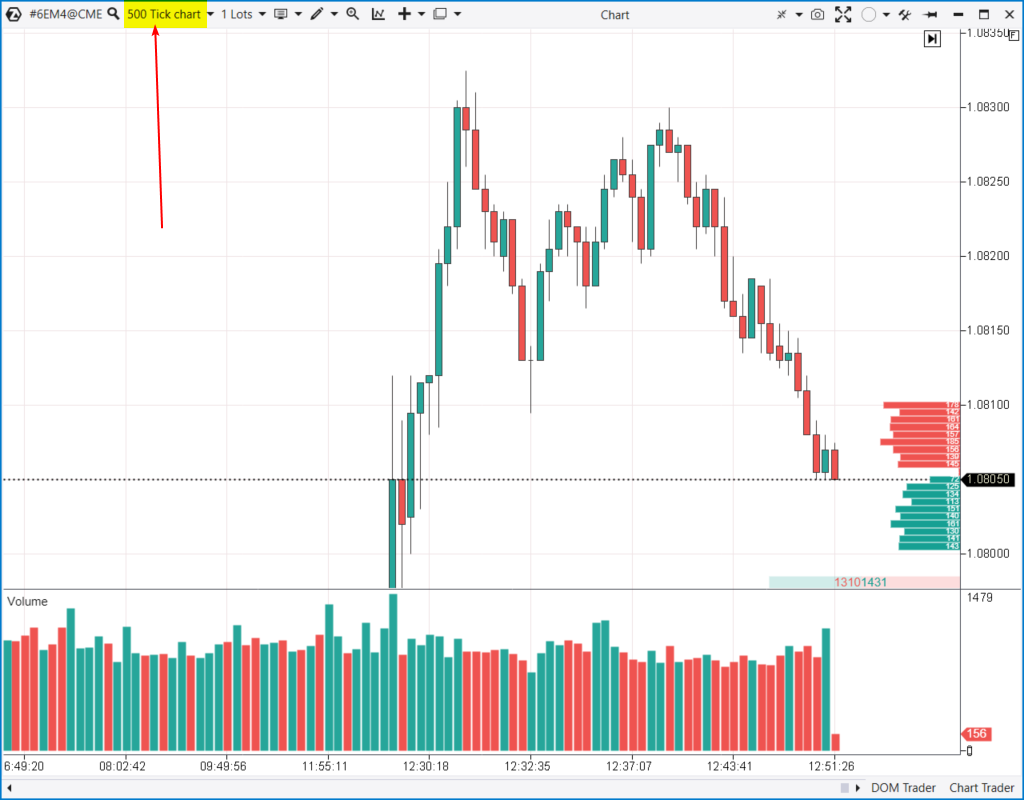 Example of a 500-tick chart
Unlike time-based charts that advance at regular time intervals, tick charts move only when a specified number of transactions have been completed in the market. For example, a 500-tick chart (above) will show a new bar or candle after 500 trades have occurred.
Features of Tick Charts:
Popular among day traders. Tick charts help in identifying breakout opportunities and market trends without the noise that sometimes accompanies time-based charts. They also help in pinpointing periods of low and high liquidity.
Response to Market Activity. Tick charts are highly responsive to changes in market activity. During periods of high trading volume, tick charts will produce more bars than during quiet periods. This makes them useful for understanding the intensity of trading activity and market sentiment at any given moment.
Refinement of Entry and Exit Points. Traders often use tick charts for more precise entry and exit points. Since tick charts reflect market dynamics more granularly, they can reveal short-term price patterns and oscillations that may not be visible on time-based charts.
Customization. Traders can customize the number of ticks per bar according to their trading strategy and the specific market conditions. Common settings might include 233 ticks, 512 ticks, or 1597 ticks — often numbers from the Fibonacci sequence, as some traders believe these provide a psychological edge in trading.
How to use the concept of tick in trading?
Using the concept of a tick in trading involves applying knowledge about the smallest price increment a security can move to refine trading strategies and manage risks effectively.
Here's a concise guide on how to use ticks in trading:
Limit and Stop-Loss Orders: Set these orders in tick multiples to ensure they are both valid and executable. For example, if a stock's tick size is $0.01, setting a stop-loss order 10 ticks away places it $0.10 from the entry price.
Scalping and Day Trading: Scalpers and day traders should be particularly aware of tick sizes, as small profit targets may only span a few ticks. Tick charts can help identify short-term trends or reversals, aiding quick decision-making.
Cost Analysis: Understanding tick sizes helps in calculating transaction costs, such as spreads quantified in ticks, and in determining the break-even point for trades.
Monetary Risk Calculation: Knowing the value of each tick helps determine the monetary risk per trade. For example, risking 50 ticks on a futures contract where each tick is worth $12.50 means a total risk of $625.
Technical Analysis Enhancement: Tick Charts, which focus on price changes rather than time, can provide clearer insights into market trends, especially useful in volatile, highly liquid markets.
Order Book Dynamics: Smaller tick sizes create a denser order book with more price levels, affecting liquidity and the market's capacity to absorb large orders without significant price shifts.
Summary
Tick size is crucial for traders as it affects the granularity of price levels available for placing orders. Smaller tick sizes allow for finer price differentiation, which can be beneficial in a highly volatile market like crypto. It enables traders to execute strategies that require high precision in order placement and management.
FAQs
What is a tick in trading?
A tick is the smallest possible change in the price of an asset. For example, for AAPL stock the tick size is 1 cent.
How much is 1 tick in trading?
As a rule, the tick size is a standardized value. It is set by the exchange for each financial asset traded there. At the same time, the exchange takes into account the requirements of the regulator's rules, which may relate to the tick size.
How Is Tick Size Measured?
Ticks are measured in monetary units. For example, 10 US cents is the minimum change in the value of gold. For the ETH/BTC pair on cryptocurrency exchanges, the tick size can be 0.00001 BTC. For the USD/JPY currency pair on the Forex market, a tick is usually equal to 0.01 or 0.001 yen. This is the standard value for many currency pairs in Forex, where a tick is usually defined as the fourth or fifth decimal place depending on the currency pair.
Are Ticks and Pips the Same?
Basically, yes. Ticks and pips are used to measure price changes, but a pip is a term commonly used in the Forex market, while a tick is applicable to all types of financial instruments.
Related Articles
Team that worked on the article
For over 15 years, Oleg worked as a copywriter and journalist at advertising and marketing agencies, as well as radio and television companies. His writing style is aimed at using simple terms to explain only those things that matter to the reader – benefits, risks, and realizable ideas. During the 2008 financial crisis, Oleg got interested in the stock and Forex markets and thoroughly explored price action to start working as an independent expert in 2018.
Dr. BJ Johnson is a PhD in English Language and an editor with over 15 years of experience. He earned his degree in English Language in the U.S and the UK. In 2020, Dr. Johnson joined the Traders Union team. Since then, he has created over 100 exclusive articles and edited over 300 articles of other authors.
Mirjan Hipolito is a journalist and news editor at Traders Union. She is an expert crypto writer with five years of experience in the financial markets. Her specialties are daily market news, price predictions, and Initial Coin Offerings (ICO).
A day trader is an individual who engages in buying and selling financial assets within the same trading day, seeking to profit from short-term price movements.
Risk management is a risk management model that involves controlling potential losses while maximizing profits. The main risk management tools are stop loss, take profit, calculation of position volume taking into account leverage and pip value.
The break-even point in trading is when your trade brings neither profit nor loss. As a rule, traders move the stop loss to the breakeven point when the trade starts to make profit.
Crypto trading involves the buying and selling of cryptocurrencies, such as Bitcoin, Ethereum, or other digital assets, with the aim of making a profit from price fluctuations.
The informal term "Forex Gods" refers to highly successful and renowned forex traders such as George Soros, Bruce Kovner, and Paul Tudor Jones, who have demonstrated exceptional skills and profitability in the forex markets.

-
 Afghanistan
-
 Albania
-
 Algeria
-
 Argentina
-
 Armenia
-
 Australia
-
 Austria
-
 Azerbaijan
-
 Bahamas
-
 Bahrain
-
 Bangladesh
-
 Belgium
-
 Botswana
-
 Brazil
-
 Brunei
-
 Bulgaria
-
 Burma
Burma
-
 Cambodia
-
 Cameroon
-
 Canada
-
 Chile
Chile
-
 China
China
-
 Colombia
-
 Costa Rica
-
 Cote d'Ivoire
-
 Croatia
-
 Cyprus
-
 Czech Republic
-
 Denmark
-
 Dominican Republic
-
 Ecuador
-
 Egypt
Egypt
-
 Estonia
-
 Eswatini
-
 Ethiopia
-
 Finland
-
 France
-
 Georgia
-
 Germany
-
 Ghana
Ghana
-
 Greece
-
 Haiti
Haiti
-
 Hong Kong
-
 Hungary
-
 India
India
-
 Indonesia
-
 Iran, Islamic republic
-
 Iraq
Iraq
-
 Ireland
-
 Israel
-
 Italy
Italy
-
 Jamaica
-
 Japan
Japan
-
 Jordan
-
 Kazakhstan
-
 Kenya
Kenya
-
 Korea
Korea
-
 Kuwait
-
 Kyrgyzstan
-
 Laos
Laos
-
 Latvia
-
 Lebanon
-
 Libyan Arab Jamahiriya
-
 Lithuania
-
 Luxembourg
-
 Macedonia
-
 Madagascar
-
 Malaysia
-
 Malta
Malta
-
 Mauritius
-
 Mexico
-
 Moldova
-
 Mongolia
-
 Montenegro
-
 Morocco
-
 Mozambique
-
 Namibia
-
 Nepal
Nepal
-
 Netherlands
-
 Nigeria
-
 Norway
-
 Oman
Oman
-
 Pakistan
-
 Palestine
-
 Papua New Guinea
-
 Peru
Peru
-
 Philippines
-
 Poland
-
 Portugal
-
 Puerto Rico
-
 Qatar
Qatar
-
 Romania
-
 Rwanda
-
 Saudi Arabia
-
 Serbia
-
 Singapore
-
 Slovakia
-
 Slovenia
-
 Somalia
-
 South Africa
-
 Spain
Spain
-
 Sri Lanka
-
 Sweden
-
 Switzerland
-
 Syrian Arab Republic
-
 Taiwan
-
 Tajikistan
-
 Tanzania, United Republic Of
-
 Thailand
-
 Trinidad and Tobago
-
 Tunisia
-
 Turkey
-
 UAE
UAE
-
 Uganda
-
 Ukraine
-
 United Kingdom
-
United States
-
 Uzbekistan
-
 Venezuela
-
 Vietnam
-
 Yemen
Yemen
-
 Zambia
-
 Zimbabwe
- Forex
- Crypto

