How Does BOS Work in Trading?


Editorial Note: While we adhere to strict Editorial Integrity, this post may contain references to products from our partners. Here's an explanation for How We Make Money. None of the data and information on this webpage constitutes investment advice according to our Disclaimer.
A Break of Structure (BOS) refers to a significant change in the established price trend or pattern in financial markets, indicating a potential shift in market sentiment and offering trading opportunities for those who can identify and act upon it. Traders and investors use BOS as signals by recognizing key turning points in market dynamics.
The concept of a "break of structure" holds significant importance in the realm of technical analysis. In this article, we will elucidate why recognizing and understanding these patterns is essential for traders.
What is BOS in trading?
In trading, a Break of Structure (BOS) is a fundamental concept used in technical analysis to identify a critical change in the prevailing trend or pattern of an asset's price movement. It typically occurs when a support or resistance level is decisively breached, signaling a shift in market sentiment. A break of structure can signify the end of an existing trend or the emergence of a new one, and it is often seen as a key entry or exit point for traders.
For instance, if a stock has been consistently making higher highs and higher lows but then breaks below a previously established higher low, it suggests a potential reversal from an uptrend to a downtrend. Traders use BOS to make informed decisions, such as entering short positions when a bearish break of structure occurs or exiting long positions when a bullish trend loses its upward momentum. Recognizing and interpreting breaks of structure is a valuable skill for traders to manage risk and capitalize on changing market conditions.
Break of Structure (BOS) is typically a favorable opportunity for traders to enter positions at a trend reversal with moderate risk, with stop-loss orders often placed at a level that would invalidate the BOS.
Main types of market structure
In technical analysis, there are three classical market structures bullish structure, bearish structure, and ranging structure. These structures assist traders and investors in assessing the current market condition and making decisions regarding their positions.
Bullish Market Structure
In a bullish market structure, prices generally exhibit higher highs and higher lows. This indicates a prevailing uptrend characterized by rising optimism among traders and investors. A Break of Structure (BOS) in a bullish context occurs when the price makes a lower low, signaling a potential trend reversal. Traders often place stop-loss orders below the recent higher low, as a drop below this level could invalidate the bullish trend.
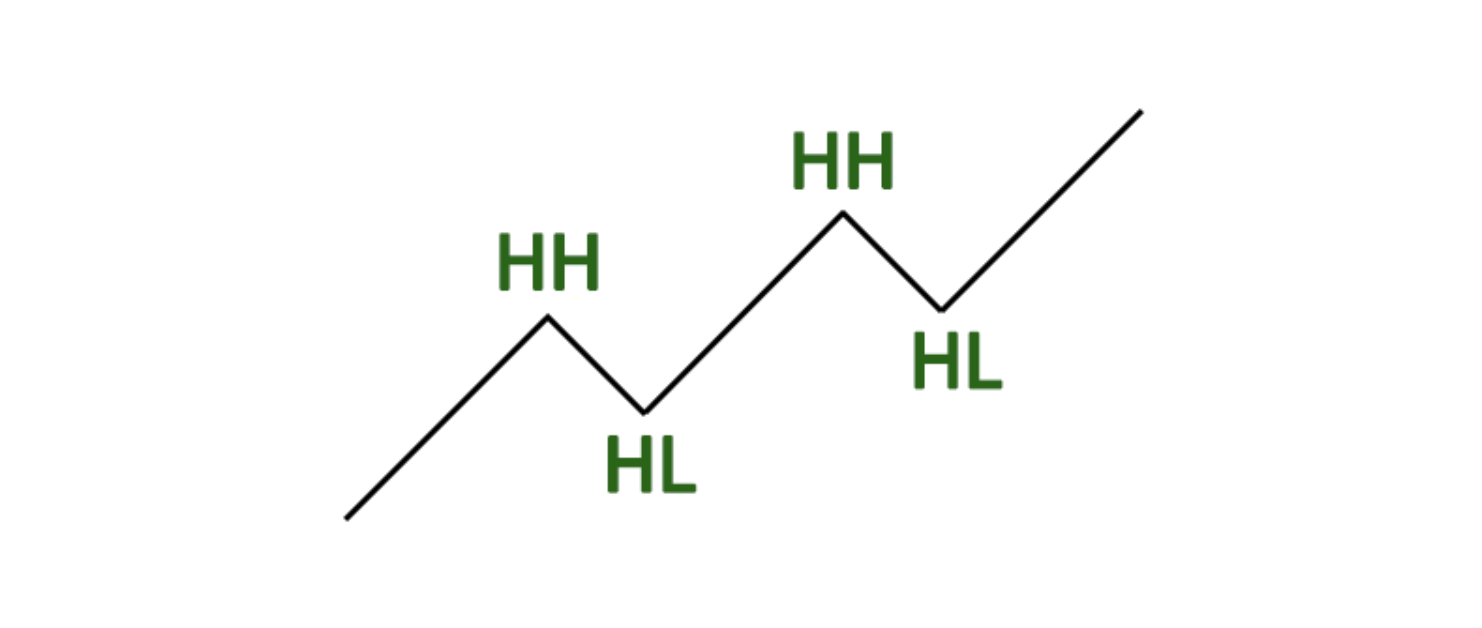 A bullish market structure
Bearish Market Structure
Conversely, a bearish market structure is defined by lower highs and lower lows, signifying a predominant downtrend. In this scenario, a BOS manifests when the price forms a higher high, hinting at a potential trend reversal. Traders typically position their stop-loss orders above the recent lower high, as a breach of this level could negate the bearish trend.
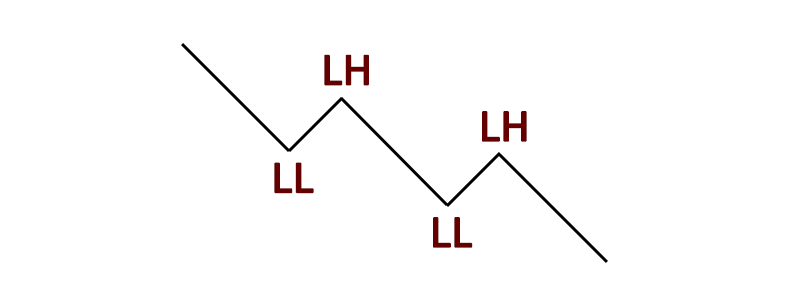 A bearish market structure
Sideways (Ranging) Market Structure
In a sideways or ranging market structure, prices move within a horizontal range without forming clear higher highs or lower lows. BOS identification in this context can be challenging. Traders often look for a decisive breakout above or below the range boundaries to spot potential trend shifts. Stop-loss placement in a ranging market often involves setting orders just outside the range to mitigate losses in case of a false breakout.
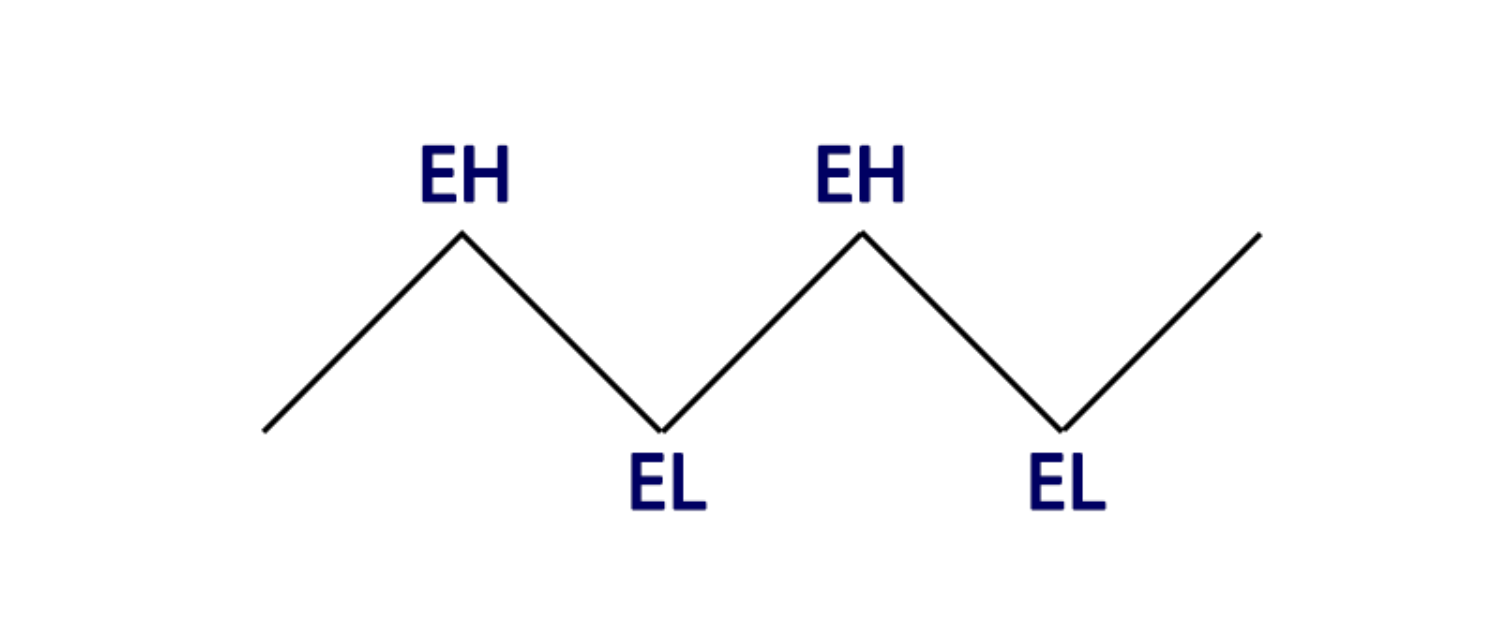 A sideway market structure
How to trade a break of market structure (BOS)
This step-by-step guide outlines how to trade breakouts of market structure, helping traders identify and capitalize on trend reversals.
1. Identify the market structure
Determine the prevailing market structure, which can be bullish, bearish, or ranging. Look for higher highs and higher lows in a bullish trend, lower highs and lower lows in a bearish trend, or a horizontal range in a ranging market2. Locate the break of structure (BOS)
Identify the critical point where the market structure is about to change. In a bullish trend, this might be a lower low; in a bearish trend, it could be a higher high. For a ranging market, watch for a decisive breakout above or below the range boundaries3. Confirm the BOS
Use technical indicators like Moving Averages, Relative Strength Index (RSI), or MACD to confirm the BOS signal. These indicators can provide additional insights into the strength of the trend reversal
Also, the identification of a Break of Structure is significantly strengthened by the confirmation from both volume and price action:Volume plays a pivotal role; an increase in volume concurrent with a BOS suggests that a greater number of market participants are committed to the new price direction, thereby lending credibility to the breakout. This is because higher trading volume typically indicates more significant interest and momentum, which can help sustain the move beyond the structural level that has been breached. Conversely, if a BOS occurs on low volume, traders should be wary as it may indicate a lack of conviction behind the move, raising the suspicion of a potential false breakout where prices may revert back to the previous trading range.
Price action confirmation techniques further enhance the reliability of a BOS. Traders often look for follow-through movements post-BOS as a sign that the breakout is valid. A follow-through movement occurs when prices continue to move in the direction of the break in subsequent trading sessions, demonstrating that the market has accepted the new price level. Without this confirmation, the initial breakout could be questioned, and the risk of a false breakout increases. Effective price action confirmation not only provides validation for the BOS but also offers traders more solid ground for making informed decisions on entries, exits, and the management of their trades.
4. Entry point
Once the BOS is confirmed, consider entering a position in the direction of the anticipated trend reversal. For example, if it's a bearish BOS, consider shorting the asset5. Stop-loss
To manage risk, place a stop-loss order just beyond the point that would invalidate the BOS. In a bearish BOS, set the stop-loss above the recent higher high; in a bullish BOS, place it below the recent lower low6. Take profit
Determine your profit target and the risk-reward ratio before entering the trade. Decide when to take profits or adjust your stop-loss as the trade progresses
What are the best brokers for active traders?
For active traders, the best brokers are those that offer competitive commissions and high liquidity. Specifically, an ECN account can provide these benefits. Additionally, these brokers offer the ability to trade using advanced technical analysis features on the TradingView platform and ensure robust regulation.
| ECN | ECN Commission | EUR/USD Spread (avg.) | GBP/USD Spread (avg.) | TradingView charting | Regulation | |
|---|---|---|---|---|---|---|
| Yes | 3 | 0,1 | 0,15 | Yes | ASIC, FCA, DFSA, BaFin, CMA, SCB, CySec | |
| Yes | No | No | No | Yes | FCA, CySEC, MAS, ASIC, FMA, FSA (Seychelles) | |
| Yes | 3,5 | 0,15 | 0,2 | Yes | FSC (BVI), ASIC, IIROC, FCA, CFTC, NFA |
Expert Opinion

Properly identifying and reacting to Breaks of Structure can be highly advantageous. However, it is crucial to validate any potential BOS signal through careful confirmation.
A single candlestick or bar breaking a support or resistance level may look like a BOS on its own, but oftentimes prices will revert back after an initial breach. That is why focusing on volume and using indicators can help filter out these false breaks. A substantial increase in volume accompanying the price action lends credence to the conviction of the move. Confirmation from momentum indicators also signals the strength of the trend change.
In addition, I have noticed the importance of "retesting" the broken structure level after the initial BOS occurs. When prices pull back to revisit the level, typically hovering above for resistance breaches or below for support breaks, it provides traders with lower-risk entry points close to the original area. Failing to hold the level on retest usually indicates the break was temporary.
For those new to BOS trading, I recommend practicing identifying setups without trading them live at first. Focus on properly confirming signals using multiple techniques before risking real money. With experience, one learns how to filter out dubious breaks and get a stronger read of the market from structure shifts.
FAQs
What is the structure in trading?
Structure in trading refers to the prevailing pattern or trend in an asset's price movement, which can be bullish (higher highs and higher lows), bearish (lower highs and lower lows), or ranging (horizontal price movement).
What does BOS mean in trading?
BOS in trading stands for "Break of Structure". It signifies a critical point where the established market structure is about to change, indicating a potential shift in trend direction.
What is the break of structure indicator?
There is no specific "break of structure indicator" in trading. Traders typically identify BOS points through technical analysis, such as trendline breaks, candlestick patterns, or chart patterns, combined with confirmation from technical indicators.
What is a break of structure and retest strategy?
The break of structure and retest strategy involves waiting for a BOS to occur, then waiting for the price to retest the broken structure level before entering a trade. Traders use this strategy to increase the probability of a successful trade and manage risk effectively.
Related Articles
Team that worked on the article
Andrey Mastykin is an experienced author, editor, and content strategist who has been with Traders Union since 2020. As an editor, he is meticulous about fact-checking and ensuring the accuracy of all information published on the Traders Union platform. Andrey focuses on educating readers about the potential rewards and risks involved in trading financial markets.
He firmly believes that passive investing is a more suitable strategy for most individuals. Andrey's conservative approach and focus on risk management resonate with many readers, making him a trusted source of financial information.
Also, Andrey is a member of the National Union of Journalists of Ukraine (membership card No. 4574, international certificate UKR4492).
Chinmay Soni is a financial analyst with more than 5 years of experience in working with stocks, Forex, derivatives, and other assets. As a founder of a boutique research firm and an active researcher, he covers various industries and fields, providing insights backed by statistical data. He is also an educator in the field of finance and technology.
As an author for Traders Union, he contributes his deep analytical insights on various topics, taking into account various aspects.
Mirjan Hipolito is a journalist and news editor at Traders Union. She is an expert crypto writer with five years of experience in the financial markets. Her specialties are daily market news, price predictions, and Initial Coin Offerings (ICO).
CFD is a contract between an investor/trader and seller that demonstrates that the trader will need to pay the price difference between the current value of the asset and its value at the time of contract to the seller.
A false breakout, also known as a "fakeout," occurs when the price of a financial asset briefly moves beyond a key level of support or resistance, triggering buy or sell signals, but then quickly reverses direction, trapping traders who entered positions based on the initial breakout signal.
Risk management in Forex involves strategies and techniques used by traders to minimize potential losses while trading currencies, such as setting stop-loss orders and position sizing, to protect their capital from adverse market movements.
Index in trading is the measure of the performance of a group of stocks, which can include the assets and securities in it.
Take-Profit order is a type of trading order that instructs a broker to close a position once the market reaches a specified profit level.

-
 Afghanistan
-
 Albania
-
 Algeria
-
 Argentina
-
 Armenia
-
 Australia
-
 Austria
-
 Azerbaijan
-
 Bahamas
-
 Bahrain
-
 Bangladesh
-
 Belgium
-
 Botswana
-
 Brazil
-
 Brunei
-
 Bulgaria
-
 Burma
Burma
-
 Cambodia
-
 Cameroon
-
 Canada
-
 Chile
Chile
-
 China
China
-
 Colombia
-
 Costa Rica
-
 Cote d'Ivoire
-
 Croatia
-
 Cyprus
-
 Czech Republic
-
 Denmark
-
 Dominican Republic
-
 Ecuador
-
 Egypt
Egypt
-
 Estonia
-
 Eswatini
-
 Ethiopia
-
 Finland
-
 France
-
 Georgia
-
 Germany
-
 Ghana
Ghana
-
 Greece
-
 Haiti
Haiti
-
 Hong Kong
-
 Hungary
-
 India
India
-
 Indonesia
-
 Iran, Islamic republic
-
 Iraq
Iraq
-
 Ireland
-
 Israel
-
 Italy
Italy
-
 Jamaica
-
 Japan
Japan
-
 Jordan
-
 Kazakhstan
-
 Kenya
Kenya
-
 Korea
Korea
-
 Kuwait
-
 Kyrgyzstan
-
 Laos
Laos
-
 Latvia
-
 Lebanon
-
 Libyan Arab Jamahiriya
-
 Lithuania
-
 Luxembourg
-
 Macedonia
-
 Madagascar
-
 Malaysia
-
 Malta
Malta
-
 Mauritius
-
 Mexico
-
 Moldova
-
 Mongolia
-
 Montenegro
-
 Morocco
-
 Mozambique
-
 Namibia
-
 Nepal
Nepal
-
 Netherlands
-
 Nigeria
-
 Norway
-
 Oman
Oman
-
 Pakistan
-
 Palestine
-
 Papua New Guinea
-
 Peru
Peru
-
 Philippines
-
 Poland
-
 Portugal
-
 Puerto Rico
-
 Qatar
Qatar
-
 Romania
-
 Rwanda
-
 Saudi Arabia
-
 Serbia
-
 Singapore
-
 Slovakia
-
 Slovenia
-
 Somalia
-
 South Africa
-
 Spain
Spain
-
 Sri Lanka
-
 Sweden
-
 Switzerland
-
 Syrian Arab Republic
-
 Taiwan
-
 Tajikistan
-
 Tanzania, United Republic Of
-
 Thailand
-
 Trinidad and Tobago
-
 Tunisia
-
 Turkey
-
 UAE
UAE
-
 Uganda
-
 Ukraine
-
 United Kingdom
-
United States
-
 Uzbekistan
-
 Venezuela
-
 Vietnam
-
 Yemen
Yemen
-
 Zambia
-
 Zimbabwe
- Forex
- Crypto
