Best MT5 Indicators For Forex Trading


Editorial Note: While we adhere to strict Editorial Integrity, this post may contain references to products from our partners. Here's an explanation for How We Make Money. None of the data and information on this webpage constitutes investment advice according to our Disclaimer.
Best MT5 indicators in Forex trading are:
The Alligator Indicator. Tracks market trends.
Money Flow Index (MFI). Measures market buying strength.
Fibonacci Bar Indicator. Identifies retracement levels.
Cronex Impulse MACD Indicator. Detects trend momentum shifts.
Bollinger Bands. Shows volatility and price range.
Forex trading offers both significant opportunities and considerable risks. Entering the market without a clear strategy can lead to confusion amid endless charts and data. Successful traders invest time in refining their skills and learning how to interpret the market’s key signals effectively.
This guide highlights essential tools and indicators that can enhance your trading experience on MetaTrader 5, helping you navigate the markets with greater confidence and precision.
Best MT5 indicators
When it comes to Forex trading, utilizing the right indicators can significantly enhance one's trading strategy. The MetaTrader 5 (MT5) platform offers a diverse selection of indicators, each serving a specific purpose. For our study, let’s consider the top 10 MT5 indicators to add to your strategy:
The Alligator Indicator
Developed by Bill Williams, the alligator indicator resembles the creature it is named after, with three lines representing the jaw, teeth, and lips. By utilizing moving averages, specifically a 13-period, 8-day, and 5-day average, the alligator indicator visualizes the market's transition from a non-trending phase to a trending one.
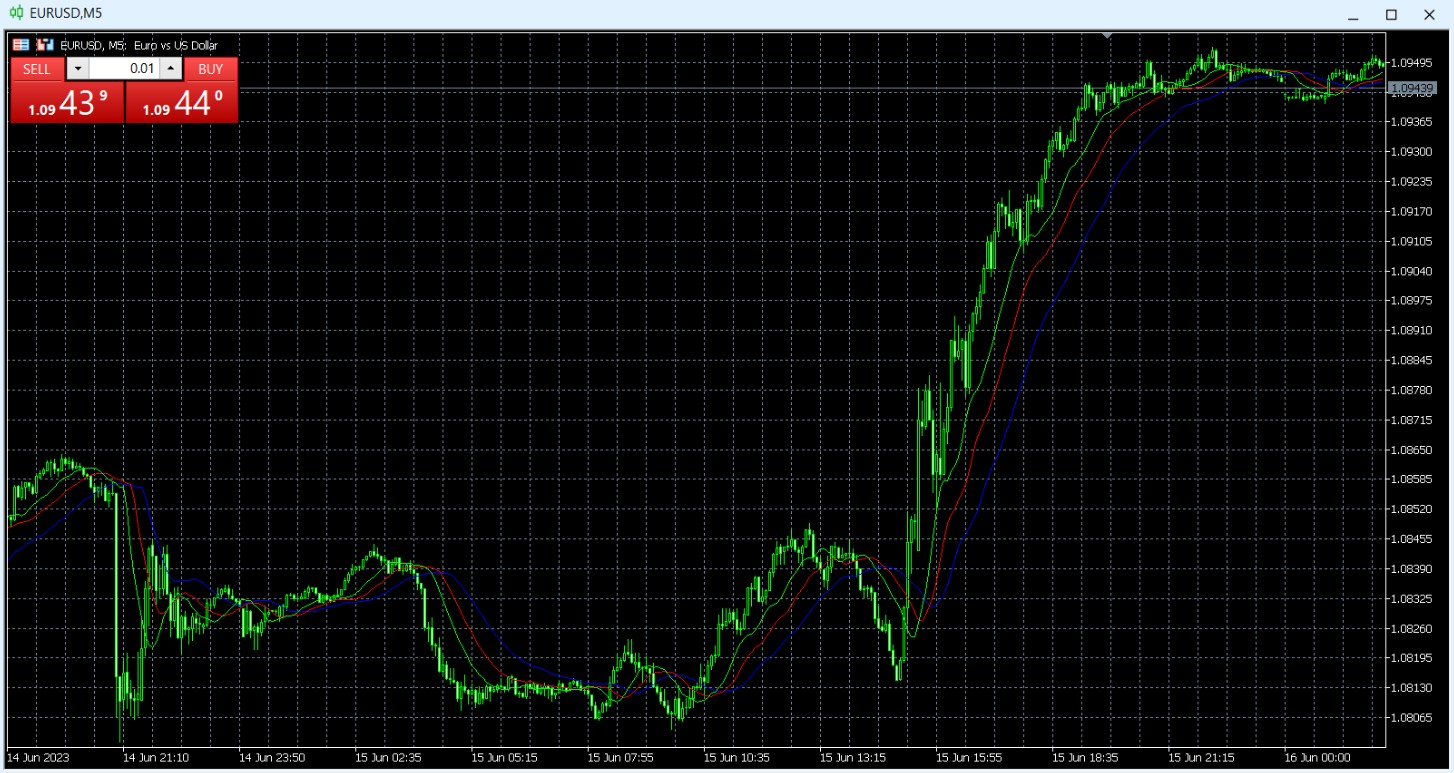
When the lines are closely entangled, the alligator is assumed to be sleeping. Traders generally avoid trading during the sleeping phase and enter a position when the lines spread out from an intersection, signalling the awakening of the alligator. This suggests the emergence of an uptrend or downtrend, particularly if the non-trendy phase persisted for a considerable time.
The Alligator indicator is highly effective in capturing trends and their subsequent price movements. It provides traders with clear visual cues indicating when to enter and exit trades. By observing the convergence and divergence of the three moving averages, traders can identify potential trend reversals and take advantage of profitable trading opportunities.
Money Flow Index (MFI)
The MFI indicator is a valuable tool for traders as it helps identify market extremes and potential turning points. It is a technical oscillator that incorporates volume and price action to identify potential reversal opportunities in ranging markets. Rated on a scale from 0 to 100, the MFI assesses market conditions and determines whether the market is overbought (MFI reading above 80) or oversold (MFI reading below 20). Traders can use this information to anticipate reversals and adjust their trading strategies accordingly.
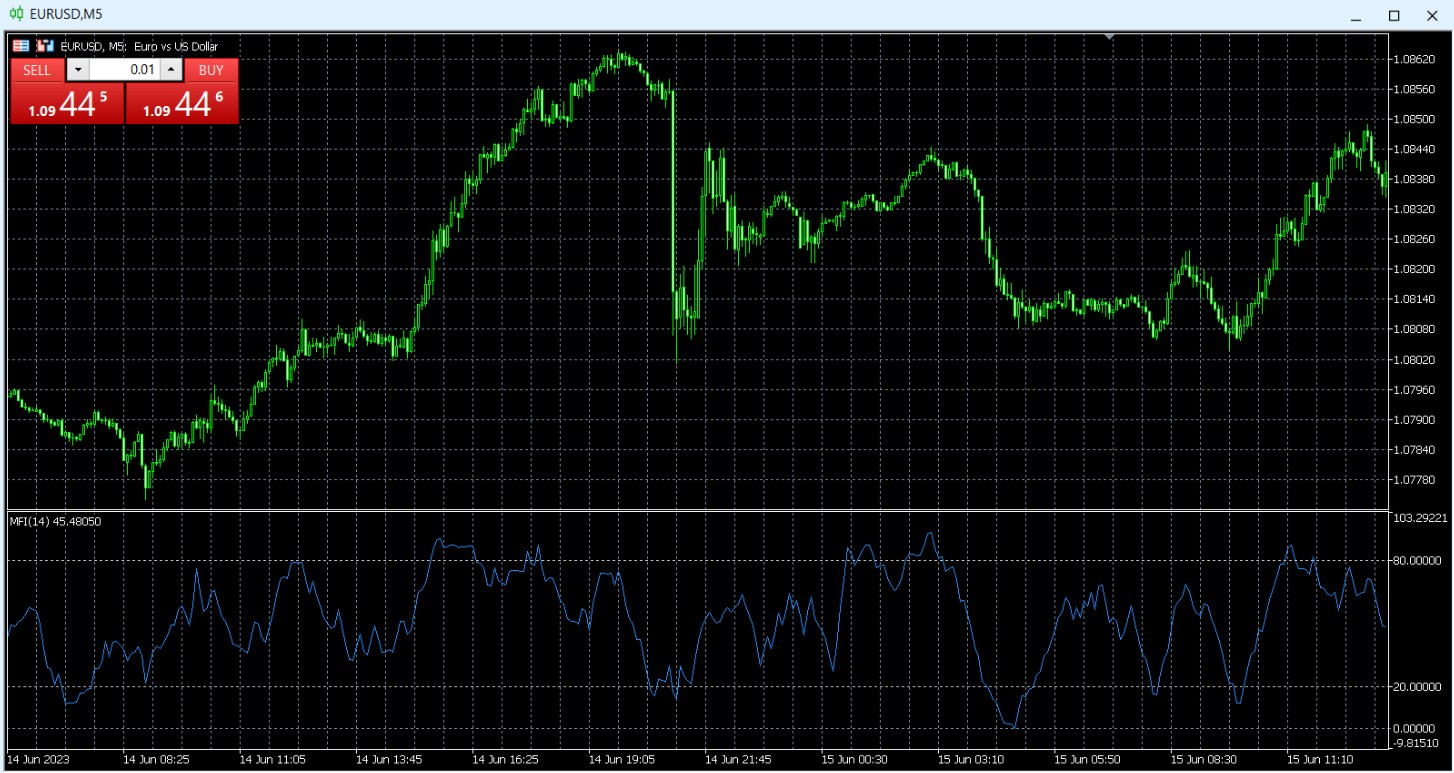
When the MFI indicates an overbought condition, where the reading is above 80, it suggests that the market may be due for a downward correction or reversal. Conversely, an oversold condition, with the MFI reading below 20, indicates a potential upward correction or reversal. Traders can use these signals to enter or exit trades, taking advantage of the market's shift in momentum.
Fibonacci Bar Indicator
Fibonacci Ratios and Pivot Point Support and Resistance are renowned tools among Forex traders. The Fibonacci Bar indicator draws Fibonacci levels based on the latest bar on the chart, providing traders with updated levels as new candlesticks form.
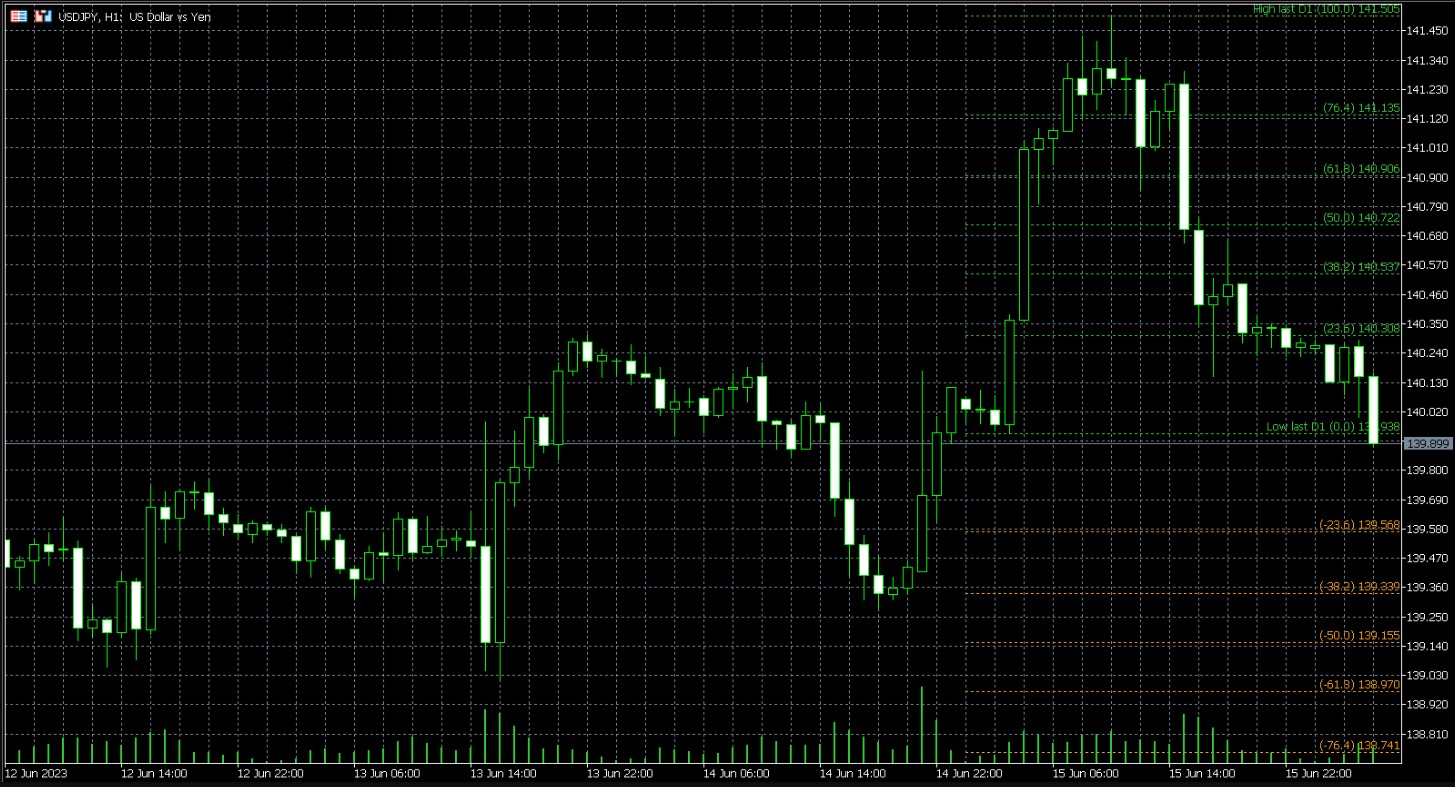
The Fibonacci Bar indicator automatically plots these levels on the chart, saving traders time and effort in manual calculations. By combining the indicator's Fibonacci levels with other technical analysis tools, traders can confirm potential entry and exit points, increasing the accuracy of their trading decisions.
Fibonacci levels are based on mathematical ratios that have proven to be significant in financial markets. This indicator is particularly useful for those who rely on Fibonacci retracement levels for making trading decisions. Traders use these levels to identify potential support and resistance areas where price may bounce or reverse.
Cronex Impulse MACD Indicator
Cronex Impulse MACD is a stable and reliable MT5 indicator. It measures the crossovers and separation between two moving averages, offering insights into the strength of trends. With its smooth oscillation, Cronex Impulse MACD helps traders assess mid to longer-term trends, filtering out market noise that can impede accurate analysis.
The MACD (Moving Average Convergence Divergence) indicator is a widely used tool in technical analysis. It consists of two lines, the MACD line and the signal line, as well as a histogram that represents the difference between these lines. The Cronex Impulse MACD indicator further enhances the functionality of the MACD by emphasizing trend strength through the measurement of moving average crossovers and their separation.
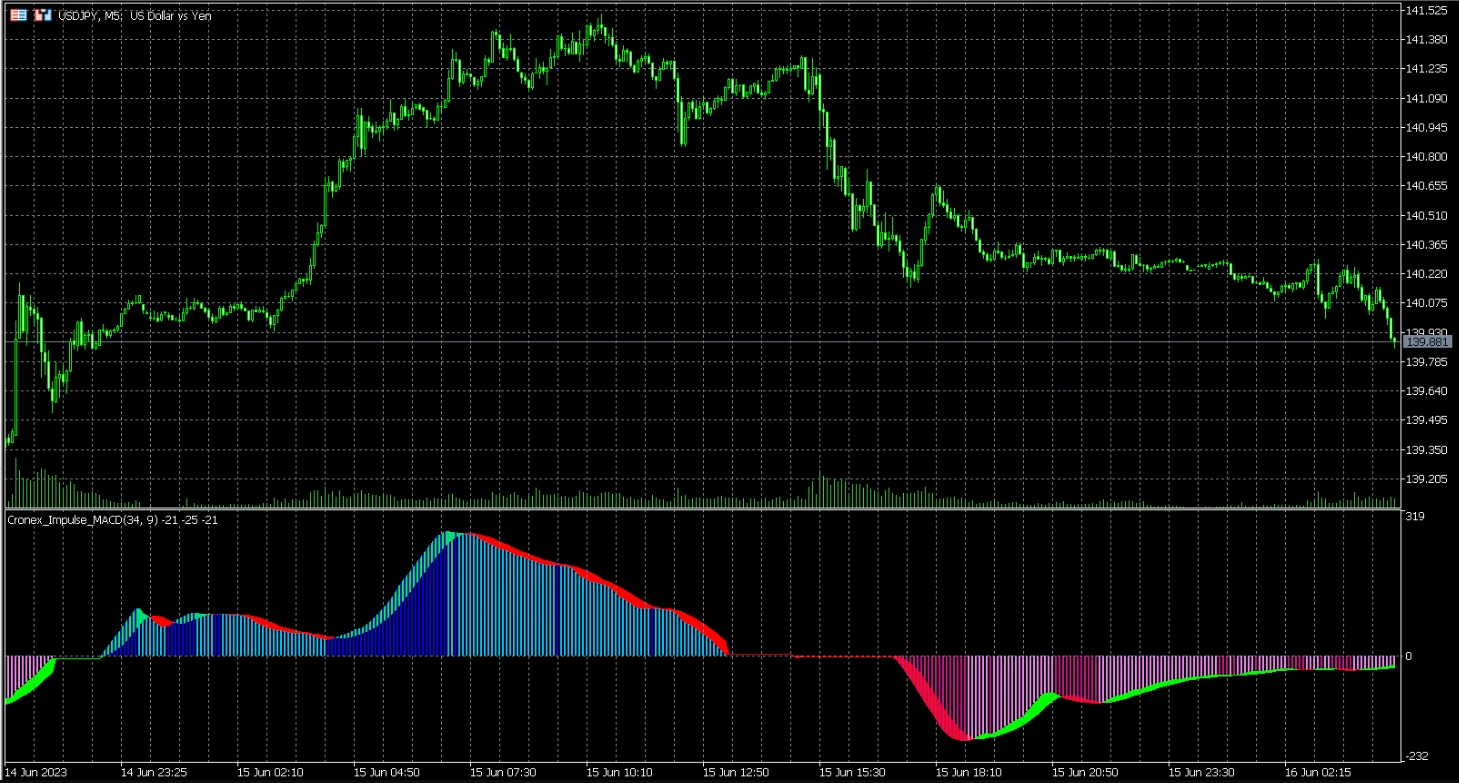
Traders can interpret the Cronex Impulse MACD indicator by analyzing the crossovers between the two moving averages (shown in tangency with the MACD histogram). A larger separation indicates a stronger trend, while a narrowing separation may indicate a potential weakening or reversal of the trend. By combining this information with other technical analysis tools, traders can make well-informed trading decisions based on trend strength and potential market movements.
Bollinger Bands
Bollinger Bands are volatility indicators that aid traders in identifying potential breakouts and trend reversals. Bollinger Bands provide valuable insights into price volatility and potential trading chances by incorporating a moving average and two standard deviation bands positioned both above and below the average.
The middle band represents the 20-period simple moving average, which provides a reference point for the average price over the specified period. The upper and lower bands are calculated based on the standard deviation of price movements, which widens or narrows with changes in volatility.
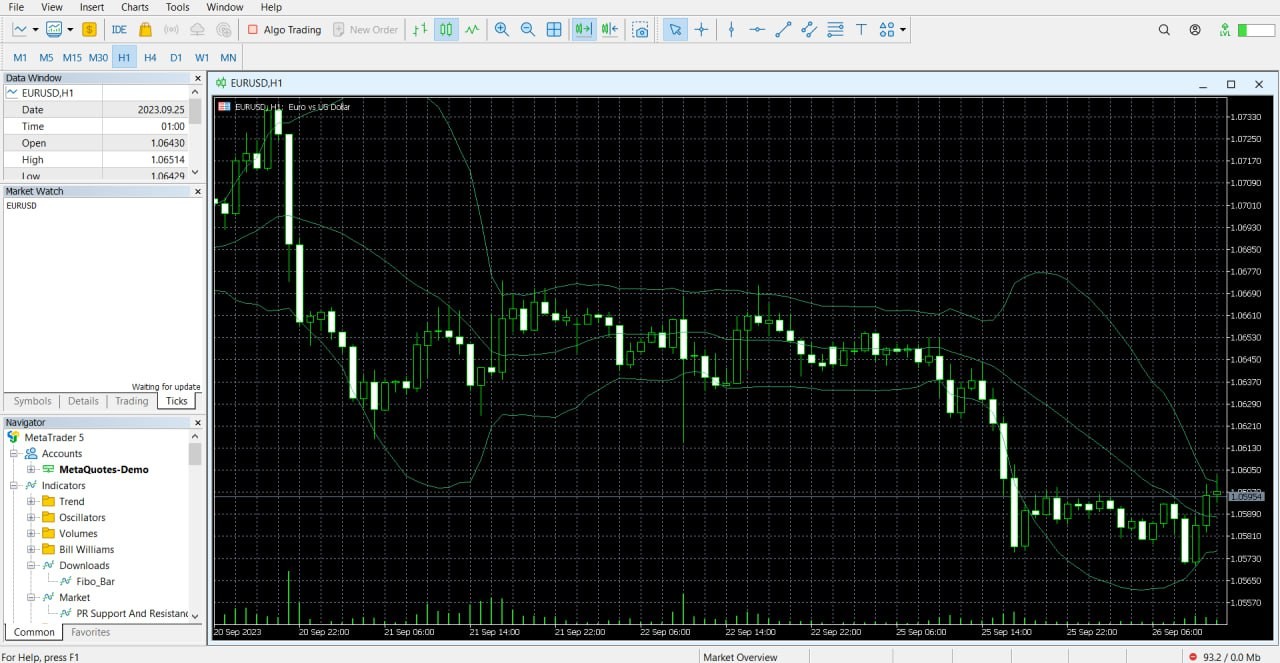
Traders use Bollinger Bands in various ways. Traditionally, when the price approaches the upper band, it indicates that the market is overbought, suggesting a potential downward correction or reversal. Conversely, when the price approaches the lower band, it indicates that the market is oversold, suggesting a potential upward correction or reversal.
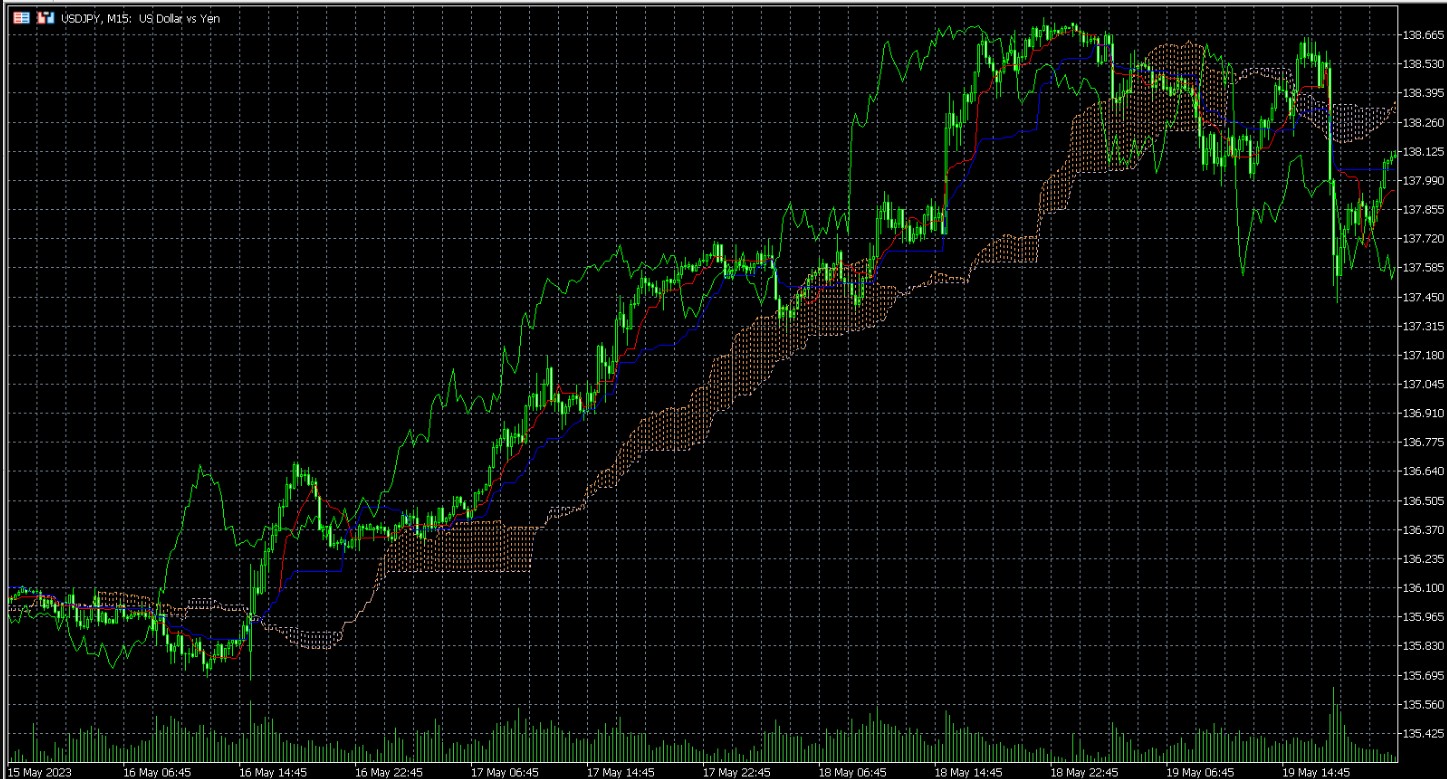
Ichimoku Kinko Hyo
The Ichimoku Kinko Hyo, commonly referred to as Ichimoku, is a comprehensive technical analysis tool developed by Japanese journalist Goichi Hosoda. It provides traders with a holistic view of price action by incorporating several components, including a moving average, support and resistance levels, and cloud charts.
The Ichimoku indicator consists of five lines: the Tenkan-sen (Conversion Line), the Kijun-sen (Base Line), the Senkou Span A (Leading Span A), the Senkou Span B (Leading Span B), and the Chikou Span (Lagging Span). These lines work together to generate trading signals and provide insights into the overall market trend.
The Tenkan-sen and Kijun-sen lines function as moving averages, with the former reflecting shorter-term price momentum and the latter representing medium-term price momentum. When the Tenkan-sen crosses above the Kijun-sen, it generates a bullish signal, indicating a potential buying opportunity. In contrast, when the Tenkan-sen moves downwards and intersects with the Kijun-sen, it produces a bearish indication, suggesting a possible chance to sell.
The Senkou Span A and Senkou Span B create a cloud-like area on the chart, known as the Kumo. The Kumo represents support and resistance levels and helps traders identify potential trend reversals. When the price is above the Kumo, it indicates a bullish trend, and when the price is below the Kumo, it suggests a bearish trend.
The Chikou Span is the lagging line, plotted on the chart but shifted back by a specific period. It helps traders assess the strength of a signal by comparing the current price to historical price action.
Traders can leverage the Ichimoku indicator to identify trends, assess momentum, and determine potential entry and exit points in the market. It is a versatile tool that can be used across different timeframes and markets, providing a comprehensive analysis of price action.
Parabolic SAR
The Parabolic SAR (Stop and Reverse) is a popular trend-following indicator developed by J. Welles Wilder. Its primary function is to signal potential trend reversals, allowing traders to exit existing positions and potentially enter new trades.
The Parabolic SAR consists of a series of dots placed either above or below the price chart. These dots represent potential stop-loss levels that traders can use to manage their positions.
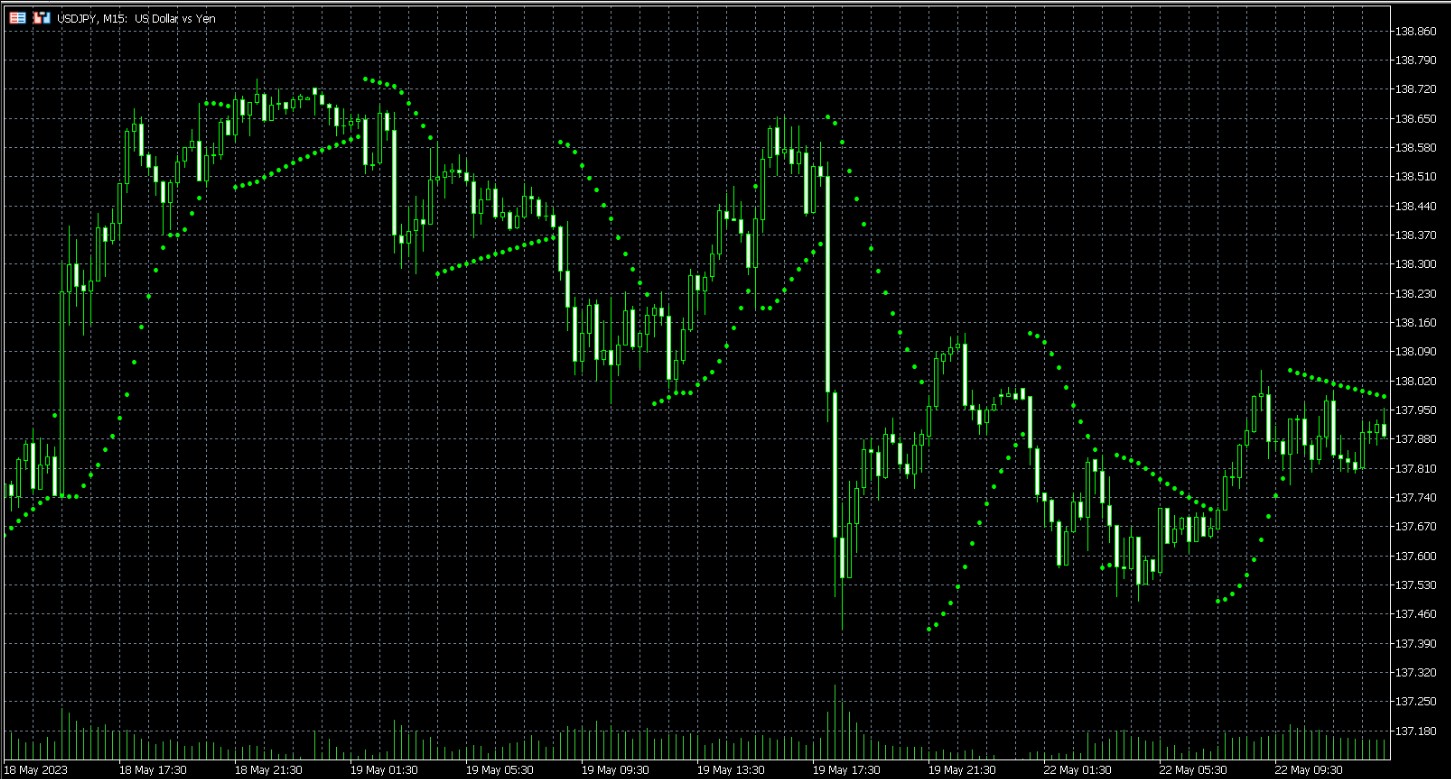
When the dots are below the price, it suggests an uptrend, and when the dots are above the price, it suggests a downtrend.
The Parabolic SAR dots move dynamically as the price evolves. During an uptrend, the dots gradually rise, providing a trailing stop-loss level. Conversely, during a downtrend, the dots gradually decline, offering a potential resistance level.
Average Directional Movement Index (ADX)
The Average Directional Movement Index (ADX) is a popular technical indicator designed to determine the presence and strength of a trend. Developed by J. Welles Wilder, the ADX consists of three lines: the Positive Directional Indicator (+DI), the Negative Directional Indicator (-DI), and the ADX line itself.
The +DI line measures the strength of upward price movement, while the -DI line measures the strength of downward price movement. These lines, combined with the ADX line, provide traders with insights into the overall market trend and potential buying or selling opportunities.
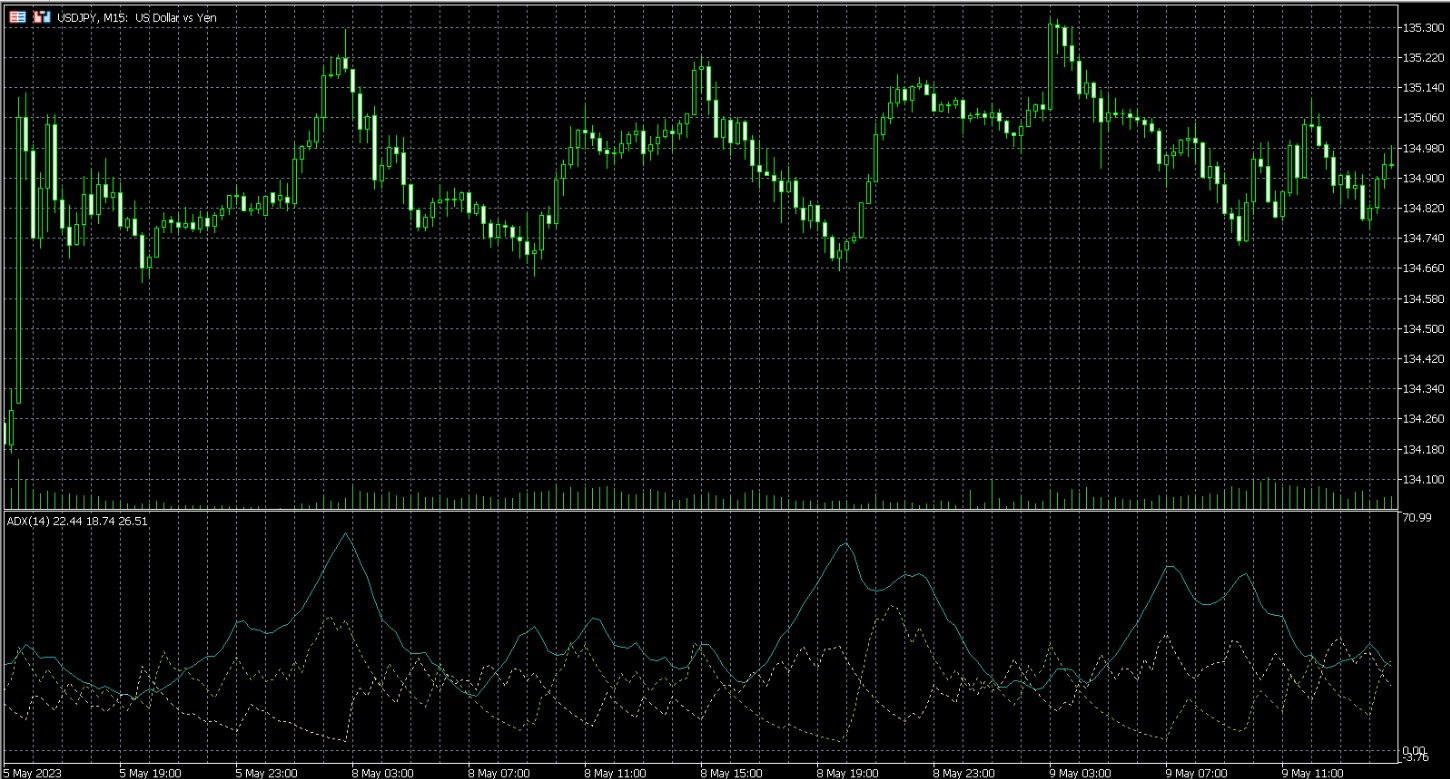
When the ADX line is rising and the +DI line is higher than the -DI line, it suggests a potential buying opportunity. This indicates that the upward price movement is dominant and gaining strength. Conversely, when the ADX line is rising and the -DI line is higher than the +DI line, it may indicate a selling opportunity. This suggests that the downward price movement is dominant and gaining strength.
Traders can also analyze the ADX line in relation to the other two lines to assess market conditions accurately. For example, when the ADX line is above 25, it suggests a strong trend, whether bullish or bearish. If the ADX line is below 25, it indicates a weak or non-existent trend.
Commodity Channel Index (CCI)
The CCI is a versatile momentum oscillator developed by Donald Lambert, measuring the difference between an asset's current price and its average over a specific period. It identifies overbought conditions (values above +100) and oversold levels (below -100), helping traders spot potential trend reversals.
Calculation steps:
Calculate the typical price (average of high, low, and close).
Find the mean deviation from this average.
Divide the price difference by a constant multiple of the mean deviation.

Key features
Divergences. Bullish divergence (higher CCI lows with lower price lows) signals potential upward reversals, while bearish divergence (lower CCI highs with higher price highs) indicates possible downward shifts.
Usage. Effective in trending markets, it helps confirm trading signals when combined with other tools.
While highly useful, CCI may generate false signals in choppy markets, so pairing it with strong risk management is essential for informed trading decisions.
Forex Breakout Zones
The Forex Breakout Zones indicator designed for Metatrader 5 is a powerful tool that assists traders in identifying compelling buy/sell zones on the chart, which can be effectively utilized for breakout entry signals.
When applied to the main chart window, the indicator displays two horizontal lines that serve as reference points for both buy and sell breakout trades. These lines play a crucial role in deter mining optimal entry points for traders.
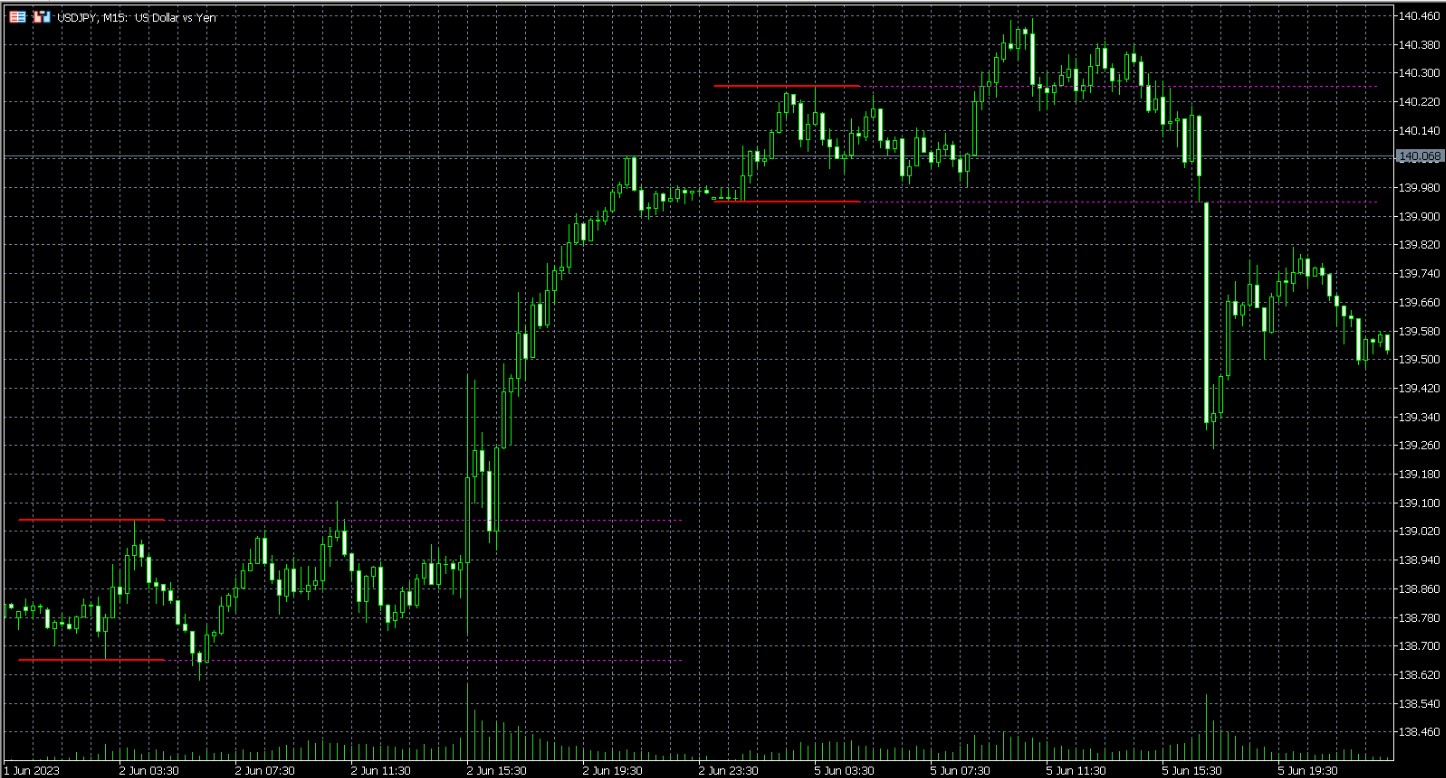
To generate buy signals, traders should observe the candlestick closing above the upper breakout line. This indicates a potential breakout and presents an opportunity to open a buy trade. Conversely, for sell signals, traders should look for the candlestick closing below the lower breakout line, suggesting a breakout in the downward direction and signaling the initiation of a sell trade.
One of the key advantages of the Forex Breakout Zones indicator is its versatility. It is equally effective across all currency pairs, including major currency pairs, minor, and exotic pairs. This wide applicability enables traders to utilize the indicator across various markets, increasing its usefulness and potential profitability.
How do Forex indicators help?
Forex indicators are essential tools that help traders analyze market trends, identify trading opportunities, and make informed decisions. By applying mathematical calculations to historical price and volume data, these indicators offer insights into market behavior, aiding traders in predicting future price movements.
There are various types of Forex indicators, each serving a specific purpose. Trend indicators, such as moving averages, help determine the market’s direction. Momentum indicators, like the Relative Strength Index (RSI), measure the speed and change of price movements. Volatility indicators, such as Bollinger Bands, assess the rate of price fluctuations. By combining different indicators, traders can create trading strategies tailored to their specific needs.
Which broker to choose for trading on MT5?
When choosing a broker for trading on MT5, it’s essential to consider several key features. First, ensure the broker is well-regulated to guarantee a secure trading environment. Additionally, VPN support can be crucial for maintaining privacy and accessing trading platforms from various regions. A Free VPS service is highly beneficial for automation, allowing you to run trading algorithms without interruption. Finally, look for brokers that offer low ECN/STP spreads, as this can significantly reduce trading costs and enhance profitability.
| MT5 | Min. deposit, $ | Max. leverage | ECN Spread EUR/USD, avg pips | Copy trading | EA builder | Autochartist | Free VPS | Open an account | |
|---|---|---|---|---|---|---|---|---|---|
| Yes | No | 1:500 | 0,1 | Yes | Yes | Yes | Yes | Open an account Your capital is at risk.
|
|
| Yes | No | 1:200 | 0,15 | Yes | Yes | Yes | Yes | Open an account Your capital is at risk. |
|
| Yes | 100 | 1:50 | 0,2 | Yes | Yes | Yes | Yes | Study review | |
| Yes | 1000 | 1:400 | 0,05 | Yes | No | No | Yes | Study review | |
| Yes | 1 | 1:30 | 0,10 | Yes | No | Yes | Yes | Study review |
What are MT5 pros and cons
Let's explore the main pros and cons of using MT5 for Forex trading:
- Pros
- Cons
Multi-asset support. MT5 allows trading in Forex, stocks, commodities, and cryptocurrencies, enabling portfolio diversification within a single platform.
Advanced analytical tools. The platform provides 38 technical indicators and 21 timeframes, helping traders perform in-depth market analysis.
Improved order management. MT5 supports additional order types like stop-limit orders and offers features such as depth of market (DOM) for better trade execution.
Faster execution. Enhanced processing capabilities ensure quicker trade executions, crucial in volatile market conditions.
Built-in economic calendar. An integrated economic calendar keeps traders informed about key market events and news releases.
Learning curve for beginners. Advanced features can be overwhelming for new traders, requiring more time to learn and adapt.
Incompatibility with MT4 tools. Expert advisors (EAs) and custom indicators from MT4 are not compatible with MT5, necessitating new tools or adjustments.
Limited broker support. Not all brokers support MT5, limiting choices for traders interested in its advanced features.
Resource intensive. MT5’s advanced functionalities may require more computing power, potentially affecting performance on older devices.
You can do better by using custom settings for specific market conditions

Most traders stick with basics like moving averages or MACD, but you can do better by using custom settings for specific market conditions. For instance, instead of the usual Bollinger Bands setting, try changing the standard deviation to 1.5 to spot tighter price ranges earlier. This can help you catch breakouts before they become widely noticed. Similarly, pair the Average Directional Movement Index (ADX) with the Parabolic SAR. If the ADX goes over 25 and the Parabolic SAR shows the same trend direction, it confirms the trend more clearly.
Another powerful method is using the Volume-Weighted Average Price (VWAP) for intraday Forex trading. Traders often ignore this tool, but it can highlight major buying or selling zones. Try it on short timeframes like 5 or 15 minutes. If the price stays above VWAP, buyers are likely dominating. If it drops below, sellers are probably in control. This way, you filter out fake signals and focus on genuine trends.
Summary
MT5 indicators like Bollinger Bands, Ichimoku Kinko Hyo, and Parabolic SAR enhance Forex trading by identifying trends, reversals, and optimal trade points. Combined with other analysis tools, they improve decision-making and boost success rates. MT5 also offers advanced customization and fundamental analysis features, though its complexity may pose challenges for beginners. Leveraging the right indicators strategically can maximize your trading potential.
FAQs
How to find the best MT5 indicators for my strategy?
Test different indicators on historical price data to determine how they align with your trading style and preferred time frame.
Are any of these indicators particularly suitable for trending or ranging markets?
Trend-focused tools like ADX, MFI, and Parabolic SAR are ideal for trending markets. Oscillators such as RSI, CCI, and Bollinger Bands excel in range-bound markets, while Ichimoku works well in both.
What are the benefits of MT5 over MT4?
MT5 offers advanced features, including multi-asset trading, a faster multithreading strategy tester, and enhanced customization options, making it more versatile than MT4.
Is MT5 trading available on mobile too?
Yes, MT5 is available as a web trader and mobile app, providing seamless access on smartphones, tablets, and desktops.
Related Articles
Team that worked on the article
Parshwa is a content expert and finance professional possessing deep knowledge of stock and options trading, technical and fundamental analysis, and equity research. As a Chartered Accountant Finalist, Parshwa also has expertise in Forex, crypto trading, and personal taxation. His experience is showcased by a prolific body of over 100 articles on Forex, crypto, equity, and personal finance, alongside personalized advisory roles in tax consultation.
Chinmay Soni is a financial analyst with more than 5 years of experience in working with stocks, Forex, derivatives, and other assets. As a founder of a boutique research firm and an active researcher, he covers various industries and fields, providing insights backed by statistical data. He is also an educator in the field of finance and technology.
As an author for Traders Union, he contributes his deep analytical insights on various topics, taking into account various aspects.
Mirjan Hipolito is a journalist and news editor at Traders Union. She is an expert crypto writer with five years of experience in the financial markets. Her specialties are daily market news, price predictions, and Initial Coin Offerings (ICO).
Price action trading is a trading strategy that relies primarily on the analysis of historical price movements and patterns in financial markets, such as stocks, currencies, or commodities. Traders who use this approach focus on studying price charts, candlestick patterns, support and resistance levels, and other price-related data to make trading decisions.
ADX (Average Directional Index) is a technical indicator used in financial analysis to measure the strength and momentum of a price trend. It quantifies the degree of trendiness in a market, with higher ADX values indicating stronger trends and lower values suggesting weaker trends.
Trade execution is knowing how to place and close trades at the right price. This is the key to turning your trading plans into real action and has a direct impact on your profits.
An ECN, or Electronic Communication Network, is a technology that connects traders directly to market participants, facilitating transparent and direct access to financial markets.
Bollinger Bands (BBands) are a technical analysis tool that consists of three lines: a middle moving average and two outer bands that are typically set at a standard deviation away from the moving average. These bands help traders visualize potential price volatility and identify overbought or oversold conditions in the market.


-
 Afghanistan
-
 Albania
-
 Algeria
-
 Argentina
-
 Armenia
-
 Australia
-
 Austria
-
 Azerbaijan
-
 Bahamas
-
 Bahrain
-
 Bangladesh
-
 Belgium
-
 Botswana
-
 Brazil
-
 Brunei
-
 Bulgaria
-
 Burma
Burma
-
 Cambodia
-
 Cameroon
-
 Canada
-
 Chile
Chile
-
 China
China
-
 Colombia
-
 Costa Rica
-
 Cote d'Ivoire
-
 Croatia
-
 Cyprus
-
 Czech Republic
-
 Denmark
-
 Dominican Republic
-
 Ecuador
-
 Egypt
Egypt
-
 Estonia
-
 Eswatini
-
 Ethiopia
-
 Finland
-
 France
-
 Georgia
-
 Germany
-
 Ghana
Ghana
-
 Greece
-
 Haiti
Haiti
-
 Hong Kong
-
 Hungary
-
 India
India
-
 Indonesia
-
 Iran, Islamic republic
-
 Iraq
Iraq
-
 Ireland
-
 Israel
-
 Italy
Italy
-
 Jamaica
-
 Japan
Japan
-
 Jordan
-
 Kazakhstan
-
 Kenya
Kenya
-
 Korea
Korea
-
 Kuwait
-
 Kyrgyzstan
-
 Laos
Laos
-
 Latvia
-
 Lebanon
-
 Libyan Arab Jamahiriya
-
 Lithuania
-
 Luxembourg
-
 Macedonia
-
 Madagascar
-
 Malaysia
-
 Malta
Malta
-
 Mauritius
-
 Mexico
-
 Moldova
-
 Mongolia
-
 Montenegro
-
 Morocco
-
 Mozambique
-
 Namibia
-
 Nepal
Nepal
-
 Netherlands
-
 Nigeria
-
 Norway
-
 Oman
Oman
-
 Pakistan
-
 Palestine
-
 Papua New Guinea
-
 Peru
Peru
-
 Philippines
-
 Poland
-
 Portugal
-
 Puerto Rico
-
 Qatar
Qatar
-
 Romania
-
 Rwanda
-
 Saudi Arabia
-
 Serbia
-
 Singapore
-
 Slovakia
-
 Slovenia
-
 Somalia
-
 South Africa
-
 Spain
Spain
-
 Sri Lanka
-
 Sweden
-
 Switzerland
-
 Syrian Arab Republic
-
 Taiwan
-
 Tajikistan
-
 Tanzania, United Republic Of
-
 Thailand
-
 Trinidad and Tobago
-
 Tunisia
-
 Turkey
-
 UAE
UAE
-
 Uganda
-
 Ukraine
-
 United Kingdom
-
United States
-
 Uzbekistan
-
 Venezuela
-
 Vietnam
-
 Yemen
Yemen
-
 Zambia
-
 Zimbabwe
- Forex
- Crypto
