7 Best Stock Charting Apps
Here are the best stock charting software to use in 2026:
Trade Ideas – Real-time alerts, AI-driven recommendations, and backtesting capabilities.
TrendSpider – Advanced technical analysis tools and unique Smart Charts feature.
Tickeron – AI-powered trading with a community-driven perspective for insightful decisions.
TradingView – Over 100 indicators, intelligent drawing tools, and a social community.
BlackBoxStocks – Real-time scanning, trade alerts, and a powerful stock screener.
MetaStock – Extensive indicators, candle pattern recognition, and real-time data options.
Thinkorswim – Customizable platform with advanced tools for options and equity traders.
In the dynamic world of stock trading, having access to the right tools can make all the difference. In this article, the experts at TU will explore the various charting softwares that traders can use to enhance their trading experience.
What is a stock charting software?
A stock charting software serves as a robust tool for visually representing stock market data, offering comprehensive visualizations that facilitate the analysis of trends, patterns, and indicators. This method of tracking a company's stock performance over time provides vital data points such as price, volume, and moving averages. Additionally, it includes technical indicators like support and resistance levels. Stock charting aids traders in identifying potential opportunities, understanding price fluctuations, pinpointing entry and exit points, recognizing emerging trends, assessing risk levels, and formulating effective trading strategies.
By offering insights into a stock's historical performance, charting software empower traders to make well-informed decisions in the complex world of stock trading. It is a valuable tool for traders seeking to navigate the markets successfully. Notably, such software utilize historical market data to create chart patterns that assist in predicting future market movements, identifying support and resistance levels, and promptly recognizing entry and exit points. Various types of stock charting software, including technical and fundamental analysis tools, trading indicators, and price action analysis software, are available.
These software solutions offer valuable insights that complement other trading methods and strategies, enhancing traders' capabilities in the dynamic stock market landscape. Users can also customize the chart type, selecting from options like candlestick, line, and bar charts, and access technical indicators such as MACD and RSI to facilitate their trading decisions.
Best stock charting software to use in 2026
Trade Ideas

Trade Ideas
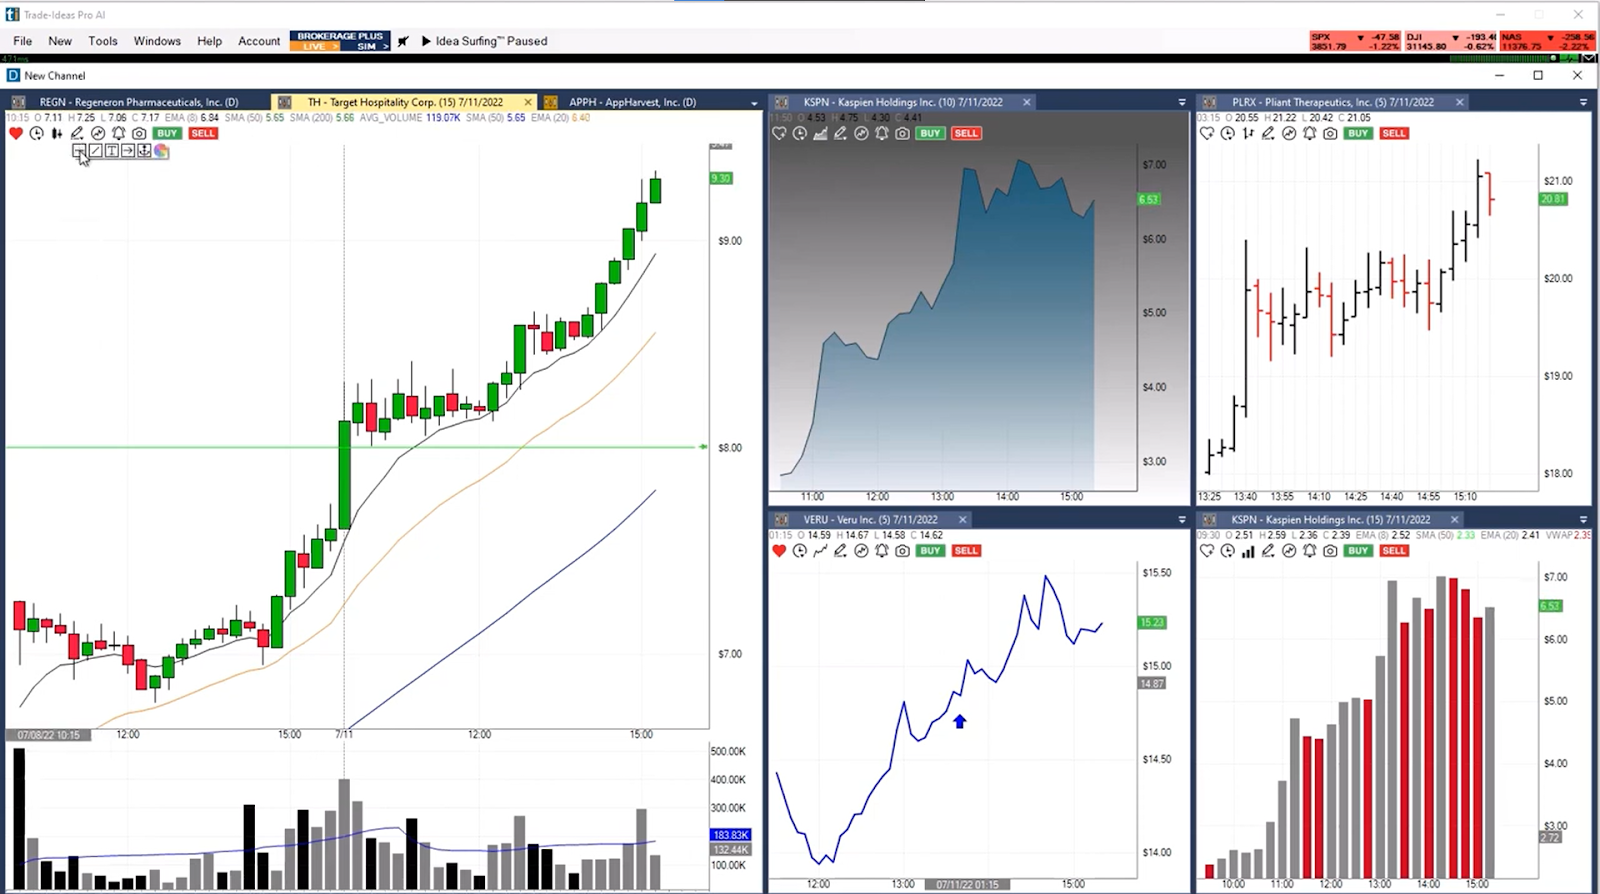
Founded in 2003, Trade Ideas caters to investors, traders, and market professionals. With an array of 310 alerts and 253 filters, it harnesses various data sets, including technical and social media inputs, to pinpoint short-term and swing trading opportunities. Users have the flexibility to create custom formulas as indicators, construct dynamic watch lists, and receive real-time alerts. Trade Ideas also empowers traders with backtesting capabilities, allowing them to simulate and refine their strategies. Notably, it employs an AI-driven assistant named Holly, continuously evaluating technicals, fundamentals, social media, earnings, and more to provide real-time trade recommendations. Holly runs over a million simulated trades daily to identify high-probability investment opportunities.
Users can also access real-time trading ideas overlaid with technical analysis, aiding in risk-reward balanced trades. Trade Ideas offers a comprehensive solution for traders, making it suitable for both long-term investors and active traders. Subscribers can choose to transition to live trading through brokerage integration, including Interactive Brokers, TD Ameritrade, and E-Trade.
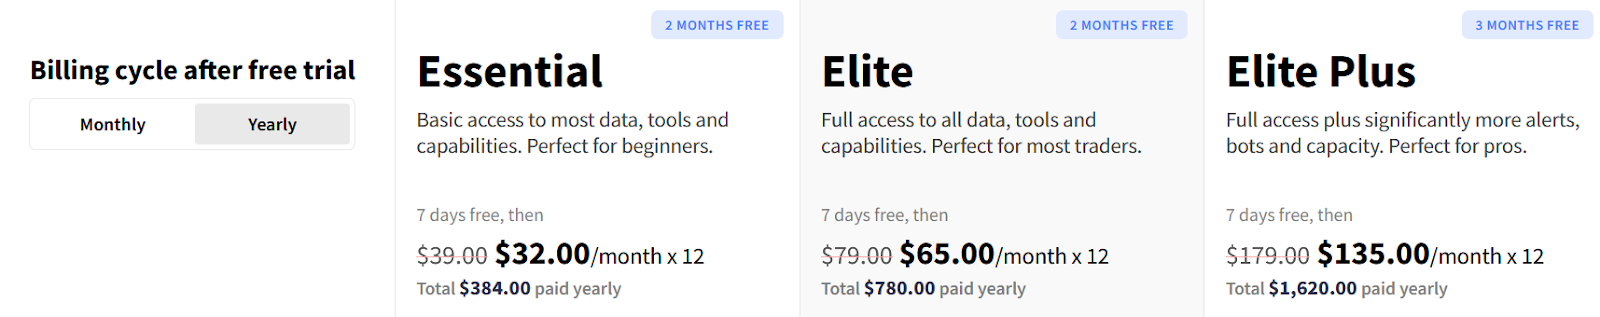
However, Trade Ideas does not offer a free fully functional trial of their application. To access all features, users can choose from their subscription packages, which are as follows
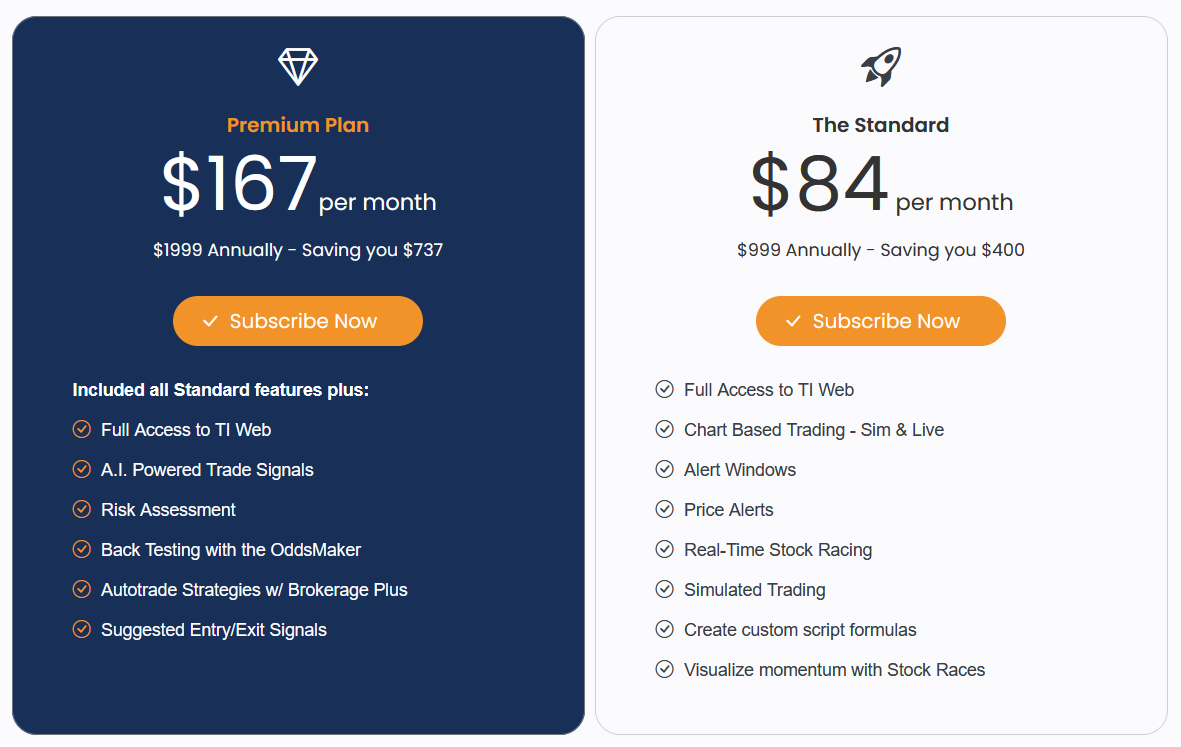
Trade Ideas
TrendSpider

TrendSpider
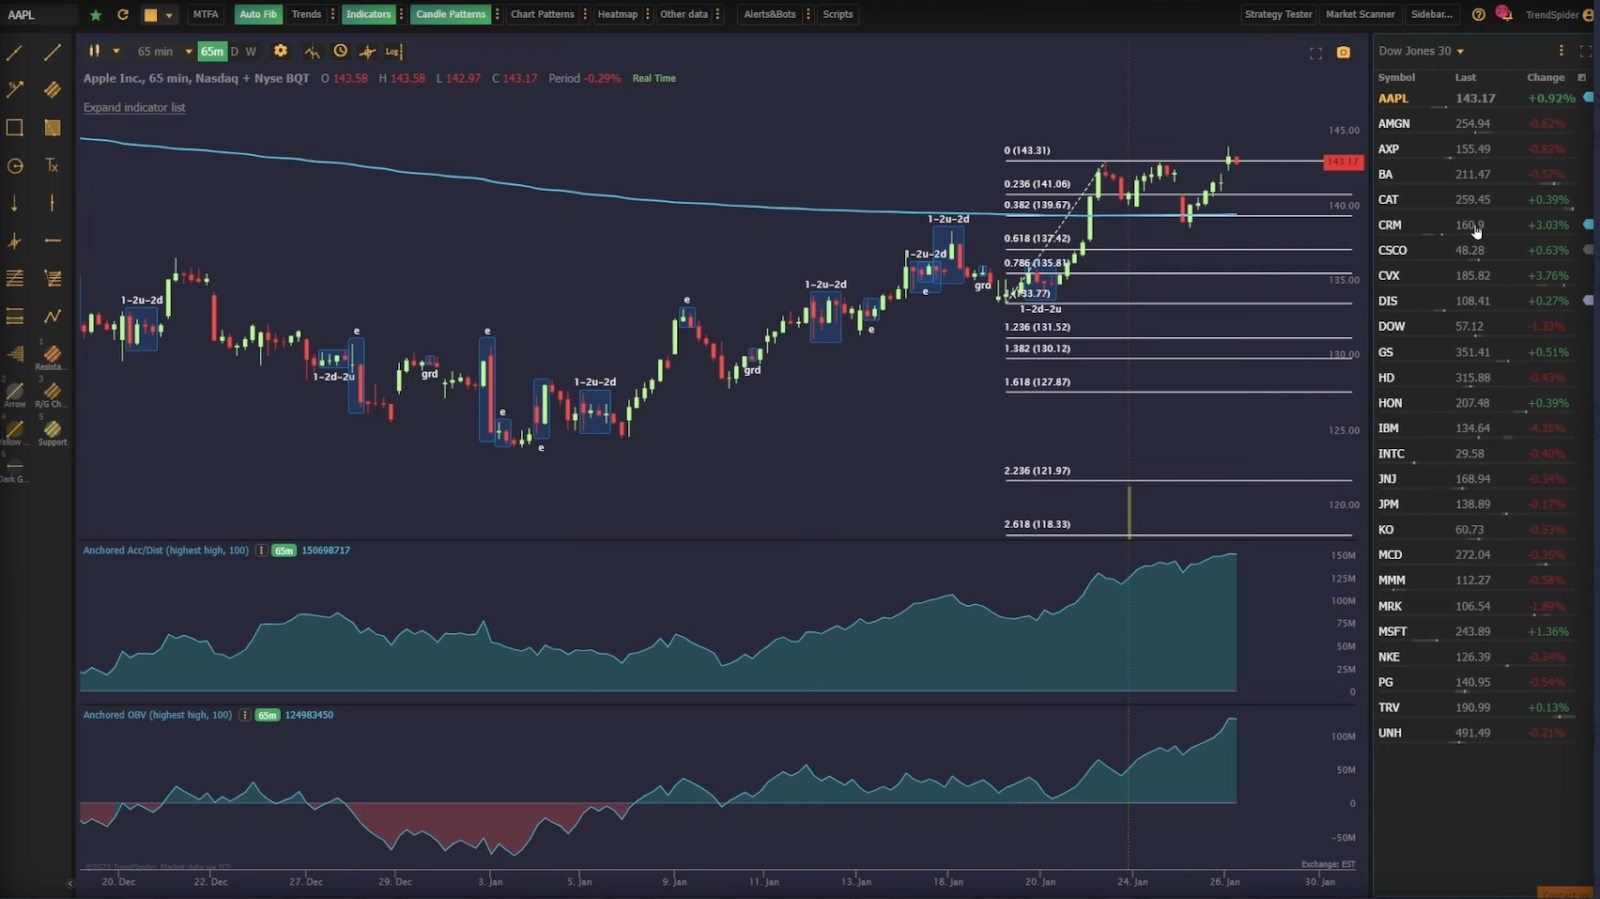
Established in 2016, TrendSpider offers a robust suite of technical analysis tools, streamlining the process of finding, planning, and timing trades with precision. The platform facilitates dynamic watchlist creation through its Market Scanner, spanning various timeframes from 1 minute to 1 month. Users can utilize built-in scanners or design custom ones, backed by real-time market data and over 20 years of historical data. The basic feature list offered by the software is as follows
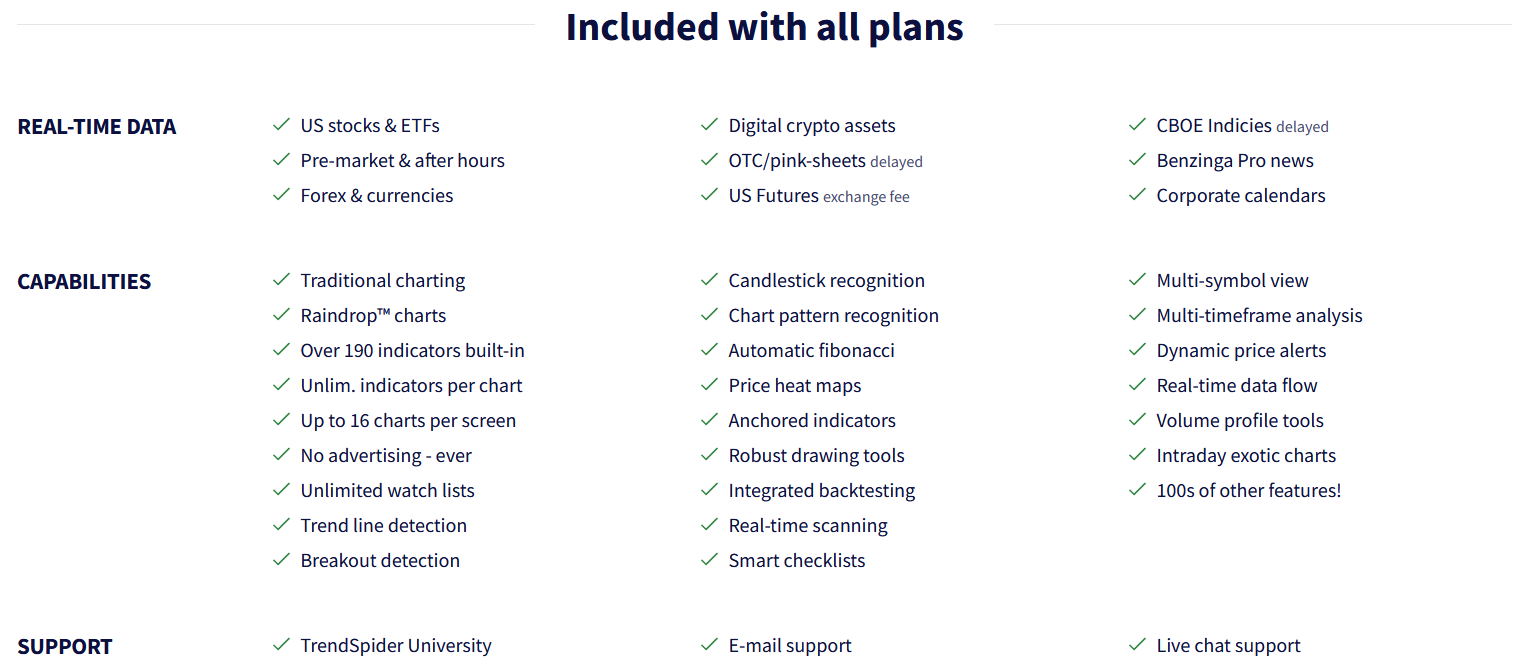
TrendSpider
TrendSpider operates as a web-based platform with cloud-based customization storage. Notable features include Smart Charts, which automates time-consuming aspects of technical analysis, enabling swift analysis for multiple securities. Raindrop Charts® offer a unique visualization of market data by focusing on trading volume at each price level. The platform also provides alternative data offerings, strategy testing, and backtesting capabilities for various trading strategies, allowing users to deploy winning strategies as trading bots with ease. TrendSpider's mobile app and Chrome extension keep traders connected to charts and scanners, while integration with external systems and webhook support enhances customization and automation options.
To help traders assess their compatibility with the software, TrendSpider offers a 7-day trial. Further, the pricing plans for the software are as follows
TrendSpider
Tickeron
Tickeron
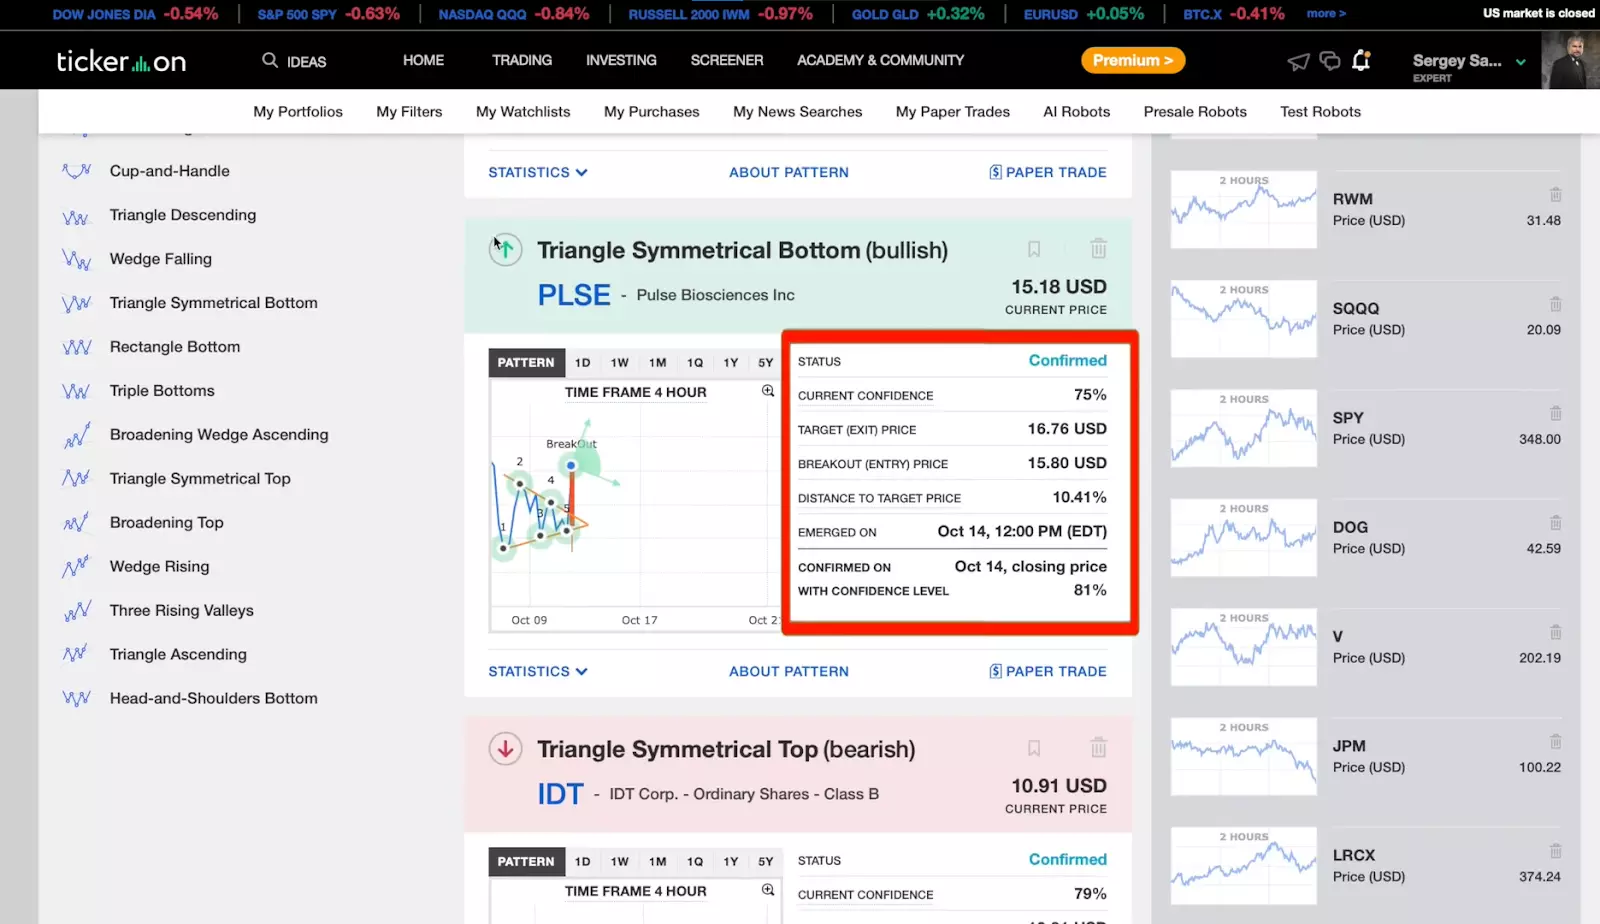
Tickeron's comprehensive platform combines AI-driven insights with the wisdom of human traders, providing valuable trade suggestions, live trading services, and insightful analysis. Established in 2013, the company is headquartered in Nevada and offers a unique blend of artificial and human intelligence in its platform design. Tickeron's trading platform also leverages insights from a community of traders to create a unique marketplace. This innovative approach allows users to compare human and machine perspectives, enhancing trading decision-making.
The Tickeron platform is developed and maintained by SAS Global, a prominent provider of business intelligence services to Fortune 500 companies. The software’s AI-driven robots serve as a highlight, relying on over 100 proven algorithms to recommend effective strategies for various assets, including Forex, cryptocurrencies, stocks, and ETFs. Users can conveniently apply filters to AI robots, specifying transaction duration, desired yield, and trading style, whether swing, intraday, or gap trading. Tickeron simplifies trading by offering a user-friendly interface for executing chosen strategies.
A noteworthy feature is the AI-based trend prediction tool, which leverages market analysis to make predictions based on user-defined criteria such as asset group and trend type. The simplified pricing plans for Tickeron are as follows
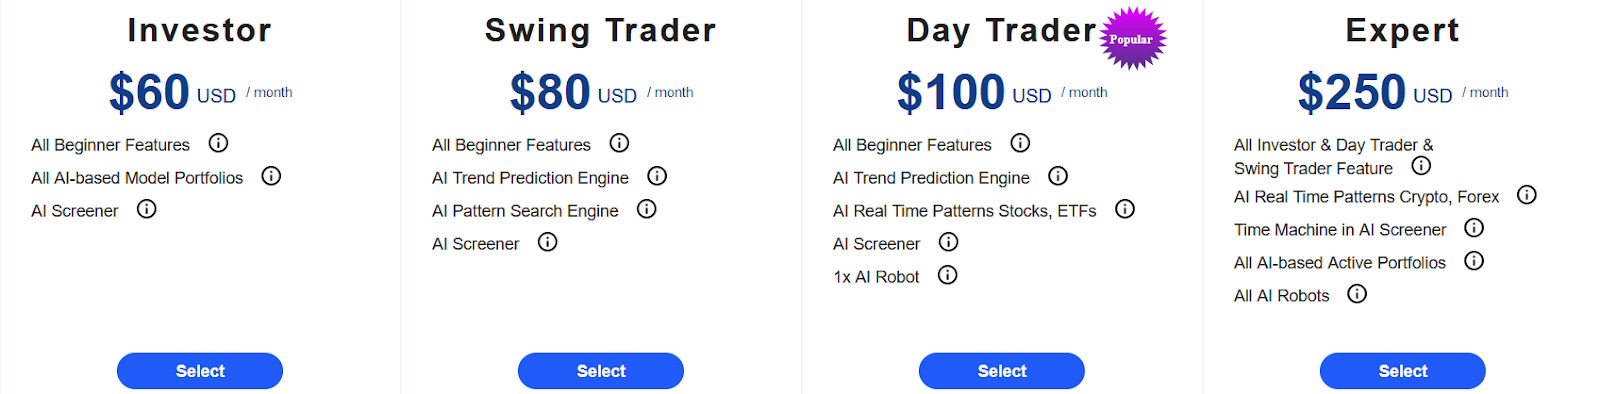
Tickeron
TradingView

TradingView
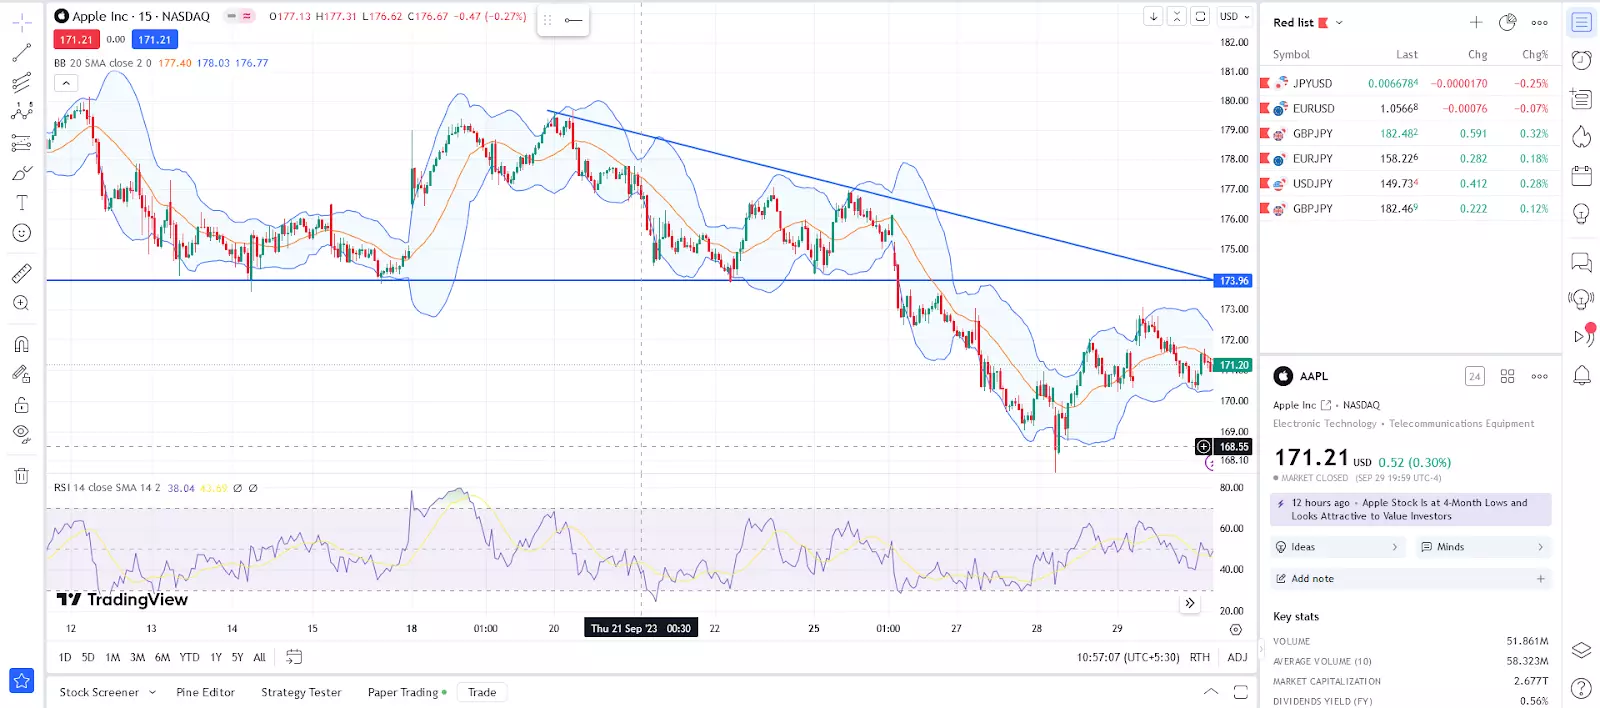
TradingView stands out as a versatile charting and trading platform, offering access to over 100 indicators and a range of intelligent drawing tools. This platform covers global stocks, currencies, and cryptocurrencies, making it a valuable resource for traders worldwide. It provides essential features for chart analysis and trading, including real-time data feeds, historical data, and pre-built popular indicators. TradingView's unique selling point lies in its proprietary Pine Script language, empowering users to create or modify indicators to suit their specific needs. Additionally, a public script library hosts thousands of scripts contributed by the TradingView community.
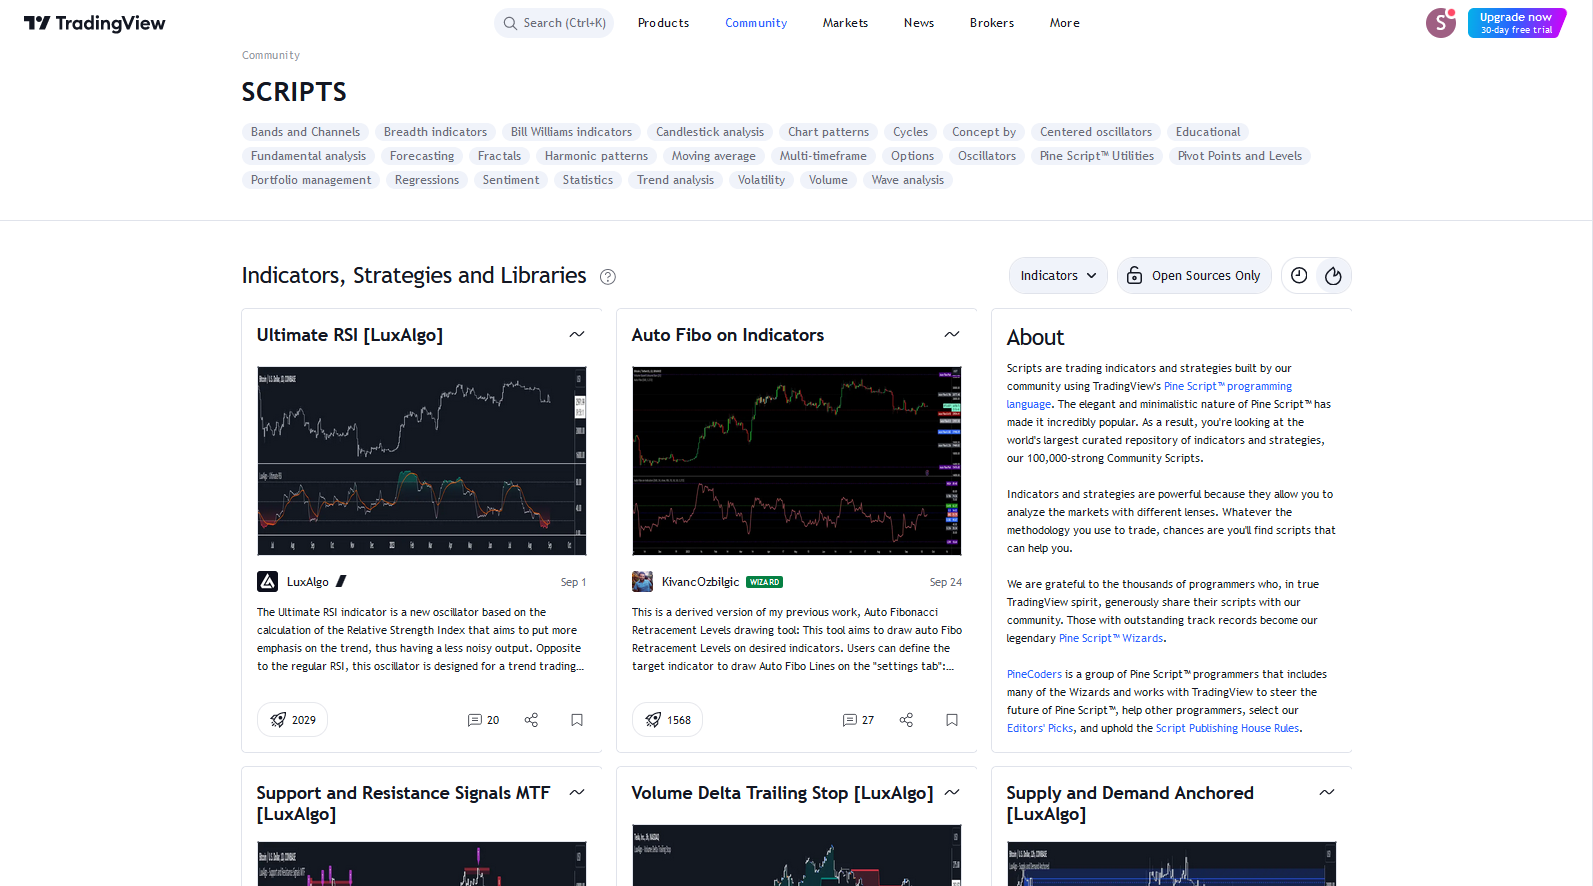
TradingView
While TradingView's interface may appear slightly more complex than some alternatives, it offers a snapshot gauge display that consolidates buying and selling signals for easier interpretation. Furthermore, it grants users the freedom to draw on charts, allowing for notes, price direction arrows, or any other annotations that aid in decision-making. Unlike some charting platforms, TradingView allows multiple charts to be displayed simultaneously, facilitating a comprehensive view of the market.
One of TradingView's distinctive features is its extensive customization options, offering more technical analysis tools than many competitors. This includes 14 chart types, over 90 drawing tools, 20+ timeframes, and over 100 pre-built indicators. Additionally, TradingView stands out by providing the capability to chart fundamental data, offering insights into the influence of a stock's fundamentals on its price action. The platform also has a vast and active trading community, fostering collaborative learning and idea sharing. The pricing plans for TradingView are as follows
Price Basic Pro Pro+ Premium Monthly fee Free forever $14.95 $29.95 $59.95 Annual fee Free forever $155.40 $299.40 $599.40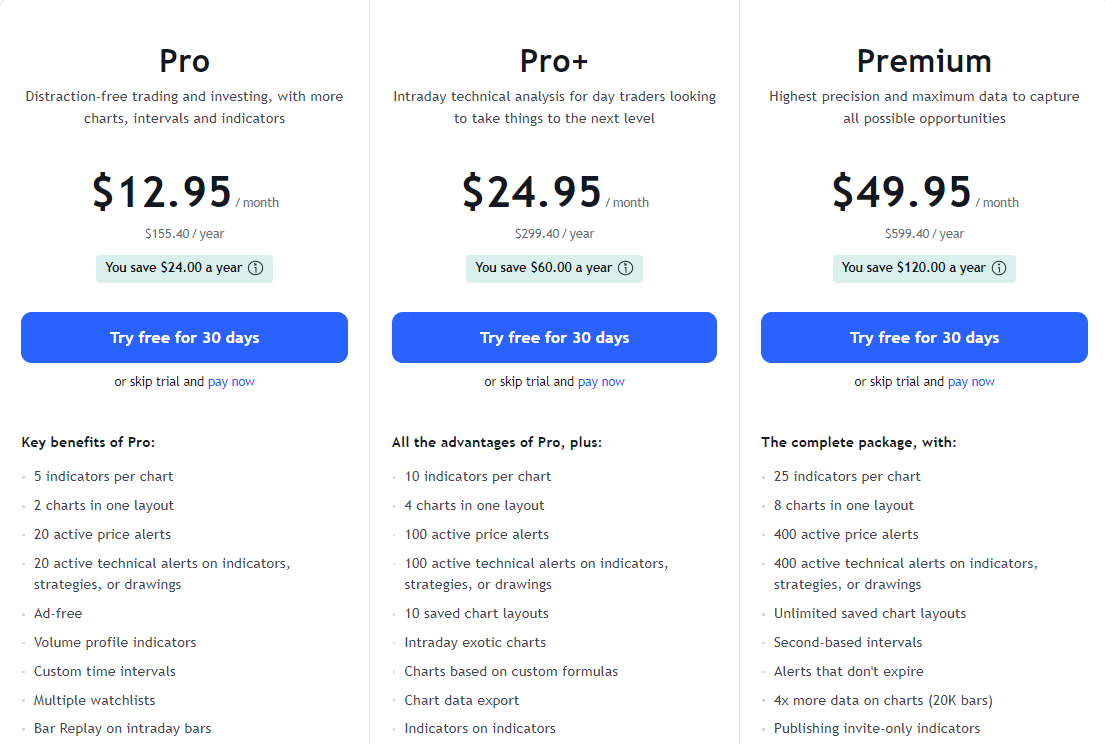
TradingView
BlackBoxStocks
BlackBoxStocks
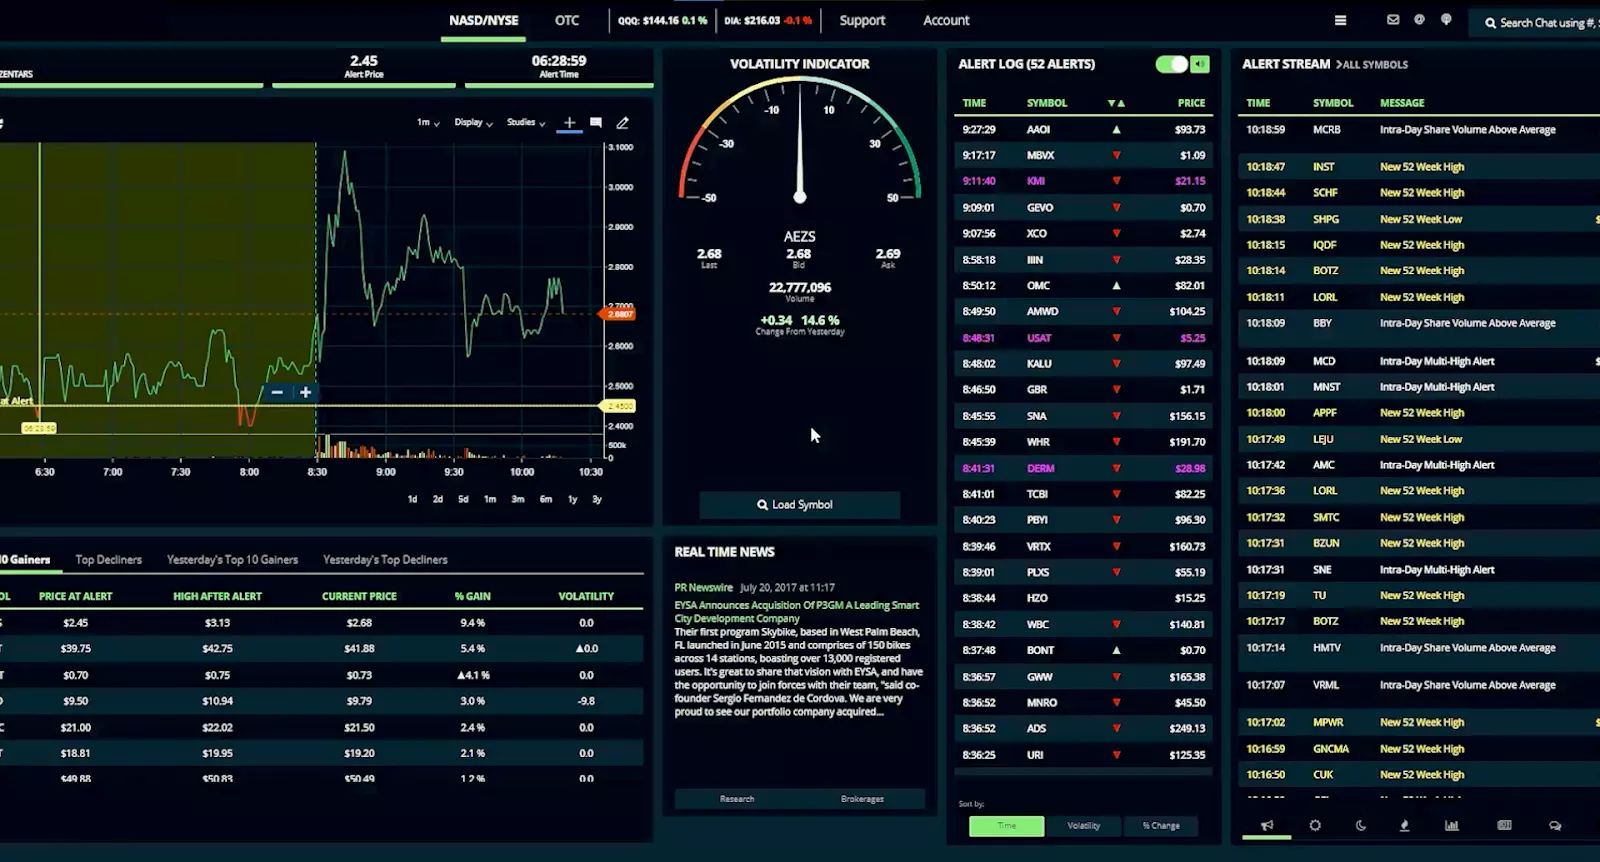
Established in 2011, BlackBoxStocks is a robust stock and options trading platform equipped with real-time scanning features and trade alerts. It sets itself apart with its commitment to education and community engagement. By strategically positioning its data servers near major exchanges, such as NYSE, NASDAQ, and OTC, BlackBoxStocks minimizes trading latency.
The platform combines predictive technology with advanced artificial intelligence to detect unusual market behavior and increasing volatility, providing users with a competitive edge. Subscribers benefit from a user-friendly dashboard that offers real-time alerts, stock scans, news feeds, interactive charts, and a social media platform for community interaction.
A notable feature of BlackBoxStocks is its proprietary stock screener, which employs advanced artificial intelligence algorithms to deliver a comprehensive market scan experience. The platform simplifies complex scanning logics and offers various filters to identify prime trading opportunities.
BlackBoxStocks enhances traders' efficiency by providing diverse charting options, including traditional candlestick charts, bar charts, Heikin Ashi, Renko, Point & Figure, and volume candles. Users can also apply a wide range of trading indicators to their charts. Real-time news integration adds another layer of insight, with access to sources like PR Newswire and TheFlyontheWall. The platform excels in alert management, offering color-coded alerts and an intuitive interface for tracking unusual trading activity. Further, the software continues to innovate with features like an Alert Stream that provides filtering options for specific trading criteria, such as 52-week highs and lows, stock price spikes, halts, and dark pool activity.
To help traders assess their compatibility with the software, BlackBoxStocks offers a 7-day trial. Further, the pricing plans for the software are as follows
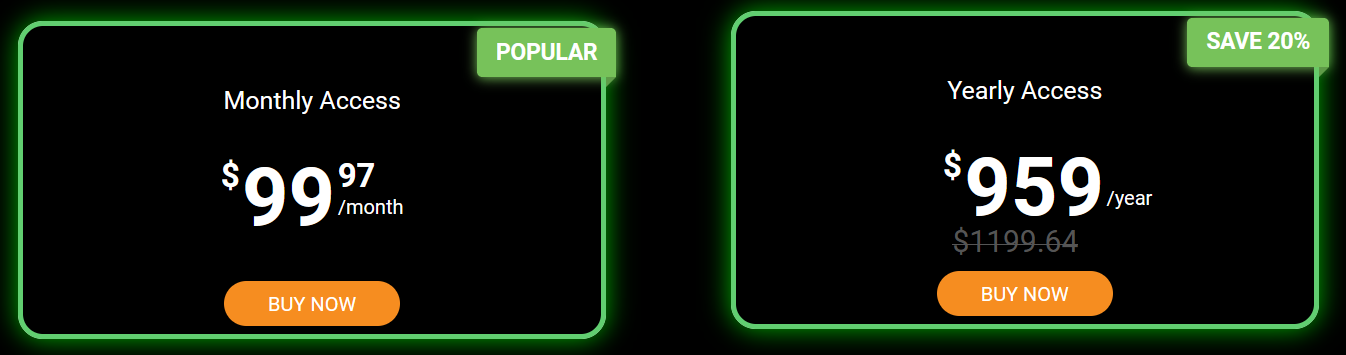
BlackBoxStocks
MetaStock
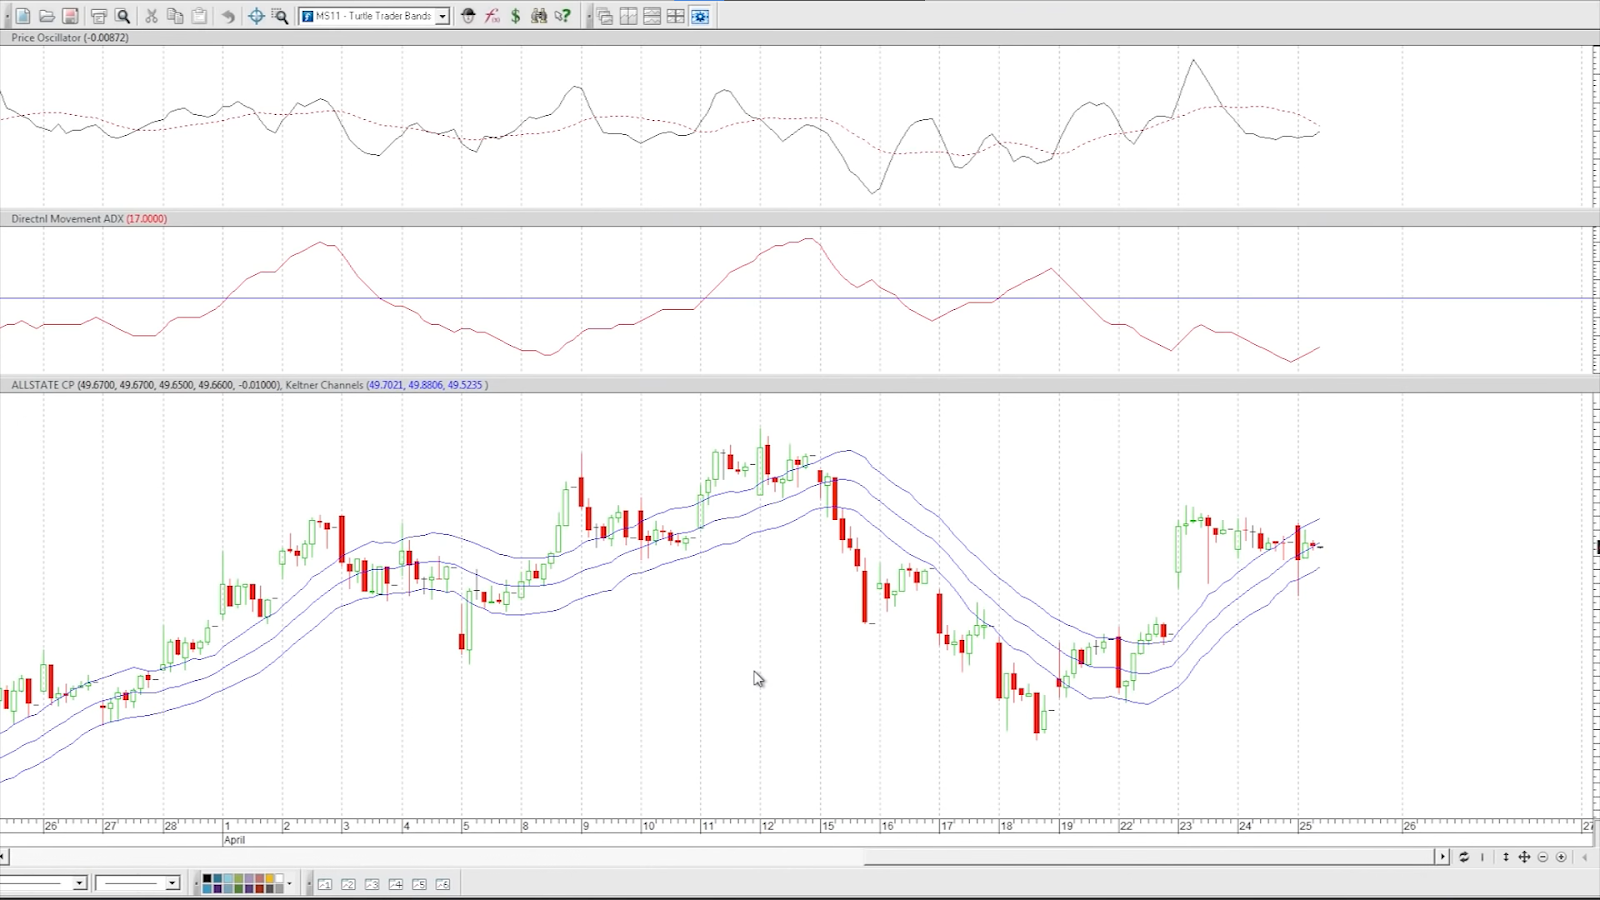
MetaStock
MetaStock, with its origins dating back to the late 1980s, is a stalwart in the realm of technical analysis software. It offers multiple software versions, with MetaStock R/T being particularly valuable for active traders as it harnesses real-time trading data from various exchanges.
This software has an extensive arsenal of over 150 indicators and line studies, complemented by insightful indicator interpretations to aid users in understanding how to apply each indicator effectively. Advanced users can leverage the Indicator Builder to craft their own indicators, allowing for a tailored trading experience. Furthermore, traders can construct and rigorously test their trading strategies or explore predefined strategies integrated into the package.
MetaStock sets itself apart by recognizing more than 32 candle patterns on charts, providing guidance on their interpretation and utilization. A MetaStock R/T subscription costs $100 per month, with additional charges for data feeds. Notably, MetaStock integrates seamlessly with online brokers via API connections.
MetaStock caters to various trading needs, offering solutions for day, swing, and end-of-day (EOD) traders across stocks, options, commodities, futures, and more. For those who prefer post-market analysis, MetaStock D/C, available for a one-time price of $499, offers an alternative. Both products offer free trial periods for users to assess their suitability.
Thinkorswim

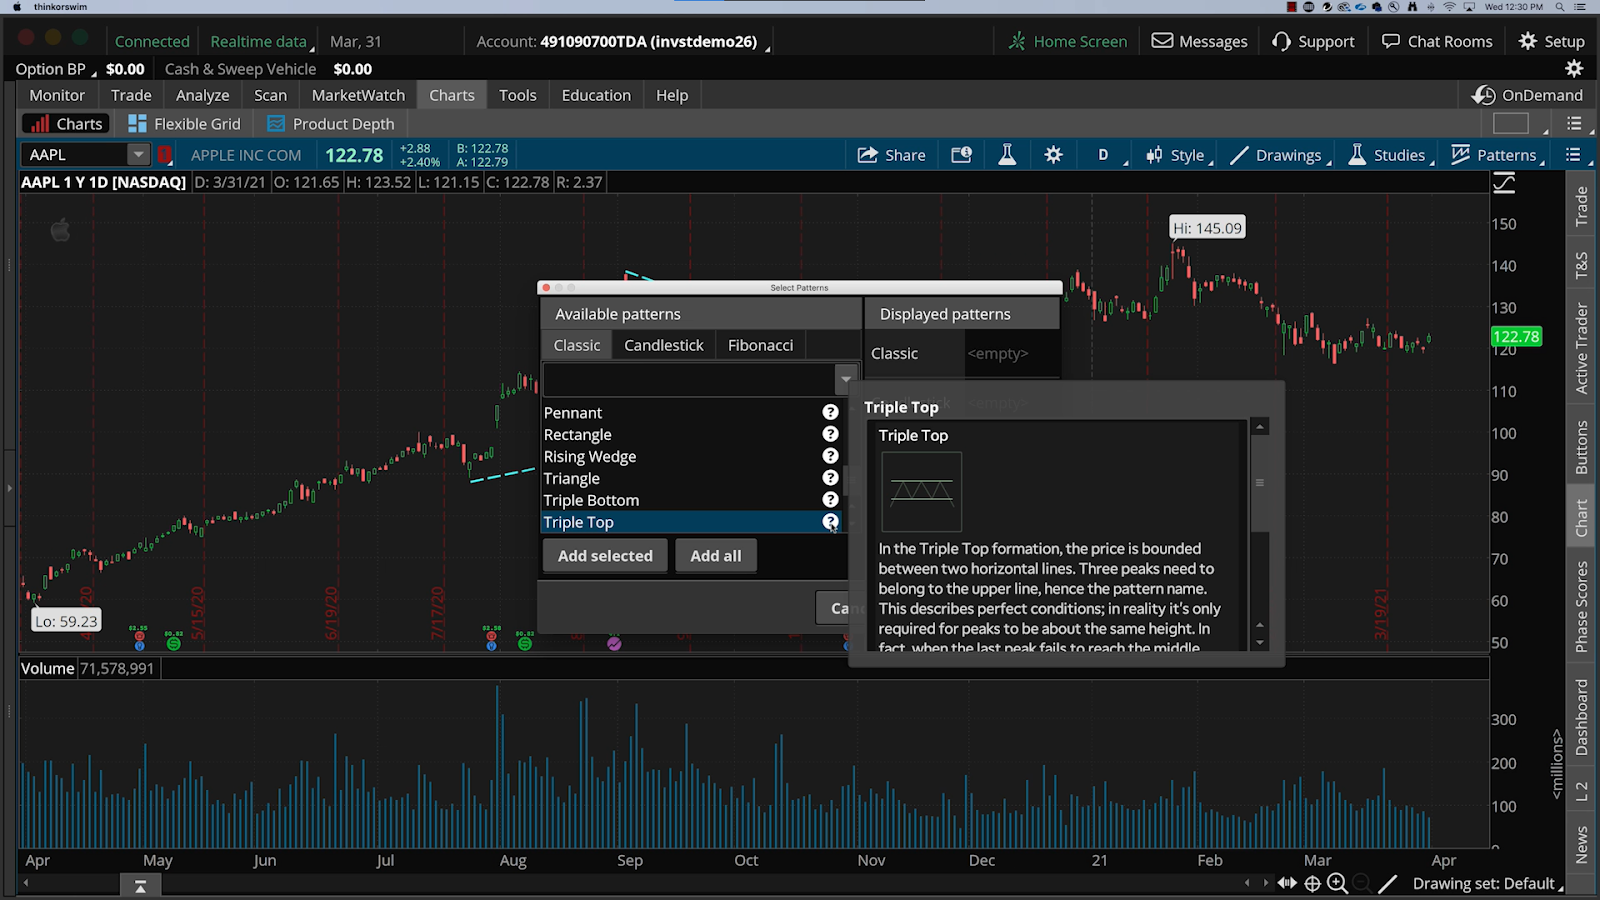
Thinkorswim
Thinkorswim, developed by TD Ameritrade, is a versatile trading software that caters to both options traders and equity traders. It offers a suite of analytical tools, drawing tools, and technical indicators, making it a comprehensive trading platform.
Designed for flexibility, Thinkorswim enables traders to customize their trading screens with preferred tools and a trade ticket. While initially tailored for options trading, it includes a wide range of analytical resources suitable for equity traders. Traders can employ over 400 technical studies, including support and resistance levels, and employ up to 20 chart drawing tools simultaneously.
Thinkorswim's adaptability extends to its multiple versions, including a desktop version, web version, and mobile app, each providing streaming real-time data for more than 400 technical studies.
Benefits of using stock charting software
Stock charting software offers traders a multitude of advantages, enhancing their ability to navigate the financial markets effectively. These benefits include:
Real-time data
Stock charting software delivers real-time market data, ensuring that traders remain informed about the latest market developments, enabling them to make well-informed decisions promptly.
Technical analysis tools
These software solutions are equipped with a variety of technical analysis tools, empowering traders to identify market trends, patterns, and potential opportunities for profitable trades.
Customizable indicators
Leading charting platforms offer a wealth of customizable indicators, drawing tools, and data feeds. This versatility allows traders to perform comprehensive technical analysis and formulate effective trading strategies across different asset classes.
Backtesting strategies
Traders can rigorously test their trading strategies by applying technical indicators or custom formulas to historical market data. This practice helps traders assess the historical performance of their strategies before implementing them in live trading.
Watchlists and alerts
Stock charting software enables traders to create personalized watchlists, set price alerts, and receive trade signals. This feature empowers them to efficiently monitor multiple stocks simultaneously, ensuring they don't miss potential opportunities.
Efficient graphical analysis
These software tools provide interactive graphical representations of price data and market metrics, customizable to various timeframes. This visual approach simplifies market analysis, making it more accessible to traders.
How to select the best stock charting software?
When selecting the best stock charting software, investors should carefully consider their specific trading needs and preferences. Here are key factors to take into account
Trading expertise
Tailor your choice based on your trading experience. Seasoned traders may prefer platforms offering advanced charting tools and technical indicators, while beginners might opt for tools that provide stock recommendations.
Core features
Determine the core features you require. If real-time market tracking is vital, prioritize software offering stock alerts and up-to-the-minute financial news. For testing strategies, seek platforms with backtesting capabilities and paper trading accounts.
Trading facilities
Assess whether the software connects directly to online brokers for seamless trading. Ensure the chosen broker is reputable, regulated, and offers reasonable fees, with some providing commission-free trading and low account minimums.
Pricing
Be aware of associated fees. Some online broker-provided software may be free to use, while others offer limited free versions with premium plans for full functionality. Clarify pricing structures before making a choice.
Supported devices
Ensure the software is compatible with your devices and operating systems. Most support Windows and Mac desktops, with Linux compatibility scarcely available. Additionally, look for platforms offering iOS and Android mobile apps that sync with the desktop version. Maybe, you also can be interested in information about best stock trading mobiles.
Customizable indicators
Prioritize platforms offering customizable indicators, drawing tools, and data feeds for in-depth technical analysis across various asset classes.
Backtesting capabilities
Select software that enables you to backtest trading strategies using historical data, allowing you to gauge past performance and refine your approach.
User interface
Choose software with an intuitive and user-friendly interface that suits your preferences and simplifies navigation.
Tips for using stock charting software
Effective use of stock charting software can significantly enhance your trading decisions. Here are some expert tips for utilizing such software to their full potential
Choose the right chart type
Understand that different chart types offer unique insights. Candlestick charts aid in spotting price trends and reversals, while line charts reveal long-term trends.
Customize your charts
Tailor your charts to align with your trading style and preferences. This entails selecting suitable indicators, adjusting timeframes, and opting for a user-friendly color scheme.
Utilize multiple timeframes
Gain a comprehensive view of market trends by employing multiple timeframes. This strategy empowers you to identify both short-term and long-term trends, facilitating well-informed trading decisions.
Set up alerts
Leverage alerts to receive notifications when specific market conditions materialize. This proactive approach ensures you stay updated on market movements, enabling timely trading actions.
Do backtesting
Implement backtesting to rigorously test your trading strategies using historical data. This process identifies areas for improvement, refining your strategies and elevating overall trading performance.
Maintain simplicity
Avoid cluttering your charts with excessive indicators or overlays. Focus on the indicators and overlays that directly align with your trading strategy, promoting clarity in analysis.
Learn from the community
Engage with trading communities and forums to tap into the collective knowledge of experienced traders. These platforms offer insights into market trends and patterns, enriching your trading expertise.
Is stock charting software worth it?
Stock charting software offers undeniable benefits for traders aiming to dissect price movements and pinpoint market trends. They serve as an asset in the trader's toolkit, enabling data-driven decision-making. Nevertheless, the worth of stock charting software depends on individual needs and preferences. Traders must conduct a thoughtful assessment of their specific requirements and exercise caution against excessive reliance on this technology.
A charting software empowers traders with insights into market dynamics, helping them make informed choices regarding buying and selling securities. It provides a visual representation of data, simplifying complex market analyses. However, it's crucial to strike a balance. Over-reliance on stock charting software can potentially lead to complacency or a disconnect from broader market knowledge. Traders should use these tools as aids rather than substitutes for their own understanding of market dynamics. In summary, stock charting software is a worthwhile resource, but its effectiveness ultimately hinges on how traders integrate it into their overall trading strategy.
FAQs
What is the best trading charting software?
It varies by individual preferences, but experts often name different options including MetaStock, Thinkorswim, and Trade Ideas.
What is the best stock charting website?
According to experts, TradingView and TrendSpider are popular choices for online stock charting.
What charting software do professional traders use?
Based on analysts’ opinion, professionals often use MetaStock and Thinkorswim for their advanced features.
Which software is best for stock analysis in the USA?
Thinkorswim, Trade Ideas, and MetaStock are often favored for stock analysis in the USA, though the best option among them is often a subjective choice.
Glossary for novice traders
-
1
Backtesting
Backtesting is the process of testing a trading strategy on historical data. It allows you to evaluate the strategy's performance in the past and identify its potential risks and benefits.
-
2
Swing trading
Swing trading is a trading strategy that involves holding positions in financial assets, such as stocks or forex, for several days to weeks, aiming to profit from short- to medium-term price swings or "swings" in the market. Swing traders typically use technical and fundamental analysis to identify potential entry and exit points.
-
3
Fundamental Analysis
Fundamental analysis is a method or tool that investors use that seeks to determine the intrinsic value of a security by examining economic and financial factors. It considers macroeconomic factors such as the state of the economy and industry conditions.
-
4
Yield
Yield refers to the earnings or income derived from an investment. It mirrors the returns generated by owning assets such as stocks, bonds, or other financial instruments.
-
5
Volatility
Volatility refers to the degree of variation or fluctuation in the price or value of a financial asset, such as stocks, bonds, or cryptocurrencies, over a period of time. Higher volatility indicates that an asset's price is experiencing more significant and rapid price swings, while lower volatility suggests relatively stable and gradual price movements.
Related Articles


Team that worked on the article

Chinmay Soni is a financial analyst with more than 5 years of experience in working with stocks, Forex, derivatives, and other assets. As a founder of a boutique research firm and an active researcher, he covers various industries and fields, providing insights backed by statistical data. He is also an educator in the field of finance and technology.
As an author for Traders Union, he contributes his deep analytical insights on various topics, taking into account various aspects.

Dr. BJ Johnson is a PhD in English Language and an editor with over 15 years of experience. He earned his degree in English Language in the U.S and the UK. In 2020, Dr. Johnson joined the Traders Union team. Since then, he has created over 100 exclusive articles and edited over 300 articles of other authors.

Mirjan Hipolito is a journalist and news editor at Traders Union. She is an expert crypto writer with five years of experience in the financial markets. Her specialties are daily market news, price predictions, and Initial Coin Offerings (ICO).
