What Is The Financial Reporting Calendar And How To Use It?


Editorial Note: While we adhere to strict Editorial Integrity, this post may contain references to products from our partners. Here's an explanation for How We Make Money. None of the data and information on this webpage constitutes investment advice according to our Disclaimer.
How to use a financial reporting calendar:
Tracking company financial statements
Analyzing financial results
Comparing company performance
Forecasting market movements
Planning trading strategies
Mitigating risks
Reacting to dividends
Making informed decisions
In this article, we will explore how to effectively utilize financial reporting calendars to track important dates, access accurate information, and implement strategic trading strategies for making informed investment decisions and managing risks in the financial markets.
How to use a financial reporting calendar
A financial reporting calendar serves multiple purposes and can be a valuable tool for various financial activities. Here are some key ways to use it effectively:
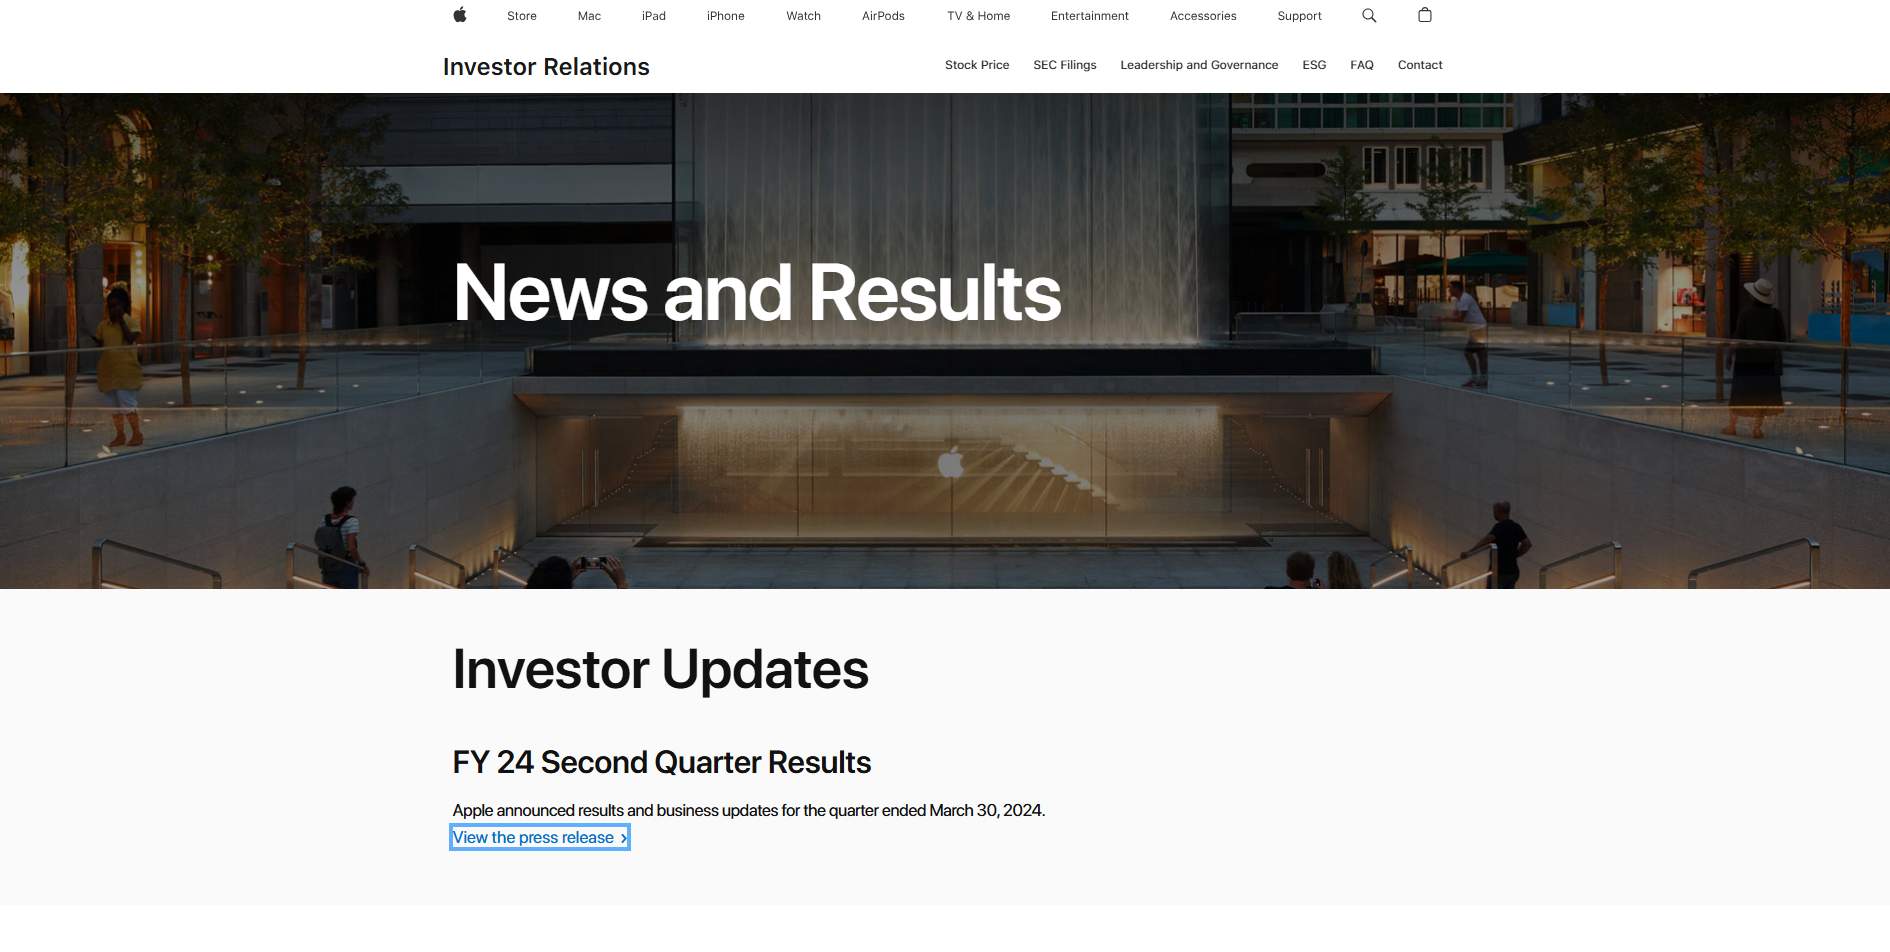
Tracking company financial statements: use the calendar to monitor the dates when companies you invest in release their financial statements. This timely information helps you make informed investment decisions based on the latest financial results. For instance, if you're invested in tech stocks like Apple, keeping an eye on their quarterly earnings reports, often released in January, April, July, and October, can provide insights into the company's performance and future prospects.
Analyzing financial results: review company financial statements as they are released to gain a comprehensive understanding of their operations and financial health. This analysis can help you assess their investment potential.Consider analyzing the financial statements of a company like Amazon after its quarterly earnings release. Understanding metrics like revenue growth, operating margins, and cash flow can help understand its financial health and potential for long-term growth.
Comparing company performance: use the calendar to compare the financial results of different companies. This comparison can help you identify the strengths and weaknesses of various companies, guiding your investment choices.You might compare the financial performances of two major retailers, such as Walmart and Target, after their quarterly earnings announcements. Contrasting factors like sales growth, profitability, and market share can inform investment decisions.
Forecasting market movements: traders can leverage the dates of financial report releases to anticipate market fluctuations. Positive financial results may lead to stock price increases, while negative outcomes could result in declines. For example, positive earnings surprises from companies like Netflix often lead to stock price rallies, while disappointing results can trigger sell-offs.
Planning trading strategies: knowing the timing of report releases allows traders to adjust their strategies accordingly. Some traders avoid trading around significant announcements to reduce risk, while others take advantage of the increased market activity during these times.
Mitigating risks: by steering clear of trading during periods of major report releases, you can avoid sudden market movements, thereby reducing risks and preserving capital. Investors might avoid trading during the Federal Reserve's interest rate announcements, as these events can cause significant market volatility. Instead, they might focus on long-term investments to ride out short-term fluctuations.
Reacting to dividends: the calendar also includes important dates related to dividends, such as announcement dates, ex-dividend dates, and payment dates. This information is crucial for traders focusing on dividend income.
Making informed decisions: access to a financial reporting calendar empowers you to make decisions based on a solid understanding of fundamental analysis and anticipated market events. For example, analyzing economic indicators like unemployment rates and inflation data can inform broader market trends and investment strategies.
How to find a financial reporting calendar
Locating a financial reporting calendar is straightforward, as several resources provide this information:
Company websites: many companies publish their financial reporting calendars directly on their investor relations pages. This is often the most accurate and up-to-date source.
Stock exchanges: websites of major stock exchanges, such as the NYSE or NASDAQ, often feature calendars that list reporting dates for the companies they list.

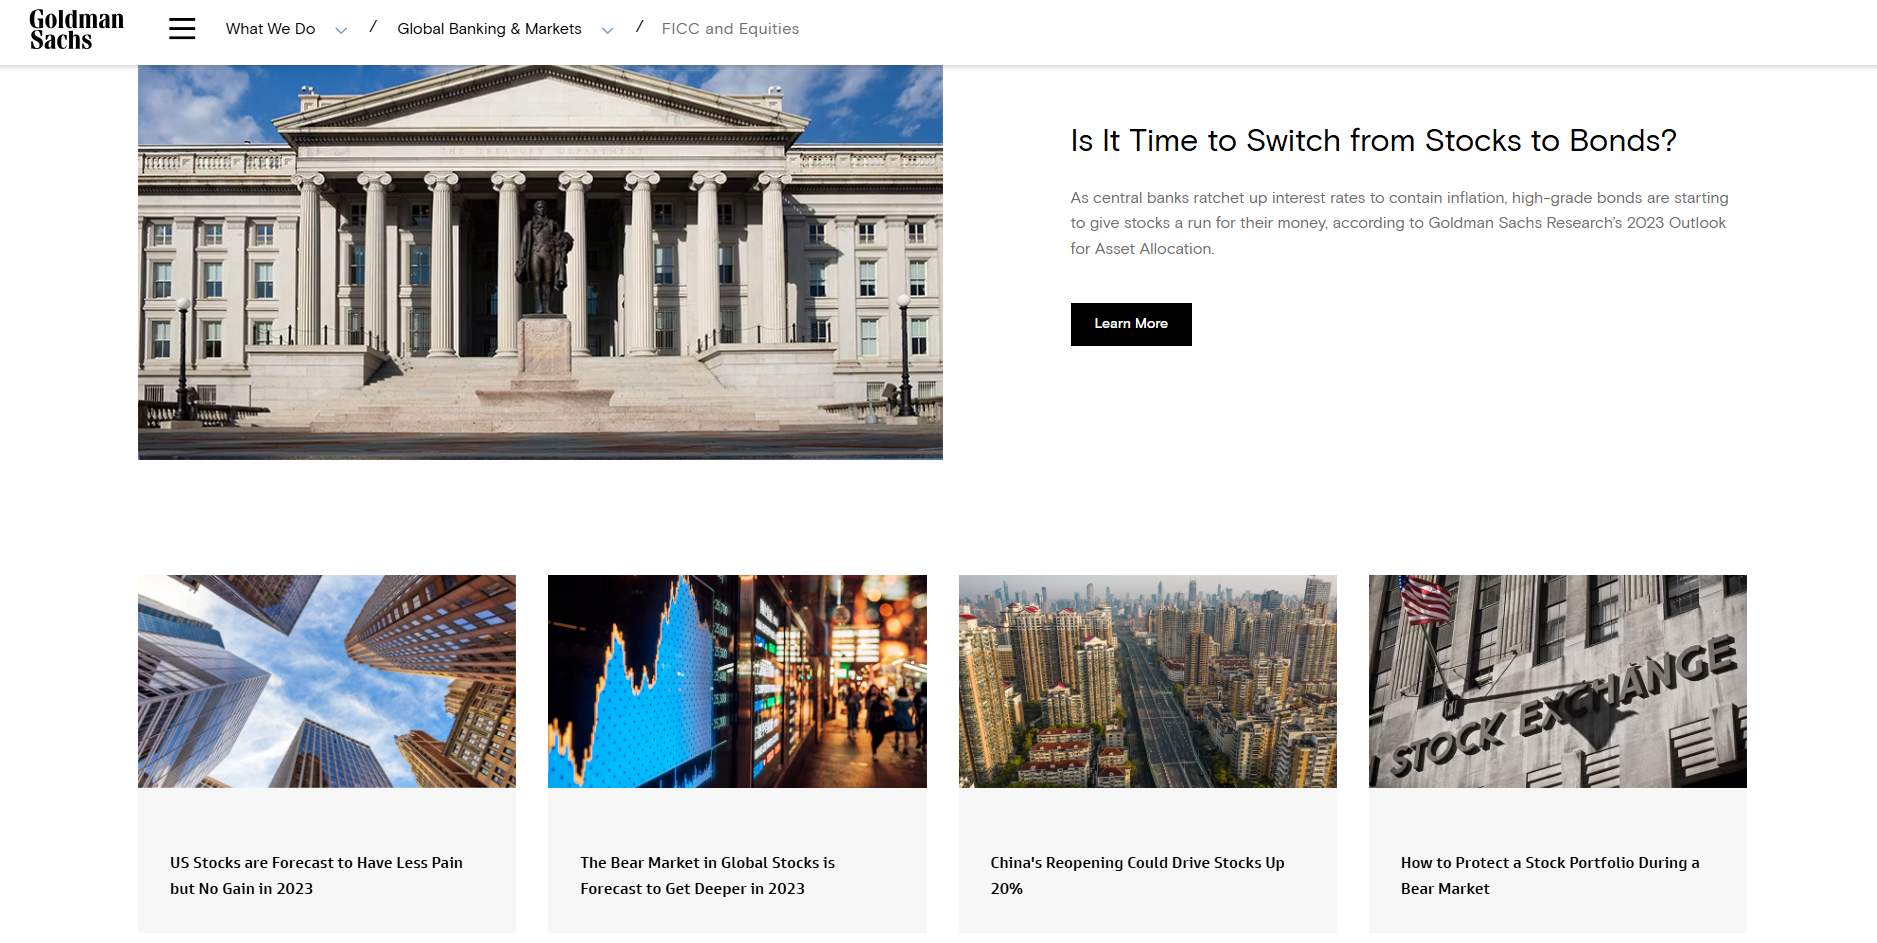
Investment banks and financial institutions: these entities frequently provide detailed financial calendars as part of their market analysis and reporting tools.
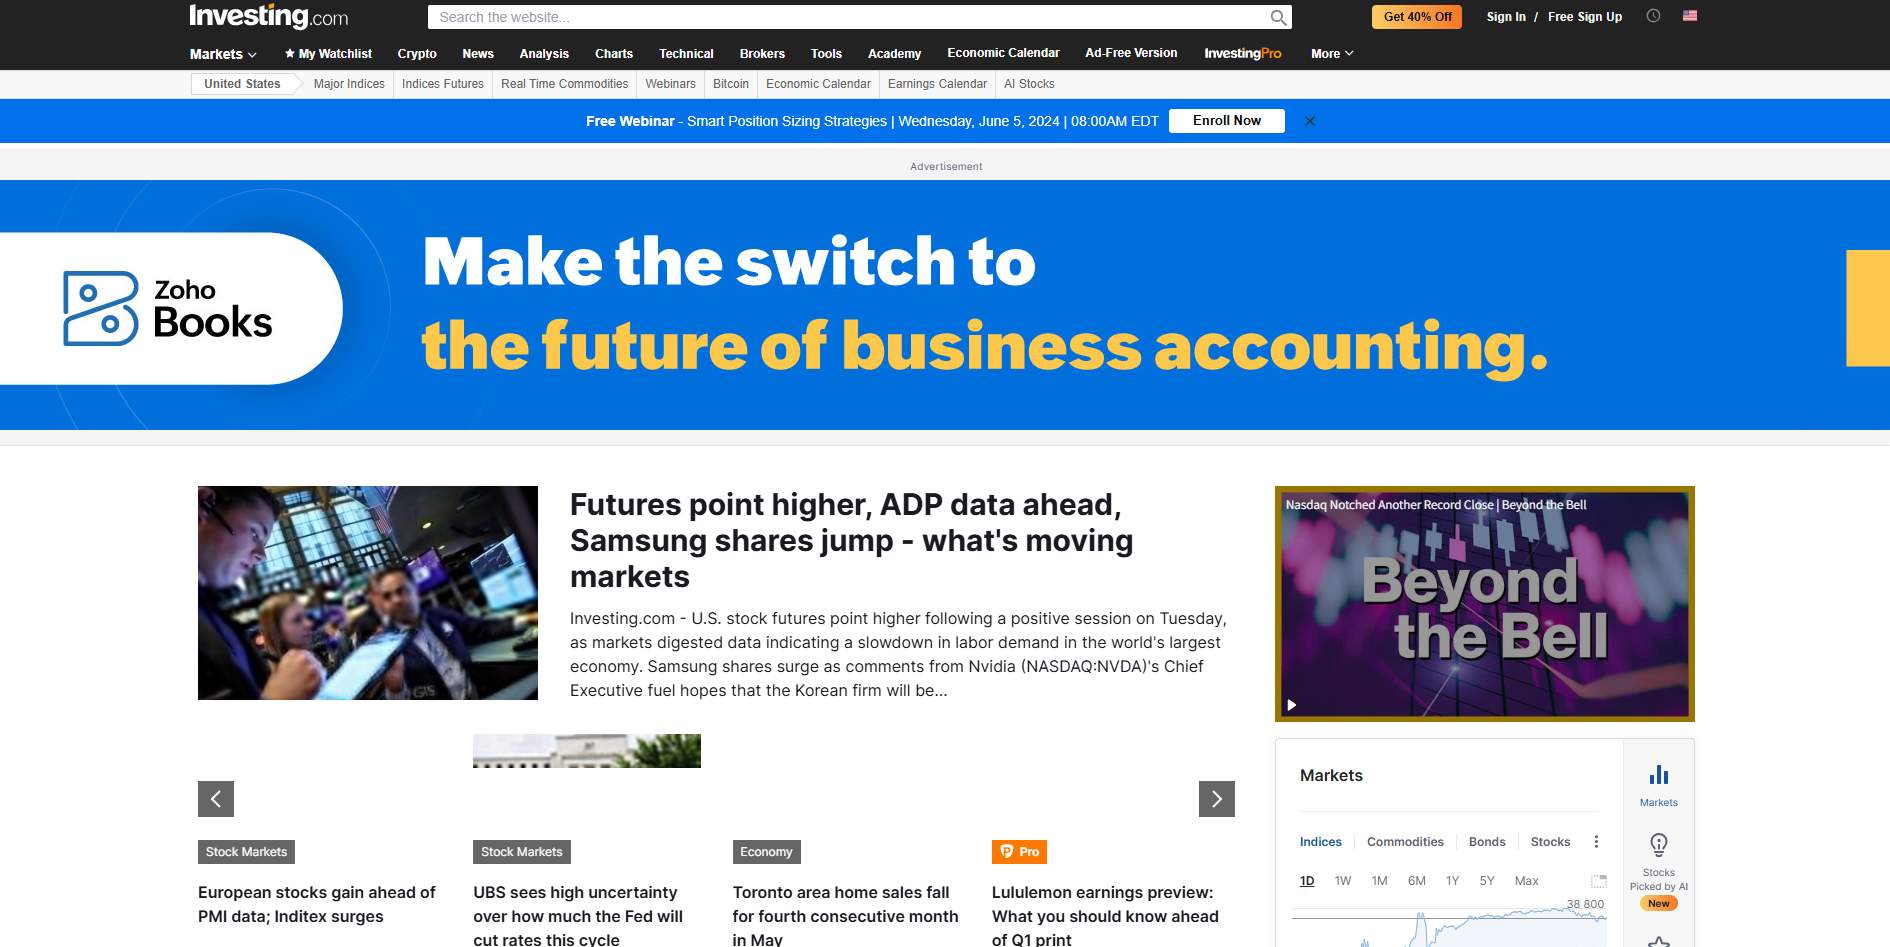
Specialized financial services: numerous platforms aggregate financial reporting calendars from various sources, offering comprehensive and accessible data. Notable examples include Investing.com, Finviz, Seeking Alpha, and GuruFocus. These services often allow users to filter and customize the information to fit their specific needs.
Trading strategies using the financial reporting calendar
In the world of investing, timing is crucial. The financial reporting calendar provides key dates and events that can significantly impact stock prices and market movements. By strategically using this calendar, investors and traders can develop and execute trading strategies that take advantage of these anticipated fluctuations. Here are three such strategies:
1. Leading-buy strategy
This strategy involves purchasing a company's stock before its financial statements are released. Investors using this approach anticipate that the stock prices of companies exceeding analyst expectations will rise in anticipation of the report release. Research indicates that stocks often experience a pre-release price increase when investor sentiment anticipates positive earnings surprises. For instance, companies that report earnings above analyst expectations typically see their stock prices rise by an average of 1-3% in the days leading up to the announcement.
Also if we take an example, during the Q1 2022 earnings season, companies like Mastercard saw their stock prices increase significantly prior to their earnings announcements, with a 65% year-over-year EPS growth reported. This demonstrates the potential profitability of the leading-buy strategy when executed with thorough research and analysis.
To implement this strategy:
Track the dates of financial statement releases for the companies of interest.
Assess the financial performance of these companies to determine how well they are likely to meet or exceed analyst expectations.
If you believe a company's financial performance will surpass expectations, buy the stock before the release of the reports.
2. Leading-sell strategy
This strategy entails selling a company's stock before its financial statements are released. Investors following this approach predict that the stock prices of companies failing to meet analyst expectations will decline in anticipation of the report release.` In April 2022, Netflix's stock saw a sharp decline before its Q1 earnings report. Investors were concerned about the company's slowing subscriber growth and increased competition in the streaming market. These concerns were validated when Netflix announced a loss of 200,000 subscribers, leading to a 35% drop in stock price post-earnings release. Those who employed the leading-sell strategy and sold their shares in advance mitigated their losses substantially.
Also if we take another example, In January 2021, Tesla's stock price experienced a significant decline ahead of its Q4 earnings release. Analysts had high expectations due to the company's strong performance in previous quarters, but market sentiment turned cautious amid concerns about production issues and delivery numbers. Investors who anticipated these challenges and sold their shares beforehand avoided a nearly 7% drop when Tesla reported lower-than-expected earnings.
To use this strategy:
Monitor the dates of financial statement releases for the companies of interest.
Evaluate the financial performance of these companies to judge whether they might fall short of analyst expectations.
If you believe a company's financial performance will not meet expectations, sell the stock before the release of the reports.
3. Dividend gap trading strategy
A dividend gap refers to the drop in a stock's price on the day after the ex-dividend date. This drop occurs because shareholders who own shares on the ex-dividend date receive dividends, whereas shareholders who purchase shares after this date do not. The stock price typically drops by the amount of the dividend on the ex-dividend date. For instance, if a company pays a $2 dividend, its stock price might drop by approximately $2 the next trading day.
To use this strategy:
Track Ex-Dividend Dates: Maintain a calendar of ex-dividend dates for the companies you are interested in.
Evaluate Dividend Amounts: Analyze the expected dividends, focusing on those that are significant relative to the stock price.
Purchase Before Ex-Dividend Date: Buy the company's shares before the ex-dividend date to be eligible for the dividend.
Sell After Ex-Dividend Date: Sell the shares on the day after the ex-dividend date, anticipating a price drop equivalent to the dividend amount.
If the company maintains a stable financial position on the market and in the future dividends will not be less than the current ones, the chances of closing the dividend gap tend to 100%. Such gap closes within 5-30 trading days.
Use the financial reporting calendar to track trends and analyze the bigger picture

Working with the financial reporting calendar requires careful attention and a systematic approach to effectively utilize the information and make informed decisions. I always start by marking key dates when companies release their quarterly and annual reports. This helps me prepare in advance for important events and potential market volatility. I keep track of the reporting dates for leading companies in my industry or sectors of interest and note them in my calendar.
Another crucial aspect is analyzing previous reports and analysts' forecasts. This gives me an idea of what results are expected and how the market might react. I pay attention to metrics like earnings per share (EPS), revenue, and the company's future guidance. By comparing actual data with forecasts, I can assess how well the company is managing its resources and what its future prospects look like.
It's also important to be prepared for potential surprises. I always prepare for the possibility that actual data might significantly differ from expectations. To do this, I set up multiple scenarios and plan my actions for each one. This helps me stay calm and make well-thought-out decisions, even if the market reacts unpredictably.
Finally, I use the financial reporting calendar to track trends and analyze the bigger picture. This involves reviewing reports from other companies in the same industry and comparing their performance. It helps me understand market trends and investor sentiment, which is crucial for making strategic decisions.
Overall, working with the financial reporting calendar requires attentiveness, analytical thinking, and readiness for the unexpected. It not only keeps me informed about the financial health of companies but also allows me to manage my portfolio effectively and minimize risks.
Concluding thoughts
A financial reporting calendar is crucial for investors and traders to maximize returns and manage risks. By tracking key events like reporting periods, publication dates, investor conferences, dividends, and shareholder meetings, you can stay informed and make timely decisions.
FAQs
How can I stay updated with changes in a company's reporting schedule?
Subscribe to the company's investor relations newsletters and set up alerts on financial news platforms to receive notifications about any changes in reporting schedules.
Are there any tools or apps that can help me track multiple financial reporting calendars efficiently?
Yes, several apps and platforms, such as Bloomberg Terminal, Yahoo Finance, and MarketWatch, offer features to track and manage multiple financial reporting calendars efficiently.
What should I do if a company's report release date is postponed?
Re-evaluate your trading strategy and consider market sentiment. Delays can indicate underlying issues, so monitor any related news and be prepared to adjust your positions accordingly.
Related Articles
Team that worked on the article
Rinat Gismatullin is an entrepreneur and a business expert with 9 years of experience in trading. He focuses on long-term investing, but also uses intraday trading. He is a private consultant on investing in digital assets and personal finance. Rinat holds two degrees in Economy and Linguistics.
Chinmay Soni is a financial analyst with more than 5 years of experience in working with stocks, Forex, derivatives, and other assets. As a founder of a boutique research firm and an active researcher, he covers various industries and fields, providing insights backed by statistical data. He is also an educator in the field of finance and technology.
As an author for Traders Union, he contributes his deep analytical insights on various topics, taking into account various aspects.
Mirjan Hipolito is a journalist and news editor at Traders Union. She is an expert crypto writer with five years of experience in the financial markets. Her specialties are daily market news, price predictions, and Initial Coin Offerings (ICO).
Economic indicators — a tool of fundamental analysis that allows to assess the state of an economic entity or the economy as a whole, as well as to make a forecast. These include: GDP, discount rates, inflation data, unemployment statistics, industrial production data, consumer price indices, etc.
Forex leverage is a tool enabling traders to control larger positions with a relatively small amount of capital, amplifying potential profits and losses based on the chosen leverage ratio.
Volatility refers to the degree of variation or fluctuation in the price or value of a financial asset, such as stocks, bonds, or cryptocurrencies, over a period of time. Higher volatility indicates that an asset's price is experiencing more significant and rapid price swings, while lower volatility suggests relatively stable and gradual price movements.
Dividend gap is a price gap in the value of a stock that occurs after the cut-off date. The cut-off date is the last day for the formation of the list of shareholders applying for dividends.
Cryptocurrency is a type of digital or virtual currency that relies on cryptography for security. Unlike traditional currencies issued by governments (fiat currencies), cryptocurrencies operate on decentralized networks, typically based on blockchain technology.

-
 Afghanistan
-
 Albania
-
 Algeria
-
 Argentina
-
 Armenia
-
 Australia
-
 Austria
-
 Azerbaijan
-
 Bahamas
-
 Bahrain
-
 Bangladesh
-
 Belgium
-
 Botswana
-
 Brazil
-
 Brunei
-
 Bulgaria
-
 Burma
Burma
-
 Cambodia
-
 Cameroon
-
 Canada
-
 Chile
Chile
-
 China
China
-
 Colombia
-
 Costa Rica
-
 Cote d'Ivoire
-
 Croatia
-
 Cyprus
-
 Czech Republic
-
 Denmark
-
 Dominican Republic
-
 Ecuador
-
 Egypt
Egypt
-
 Estonia
-
 Eswatini
-
 Ethiopia
-
 Finland
-
 France
-
 Georgia
-
 Germany
-
 Ghana
Ghana
-
 Greece
-
 Haiti
Haiti
-
 Hong Kong
-
 Hungary
-
 India
India
-
 Indonesia
-
 Iran, Islamic republic
-
 Iraq
Iraq
-
 Ireland
-
 Israel
-
 Italy
Italy
-
 Jamaica
-
 Japan
Japan
-
 Jordan
-
 Kazakhstan
-
 Kenya
Kenya
-
 Korea
Korea
-
 Kuwait
-
 Kyrgyzstan
-
 Laos
Laos
-
 Latvia
-
 Lebanon
-
 Libyan Arab Jamahiriya
-
 Lithuania
-
 Luxembourg
-
 Macedonia
-
 Madagascar
-
 Malaysia
-
 Malta
Malta
-
 Mauritius
-
 Mexico
-
 Moldova
-
 Mongolia
-
 Montenegro
-
 Morocco
-
 Mozambique
-
 Namibia
-
 Nepal
Nepal
-
 Netherlands
-
 Nigeria
-
 Norway
-
 Oman
Oman
-
 Pakistan
-
 Palestine
-
 Papua New Guinea
-
 Peru
Peru
-
 Philippines
-
 Poland
-
 Portugal
-
 Puerto Rico
-
 Qatar
Qatar
-
 Romania
-
 Rwanda
-
 Saudi Arabia
-
 Serbia
-
 Singapore
-
 Slovakia
-
 Slovenia
-
 Somalia
-
 South Africa
-
 Spain
Spain
-
 Sri Lanka
-
 Sweden
-
 Switzerland
-
 Syrian Arab Republic
-
 Taiwan
-
 Tajikistan
-
 Tanzania, United Republic Of
-
 Thailand
-
 Trinidad and Tobago
-
 Tunisia
-
 Turkey
-
 UAE
UAE
-
 Uganda
-
 Ukraine
-
 United Kingdom
-
United States
-
 Uzbekistan
-
 Venezuela
-
 Vietnam
-
 Yemen
Yemen
-
 Zambia
-
 Zimbabwe
- Forex
- Crypto

