Using MACD in Forex Trading


Editorial Note: While we adhere to strict Editorial Integrity, this post may contain references to products from our partners. Here's an explanation for How We Make Money. None of the data and information on this webpage constitutes investment advice according to our Disclaimer.
The Moving Average Convergence Divergence (MACD) is a popular technical analysis tool in Forex trading that helps identify potential buy and sell signals by showing the relationship between two moving averages of a currency's price. Traders use MACD to spot changes in the strength, direction, momentum, and duration of a trend, with crossovers and divergences being key indicators
In Forex trading, technical indicators are essential for making trading decisions. The Moving Average Convergence Divergence (MACD) is known for being reliable and effective. This guide will help both beginners and experienced traders understand how to use MACD in Forex trading and improve their strategies.
What is the MACD and how to use it?
The Moving Average Convergence Divergence (MACD) is a trend-following momentum indicator that helps traders identify potential buy and sell signals. Developed by Gerald Appel in the late 1970s, MACD consists of three main components: the MACD line, the signal line, and the histogram.
The MACD calculation methodology has a mechanism for evaluating price momentum, so the indicator is considered a hybrid (trend+oscillator), but in fact, it is simply an improved visual representation of the interaction of exponential moving averages.
Actually, MACD shows exactly what is stated in the name - how moving averages are mutually located. Three MAs are used in calculations, so the main characteristic of the indicator is data smoothing - due to which it manages to identify the dominant trend among the price "noise". The price for this is a chronic lag, which is almost imperceptible in trend trading, but it is a damn hindrance in scalping.
MACD line: Calculated by subtracting the 26-day Exponential Moving Average (EMA) from the 12-day EMA.
Signal line: A 9-day EMA of the MACD line, plotted alongside the MACD line.
Histogram: Represents the difference between the MACD line and the signal line, providing a visual depiction of momentum strength and direction.
Using MACD in Forex trading
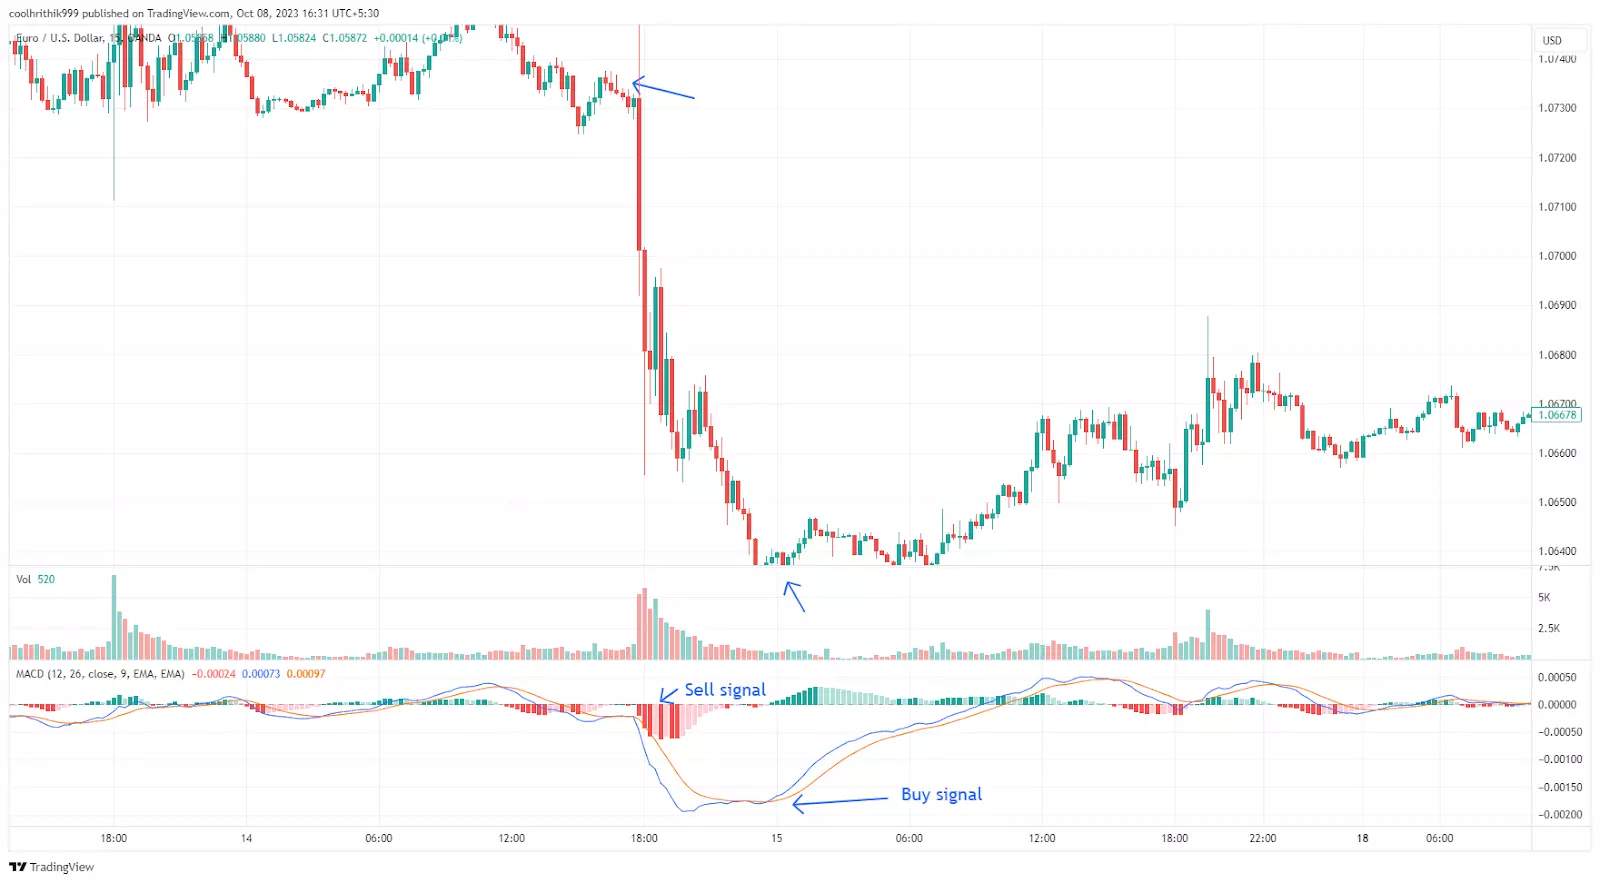
Interpreting MACD signals involves understanding the relationships between its components and the price action of the Forex pair.
MACD crossovers: When the MACD line crosses above the signal line, it indicates a bullish signal, suggesting a potential buy. Conversely, when the MACD line crosses below the signal line, it indicates a bearish signal, suggesting a potential sell.
MACD histogram: The histogram visualizes the difference between the MACD line and the signal line. A positive histogram indicates bullish momentum, while a negative histogram indicates bearish momentum.
Divergences: Divergences occur when the price action diverges from the MACD indicator, often signaling potential trend reversals.
Zero-line crossings: When the MACD line crosses the zero line from below, it confirms bullish momentum. Crossing from above confirms bearish momentum.
Note: Appel recommended the familiar default parameters (12,26,9) only for those wishing to sell, while for buyers he believes that (8,17,5) is more appropriate. Our readers can experiment on their own.
Common MACD strategies
MACD and Signal Line Crossovers: Using MACD and signal line crossovers for trading involves entering trades based on the direction of the crossover. This strategy is straightforward and widely used.
MACD Histogram Reversals: Identify and trade MACD histogram reversals by observing changes in the histogram's direction. This strategy helps in predicting market reversals.
MACD Divergence Trading: Leveraging divergences for trading opportunities involves identifying discrepancies between MACD and price action, often signaling trend reversals.
MACD Zero-Line Crossover: Using zero-line crossovers for entry and exit points involves trading based on the MACD line crossing the zero line, confirming trend direction.
When looking for the best brokers to test the MACD indicator strategies in Forex trading, it's important to consider platforms that offer robust charting tools, educational resources, and a user-friendly interface. Based on recent analyses, the top brokers that cater well to traders using MACD include:
| Demo | Min. deposit, $ | Max. leverage | Min Spread EUR/USD, pips | Max Spread EUR/USD, pips | Open account | |
|---|---|---|---|---|---|---|
| Yes | 100 | 1:500 | 0,4 | 1,5 | Open an account Your capital is at risk. |
|
| Yes | 5 | 1:1000 | 0,7 | 1,2 | Open an account Your capital is at risk. |
|
| Yes | No | 1:500 | Not supported | Not supported | Open an account Your capital is at risk. |
|
| Yes | 10 | 1:2000 | 0,5 | 2 | Open an account Your capital is at risk. |
|
| Yes | 100 | 1:500 | 0,4 | 1,2 | Open an account Your capital is at risk. |
Combining MACD with other indicators
Moving Averages: Combining moving averages with MACD helps confirm trends and signals, providing additional validation for trading decisions.
Relative Strength Index (RSI): Combining RSI with MACD can enhance signal accuracy by filtering out false signals and confirming overbought or oversold conditions.
Bollinger Bands: Using Bollinger Bands with MACD helps identify trading ranges and potential breakouts, adding an extra layer of analysis.
Volume Indicators: Enhancing MACD signals with volume analysis helps confirm the strength of trends and potential reversals.
Tips for successful MACD trading
Every trader, no matter what strategy he trades with, has a basic problem: lack of patience - it is difficult to wait for all the conditions to be met to open a deal and reach the target levels. That is why the MACD indicator is ideal for beginners. Yes, it lags, but it gives time to evaluate the situation additionally.
To successfully trade using the MACD (Moving Average Convergence Divergence) indicator, consider the following tips:
Understand MACD сomponents: Familiarize yourself with the MACD line, signal line, and histogram. The MACD line represents the difference between two moving averages (usually 12-day and 26-day), while the signal line is a 9-day EMA of the MACD line. The histogram shows the difference between the MACD and signal lines.
Identify сrossovers: Look for MACD line crossovers above or below the signal line. A crossover above the signal line may indicate a buying opportunity, while a crossover below suggests a selling opportunity.
Use divergences: Pay attention to divergences between the MACD and price action. A bullish divergence occurs when the price makes lower lows, but the MACD forms higher lows, suggesting a potential upward reversal. Conversely, a bearish divergence occurs when the price makes higher highs, but the MACD forms lower highs, indicating a potential downward reversal.
Combine with other indicators: Enhance the reliability of MACD signals by combining them with other technical indicators, such as RSI (Relative Strength Index) or support and resistance levels, to confirm the trend's strength and direction.
Adjust settings for your strategy: Customize the MACD's settings to suit your trading style and the asset being traded. For example, shorter timeframes may benefit from more sensitive settings (e.g., 5, 13, 1), while longer timeframes may use the default (12, 26, 9).
Consider the market context: Always consider the broader market context, such as economic news or major announcements, as these can impact the effectiveness of MACD signals. Use the MACD in conjunction with fundamental analysis to make more informed trading decisions.
By adhering to these tips, traders can better utilize the MACD indicator to identify potential trading opportunities and manage risk effectively.
Make MACD a valuable part of your trading strategy

In my experience, the Moving Average Convergence Divergence (MACD) indicator is a powerful tool in Forex trading. It helps me identify market trends, momentum, and potential reversals with its components: the MACD line, signal line, and histogram.
One of the key advantages of MACD is its ability to clearly indicate trends. When the MACD line crosses above the signal line, it's a bullish signal; a crossover below indicates a bearish trend. The histogram shows the strength of momentum, which is crucial for timing entries and exits. I find this particularly useful across different time frames, whether I'm day trading or taking a longer-term approach.
In practice, I look for MACD crossovers to confirm trend reversals or continuations and watch for divergences between the MACD and price action to spot weakening momentum. By combining these signals with the histogram's indication of trend strength, I can make more informed trading decisions.
Overall, MACD is a valuable part of my trading strategy, helping me navigate the Forex market more effectively.
Summary
Using the Moving Average Convergence Divergence (MACD) in Forex trading is highly effective for identifying market trends and momentum. It provides clear signals through the MACD line, signal line, and histogram. When the MACD line crosses the signal line, it indicates bullish or bearish trends, while the histogram reflects momentum strength, aiding in timing entries and exits. However, as a lagging indicator, MACD can sometimes generate delayed signals and may produce false signals in sideways markets. To enhance its reliability, it's often used alongside other indicators like RSI and trend lines. MACD is a valuable tool for making informed trading decisions in the Forex market.
FAQs
What is MACD in Forex trading?
MACD (Moving Average Convergence Divergence) is a technical indicator used to identify trends, momentum, and potential reversals in Forex trading.
How does MACD generate trading signals?
MACD generates signals through the crossover of the MACD line and the signal line, indicating bullish or bearish trends, and the histogram shows momentum strength.
What are the main components of MACD?
The main components are the MACD line (difference between 12-day and 26-day EMAs), the signal line (9-day EMA of the MACD line), and the histogram (difference between MACD line and signal line).
Is MACD a lagging indicator?
Yes, MACD is a lagging indicator, meaning it follows price action and may generate signals after the optimal entry or exit points.
Related Articles
Team that worked on the article
Igor is an experienced finance professional with expertise across various domains, including banking, financial analysis, trading, marketing, and business development. Over the course of his career spanning more than 18 years, he has acquired a diverse skill set that encompasses a wide range of responsibilities. As an author at Traders Union, he leverages his extensive knowledge and experience to create valuable content for the trading community.
Chinmay Soni is a financial analyst with more than 5 years of experience in working with stocks, Forex, derivatives, and other assets. As a founder of a boutique research firm and an active researcher, he covers various industries and fields, providing insights backed by statistical data. He is also an educator in the field of finance and technology.
As an author for Traders Union, he contributes his deep analytical insights on various topics, taking into account various aspects.
Mirjan Hipolito is a journalist and news editor at Traders Union. She is an expert crypto writer with five years of experience in the financial markets. Her specialties are daily market news, price predictions, and Initial Coin Offerings (ICO).
Scalping in trading is a strategy where traders aim to make quick, small profits by executing numerous short-term trades within seconds or minutes, capitalizing on minor price fluctuations.
Fundamental analysis is a method or tool that investors use that seeks to determine the intrinsic value of a security by examining economic and financial factors. It considers macroeconomic factors such as the state of the economy and industry conditions.
A Forex trading scam refers to any fraudulent or deceptive activity in the foreign exchange (Forex) market, where individuals or entities engage in unethical practices to defraud traders or investors.
Forex leverage is a tool enabling traders to control larger positions with a relatively small amount of capital, amplifying potential profits and losses based on the chosen leverage ratio.
Xetra is a German Stock Exchange trading system that the Frankfurt Stock Exchange operates. Deutsche Börse is the parent company of the Frankfurt Stock Exchange.

-
 Afghanistan
-
 Albania
-
 Algeria
-
 Argentina
-
 Armenia
-
 Australia
-
 Austria
-
 Azerbaijan
-
 Bahamas
-
 Bahrain
-
 Bangladesh
-
 Belgium
-
 Botswana
-
 Brazil
-
 Brunei
-
 Bulgaria
-
 Burma
Burma
-
 Cambodia
-
 Cameroon
-
 Canada
-
 Chile
Chile
-
 China
China
-
 Colombia
-
 Costa Rica
-
 Cote d'Ivoire
-
 Croatia
-
 Cyprus
-
 Czech Republic
-
 Denmark
-
 Dominican Republic
-
 Ecuador
-
 Egypt
Egypt
-
 Estonia
-
 Eswatini
-
 Ethiopia
-
 Finland
-
 France
-
 Georgia
-
 Germany
-
 Ghana
Ghana
-
 Greece
-
 Haiti
Haiti
-
 Hong Kong
-
 Hungary
-
 India
India
-
 Indonesia
-
 Iran, Islamic republic
-
 Iraq
Iraq
-
 Ireland
-
 Israel
-
 Italy
Italy
-
 Jamaica
-
 Japan
Japan
-
 Jordan
-
 Kazakhstan
-
 Kenya
Kenya
-
 Korea
Korea
-
 Kuwait
-
 Kyrgyzstan
-
 Laos
Laos
-
 Latvia
-
 Lebanon
-
 Libyan Arab Jamahiriya
-
 Lithuania
-
 Luxembourg
-
 Macedonia
-
 Madagascar
-
 Malaysia
-
 Malta
Malta
-
 Mauritius
-
 Mexico
-
 Moldova
-
 Mongolia
-
 Montenegro
-
 Morocco
-
 Mozambique
-
 Namibia
-
 Nepal
Nepal
-
 Netherlands
-
 Nigeria
-
 Norway
-
 Oman
Oman
-
 Pakistan
-
 Palestine
-
 Papua New Guinea
-
 Peru
Peru
-
 Philippines
-
 Poland
-
 Portugal
-
 Puerto Rico
-
 Qatar
Qatar
-
 Romania
-
 Rwanda
-
 Saudi Arabia
-
 Serbia
-
 Singapore
-
 Slovakia
-
 Slovenia
-
 Somalia
-
 South Africa
-
 Spain
Spain
-
 Sri Lanka
-
Sweden
-
 Switzerland
-
 Syrian Arab Republic
-
 Taiwan
-
 Tajikistan
-
 Tanzania, United Republic Of
-
 Thailand
-
 Trinidad and Tobago
-
 Tunisia
-
 Turkey
-
 UAE
UAE
-
 Uganda
-
 Ukraine
-
 United Kingdom
-
 United States
-
 Uzbekistan
-
 Venezuela
-
 Vietnam
-
 Yemen
Yemen
-
 Zambia
-
 Zimbabwe
- Forex
- Crypto

