How Can I Trade A 200-Day MA?


Editorial Note: While we adhere to strict Editorial Integrity, this post may contain references to products from our partners. Here's an explanation for How We Make Money. None of the data and information on this webpage constitutes investment advice according to our Disclaimer.
To trade with the 200-day MA you need to:
Spot trends. Price above MA indicates bullish; below suggests bearish.
Plan trades. Buy on pullbacks above MA, sell on surges below.
Use stop-loss. Place stop-loss near MA for risk management.
Combine tools. Validate signals with RSI or MACD to avoid false entries.
The 200-day moving average (200-day MA) is an indicator used not only by traders, but also many investors, as it allows them to identify medium and long-term trends. In this article we will walk through the differences between the main types of moving averages, how to trade a 200-day MA, main recommendations and strategies for working with this indicator.
How to trade a 200-day MA
The 200-day Moving Average (MA) is a widely used tool in trading, valued for its consistency over time. It helps identify long-term trends by showing how prices behave relative to the MA. Typically, during periods of low volatility, prices stay close to the 200-day MA. In times of high volatility, prices tend to move further away from it.
When the price is above the 200-day MA, it indicates a bullish trend, signaling potential buy opportunities. Conversely, when the price is below the 200-day MA, it suggests a bearish trend, favoring sell opportunities. Traders rely on this trend analysis to make informed decisions and improve their trading strategies.
In the example below, EUR/USD is in a long-term downward trend, and, accordingly, the prices have been fluctuating below MA200 over several months.
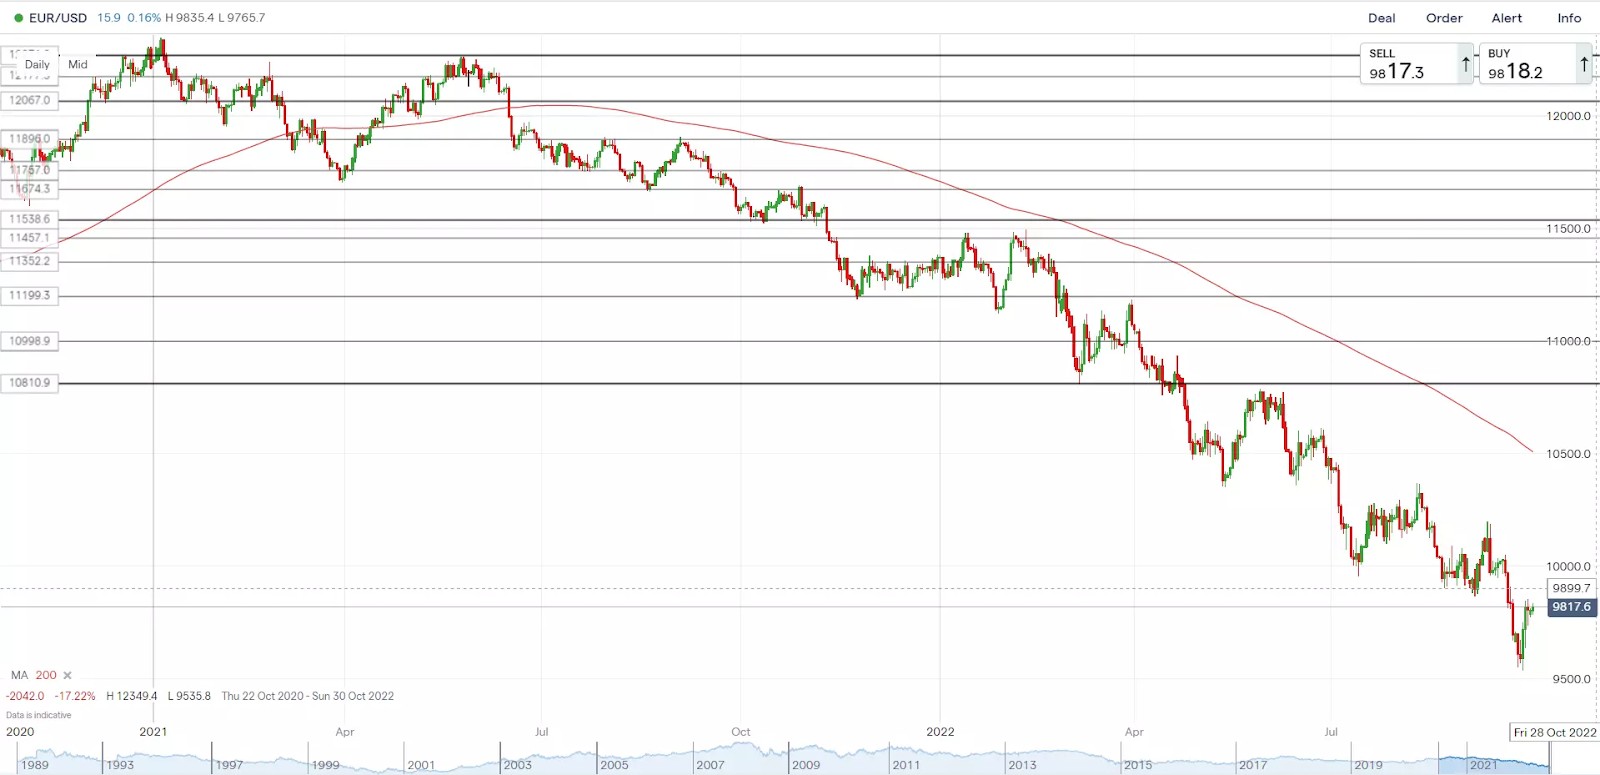
Therefore, the MA in this case serves as a downward resistance line, while each surge of the pair upward should be used for opening/adding short positions. Usually, a Stop-Loss is set above the indicator, which is why its drawback is that the price is moving at a certain distance from the indicator, and the potential loss in case a Stop-Loss order is triggered may exceed 200 pips. However, for a long-term trader with a profit goal of double or triple of that, such potential loss does not pose a huge problem.
The next example is the long-term upward trend of the USD/JPY pair.
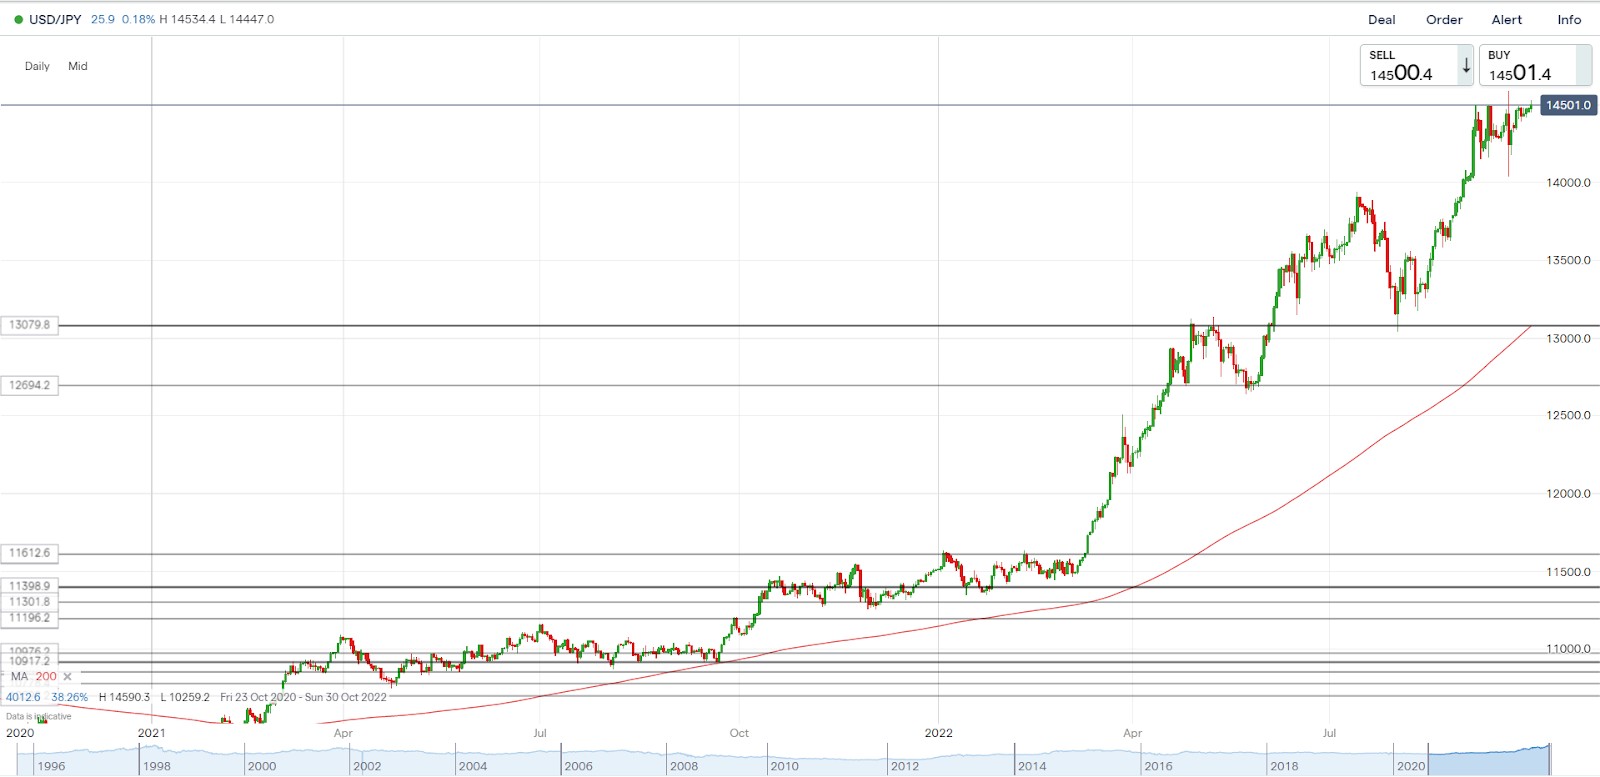
In this example, which is relevant at the moment, price fluctuations are happening above the MA200, which serves as the upward support line. Accordingly, the movements in its directions should be used either to buy or add to long positions, with a Stop-Loss order set below the moving average. On this example, the price is also moving at a certain distance from the MA, which is why in order to determine a more accurate point of entry to the market, you need to find “historical” potential support and resistance levels on the chart, or use the rollback to the level, which earlier served as resistance.
And, there is another quite interesting example, the USD/CHF pair, with a long period of relatively low volatility.

In this example, we can see that for a long time, the pair consolidated in a relatively narrow range, before registering a breakout upwards and reaching new extremes. Consolidation of the US dollar in the pair with the Swiss franc happened at the same time the USD confidently grew both against euro and Japanese yen (see above). This can be explained by the purchases of franc in other pairs, which “slowed down” the growth of the USD.
On this chart, the price fluctuated either above or below the MA200, with the price clearly bouncing off the upward support line. Therefore, on the one hand, we see how purchases in the area of the MA200 have clearly been a profitable strategy, and on the other hand – frequent close of the price below the moving average reveals the problem of setting a Stop-Loss order and complicates the calculation of potential profit. This confirms the necessity to take into consideration factors, including fundamental ones.
Considering the volatility of the markets, the strategy of buying/selling an instrument on the movements towards the MA200 does not always work, and that is one of the reasons why traders should not fully rely on the indicators of technical analysis, MA in particular, but use them in combination with others, taking into account the factors that could impact the performance of an instrument at a certain point in time.
The 200-day MA trading strategies
Moving averages are generally useful not only for determining the support and resistance zones and the direction of the trend and trading from these zones in the direction of the trend. In addition, traders use the so-called “crossovers” of slower MA by faster MA, which often confirms a trend reversal.
Bullish crossover happens, when a shorter moving average crosses a longer one upwards, in our case the 200-day moving average. It is also known as the golden cross. Bearish crossover happens, when a shorter moving average crosses the 200-day moving average downwards. This phenomenon is known as the death cross.
There is also a method of triple crossover, where three moving averages are involved. Once again, the signal is generated when the shortest moving average crosses two longer moving averages. The simple system of triple crossover may include a 50-day, 100-day and 200-day moving averages. Price crossovers can be combined for trading within a largest trend.
Let’s review the latest chart of the Dow Jones Index.
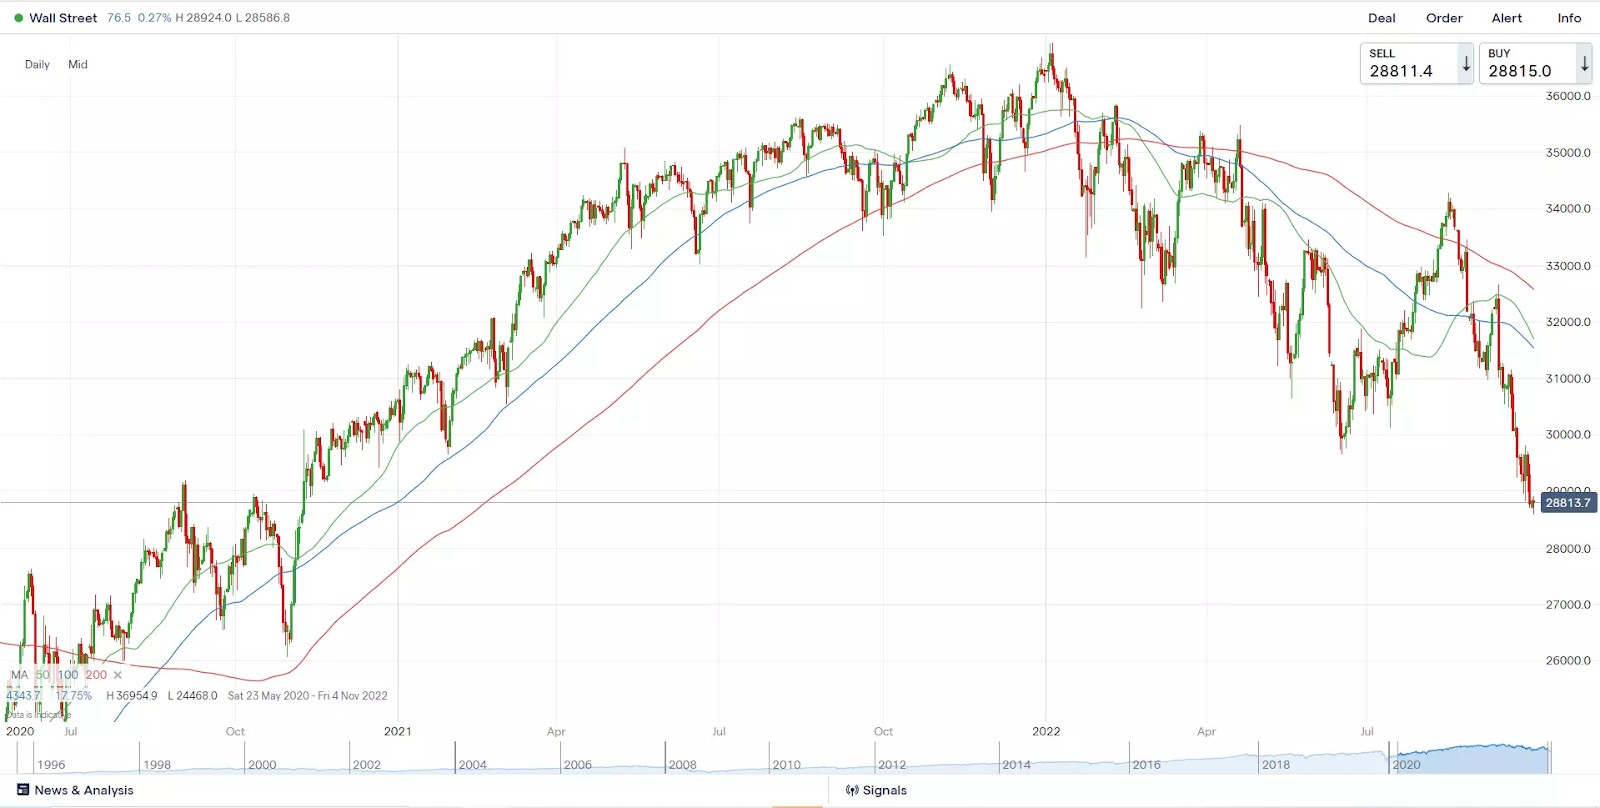
Here we can see here a clear crossover of the 50-day MA by 100-day MA and 200-day MA, i.e. the death cross and triple crossover, which clearly confirmed a reversal of a long-term upward trend and development of a downward trend. Therefore, movements towards the 200-day MA are good opportunities for selling at the best price.
Here's another example, this time WTI Crude Oil.
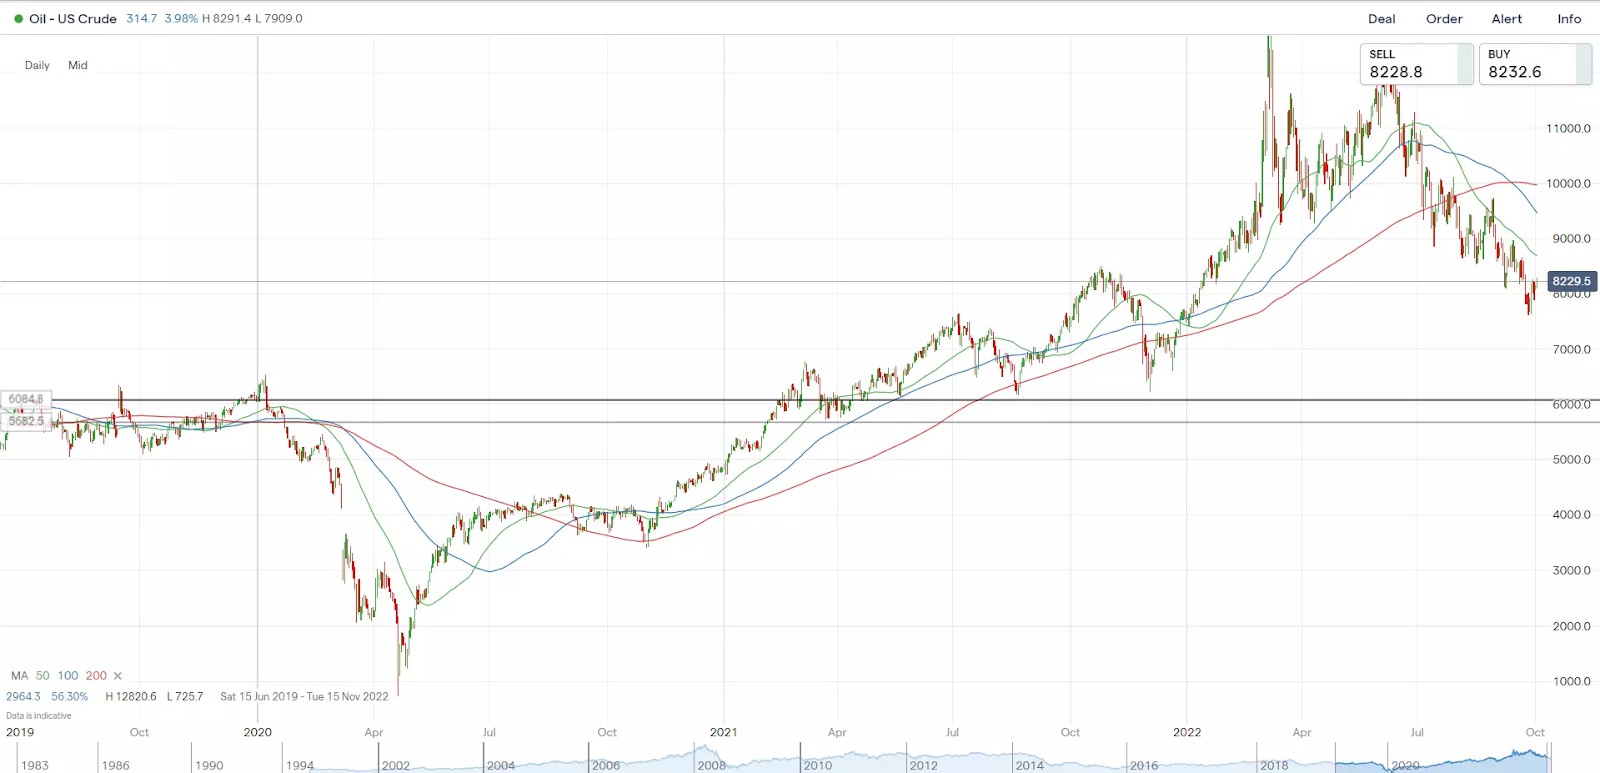
In 2020, we could observe a vivid example of confirmation of a downward trend reversal, where two shorter moving averages crossed the 200-day MA from below to above, thereby forming the golden cross and triple crossover, giving the buy signal. However, the signal is lagging, which is why it is better to trade on the rollbacks, preferably to the existing support levels.
In August of the same year, a reversal and formation of a downward trend (death cross) was observed. However, in that case, one needs to take into account that there is a certain shortage in the oil market along with increased global demand for energies, which is why the sale of the “black gold” is associated with rather high risks and the sell signal may turn out to be false.
We have compiled a list of brokers that support trading with the 200-day moving average. These brokers offer the tools and platforms necessary to implement these strategies effectively.
| Min. deposit, $ | Max. leverage | Min Spread EUR/USD, pips | Max Spread EUR/USD, pips | Deposit fee, % | Withdrawal fee, % | Open an account | |
|---|---|---|---|---|---|---|---|
| 100 | 1:300 | 0,5 | 0,9 | No | No | Open an account Your capital is at risk. |
|
| No | 1:500 | 0,5 | 1,5 | No | No | Open an account Your capital is at risk.
|
|
| No | 1:200 | 0,1 | 0,5 | No | No | Open an account Your capital is at risk. |
|
| 100 | 1:50 | 0,7 | 1,2 | No | No | Study review | |
| No | 1:30 | 0,2 | 0,8 | No | Yes | Open an account Your capital is at risk. |
How to avoid false signals when trading the 200-day MA
Avoiding false signals when trading the 200-day Moving Average (MA) requires combining it with other technical indicators to validate market entry points. Indicators such as RSI (Relative Strength Index) and MACD (Moving Average Convergence Divergence) can provide additional confirmation, making your analysis more robust.
One effective approach is to use a combination of three Moving Averages alongside the RSI. A crossover signal from the Moving Averages carries more weight when the RSI indicates strong overbought or oversold conditions. Conversely, if the RSI is in a neutral zone, the signal may be less reliable.
By integrating multiple indicators, traders can better filter out false signals, enhancing the accuracy of their trades and improving overall decision-making.
200-day SMA vs 200-day EMA
- Pros of 200-day SMA
- Cons of 200-day SMA
- Simplicity. The 200-day SMA is easy to calculate and widely used, making it a common benchmark for long-term trend analysis.
- Stability. By giving equal weight to all data points, the SMA provides a smooth representation of price trends, filtering out short-term market noise effectively.
- Lagging indicator. The equal weighting causes the SMA to react slower to recent price changes, potentially delaying signals for trend reversals or new trends.
- Less responsive. In volatile markets, the SMA may not reflect rapid price movements promptly, which can be a drawback for traders seeking timely insights.
- Pros of 200-day EMA
- Cons of 200-day EMA
- Responsiveness. The 200-day EMA gives more weight to recent prices, allowing it to react faster to current market conditions and provide earlier signals.
- Timely signals. Its sensitivity to recent data makes the EMA useful for traders looking to take advantage of short-term market movements.
- Susceptibility to false signals. The increased sensitivity can lead to more frequent false signals, especially during periods of market volatility or consolidation.
- Complex calculation. The EMA's formula is more intricate than the SMA's, which might be challenging for those who prefer simplicity.
The choice between the 200-day SMA and EMA depends on trading strategies and objectives. The SMA offers a smoother, more stable view of long-term trends, making it suitable for long-term investors. On the other hand, the EMA provides quicker responses to price changes, which is useful for traders who prioritize timely market entry and exit points.
To boost your trading with the 200 MA, watch for the "Golden Cross" and "Death Cross"

To boost your trading game with the 200-day moving average, watch for the "Golden Cross" and "Death Cross" patterns. A Golden Cross happens when a short-term moving average, like the 50-day, moves above the 200-day, hinting at a potential uptrend. On the flip side, a Death Cross is when the 50-day dips below the 200-day, suggesting a downtrend. Spotting these crossovers can help you decide when to jump into or out of trades, keeping you in sync with market trends.
Also, think of the 200-day moving average as a flexible support or resistance line. In an uptrend, prices might bounce off this line, acting as support; during a downtrend, it could act as a ceiling. By keeping an eye on how prices behave around this average, you can better time your trades and make the most of market moves.
Summary
In conclusion, while the Moving Average remains a popular and reliable tool, it’s important to remember that it’s not a magic bullet. Just like any other indicator, it has its limitations, and blindly following its signals without context can lead to mistakes.
I’ve seen how much the markets have changed over the past few decades. Five, ten, or twenty years ago, trading patterns were more consistent, and trends often followed classic models that made reversals and continuations easier to spot. Back then, markets reacted predictably to news and fundamental factors, which made traditional indicators like the Moving Average feel more reliable.
Now, things are different. Markets are faster, more complex, and influenced by everything from algorithmic trading to global events. Reactions to news can be inconsistent, and many of the old rules no longer apply. That’s why it’s more important than ever to use the Moving Average alongside other tools and strategies to navigate today’s ever-changing market landscape.
FAQs
What is a 200-day Мoving Average?
The 200-day Moving Average (MA) is a widely used technical analysis tool that calculates the average price of an asset over the past 200 days. It helps traders and investors identify long-term market trends and is valued for its simplicity and reliability.
200-day MA vs 200 EMA – what are the pros and cons?
The 200-day Simple Moving Average (SMA) lags behind price changes, making it ideal for long-term trend analysis, while the 200-day Exponential Moving Average (EMA) reacts faster to price movements but carries a higher risk of false signals in volatile markets.
How do I trade using the 200-day MA?
Traditionally, the 200-day MA is used for trend trading, i.e. when the price is moving above the 200-day MA, rollbacks should be used to buy, while when the price moves below the 200-day MA – to sell.
What trading strategies use the 200-day MA?
The golden cross and death cross are two of the most reliable strategies involving the 200-day MA. A golden cross occurs when a shorter moving average crosses the 200-day MA from below, signaling a bullish trend. A death cross happens when a shorter moving average crosses the 200-day MA from above, indicating a bearish trend.
Related Articles
Team that worked on the article
Alamin Morshed is a contributor at Traders Union. He specializes in writing articles for businesses that want to improve their Google search rankings to compete with their competition. With expertise in search engine optimization (SEO) and content marketing, he ensures his work is both informative and impactful.
Chinmay Soni is a financial analyst with more than 5 years of experience in working with stocks, Forex, derivatives, and other assets. As a founder of a boutique research firm and an active researcher, he covers various industries and fields, providing insights backed by statistical data. He is also an educator in the field of finance and technology.
As an author for Traders Union, he contributes his deep analytical insights on various topics, taking into account various aspects.
Mirjan Hipolito is a journalist and news editor at Traders Union. She is an expert crypto writer with five years of experience in the financial markets. Her specialties are daily market news, price predictions, and Initial Coin Offerings (ICO).
An investor is an individual, who invests money in an asset with the expectation that its value would appreciate in the future. The asset can be anything, including a bond, debenture, mutual fund, equity, gold, silver, exchange-traded funds (ETFs), and real-estate property.
Forex trading, short for foreign exchange trading, is the practice of buying and selling currencies in the global foreign exchange market with the aim of profiting from fluctuations in exchange rates. Traders speculate on whether one currency will rise or fall in value relative to another currency and make trading decisions accordingly. However, beware that trading carries risks, and you can lose your whole capital.
Algorithmic trading is an advanced method that relies on advanced coding and formulas based on a mathematical model. However, compared to traditional trading methods, the process differs by being automated.
Index in trading is the measure of the performance of a group of stocks, which can include the assets and securities in it.
A long position in Forex, represents a positive outlook on the future value of a currency pair. When a trader assumes a long position, they are essentially placing a bet that the base currency in the pair will appreciate in value compared to the quote currency.


-
 Afghanistan
-
 Albania
-
 Algeria
-
 Argentina
-
 Armenia
-
 Australia
-
 Austria
-
 Azerbaijan
-
 Bahamas
-
 Bahrain
-
 Bangladesh
-
 Belgium
-
 Botswana
-
 Brazil
-
 Brunei
-
 Bulgaria
-
 Burma
Burma
-
 Cambodia
-
 Cameroon
-
 Canada
-
 Chile
Chile
-
 China
China
-
 Colombia
-
 Costa Rica
-
 Cote d'Ivoire
-
 Croatia
-
 Cyprus
-
 Czech Republic
-
 Denmark
-
 Dominican Republic
-
 Ecuador
-
 Egypt
Egypt
-
 Estonia
-
 Eswatini
-
 Ethiopia
-
 Finland
-
 France
-
 Georgia
-
 Germany
-
 Ghana
Ghana
-
 Greece
-
 Haiti
Haiti
-
 Hong Kong
-
 Hungary
-
 India
India
-
 Indonesia
-
 Iran, Islamic republic
-
 Iraq
Iraq
-
 Ireland
-
 Israel
-
 Italy
Italy
-
 Jamaica
-
 Japan
Japan
-
 Jordan
-
 Kazakhstan
-
 Kenya
Kenya
-
 Korea
Korea
-
 Kuwait
-
 Kyrgyzstan
-
 Laos
Laos
-
 Latvia
-
 Lebanon
-
 Libyan Arab Jamahiriya
-
 Lithuania
-
 Luxembourg
-
 Macedonia
-
 Madagascar
-
 Malaysia
-
 Malta
Malta
-
 Mauritius
-
 Mexico
-
 Moldova
-
 Mongolia
-
 Montenegro
-
 Morocco
-
 Mozambique
-
 Namibia
-
 Nepal
Nepal
-
 Netherlands
-
 Nigeria
-
 Norway
-
 Oman
Oman
-
 Pakistan
-
 Palestine
-
 Papua New Guinea
-
 Peru
Peru
-
 Philippines
-
 Poland
-
 Portugal
-
 Puerto Rico
-
 Qatar
Qatar
-
 Romania
-
 Rwanda
-
 Saudi Arabia
-
 Serbia
-
 Singapore
-
 Slovakia
-
 Slovenia
-
 Somalia
-
 South Africa
-
 Spain
Spain
-
 Sri Lanka
-
 Sweden
-
 Switzerland
-
 Syrian Arab Republic
-
 Taiwan
-
 Tajikistan
-
 Tanzania, United Republic Of
-
 Thailand
-
 Trinidad and Tobago
-
 Tunisia
-
 Turkey
-
 UAE
UAE
-
 Uganda
-
 Ukraine
-
 United Kingdom
-
United States
-
 Uzbekistan
-
 Venezuela
-
 Vietnam
-
 Yemen
Yemen
-
 Zambia
-
 Zimbabwe
- Forex
- Crypto
