
Best RSI Settings And Strategies For Day Trading


Editorial Note: While we adhere to strict Editorial Integrity, this post may contain references to products from our partners. Here's an explanation for How We Make Money. None of the data and information on this webpage constitutes investment advice according to our Disclaimer.
The best RSI settings and indicator strategies for day trading:
Strategy 1. Using RSI combined with the 30 and 70 levels to buy and sell signals.
Strategy 2. Buy signals when RSI (Period = 2) is in an oversold situation and the price is above SMA (200).
Strategy 3. Opening trades at the moment of divergence identification.
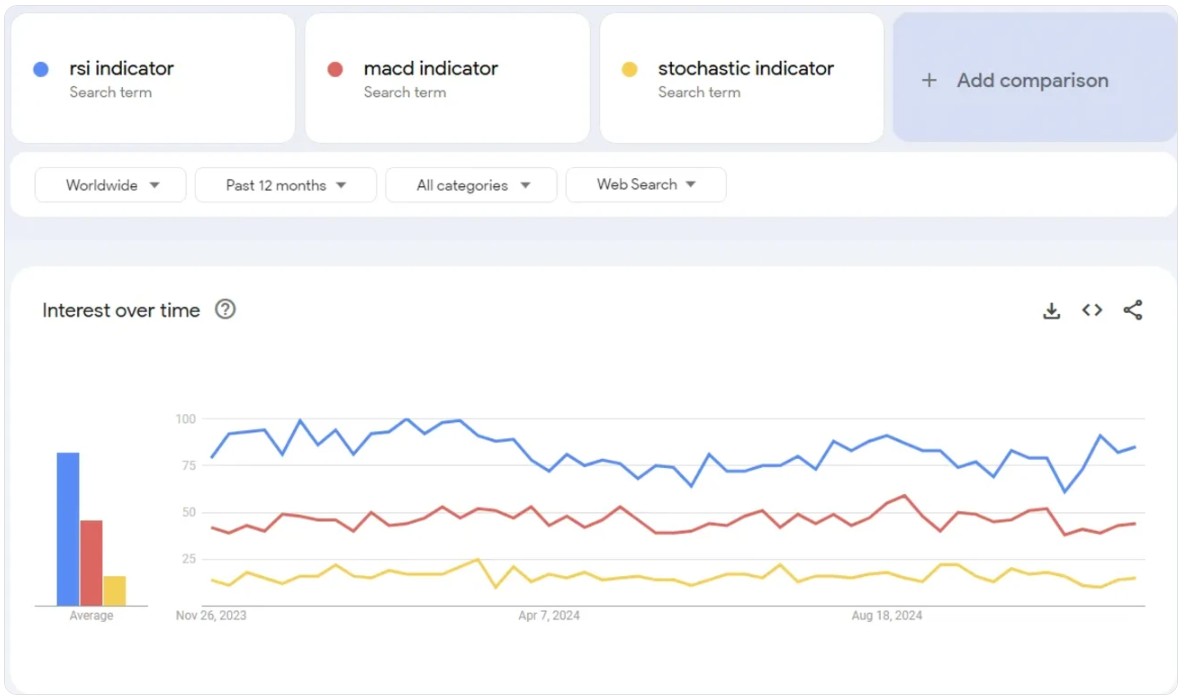
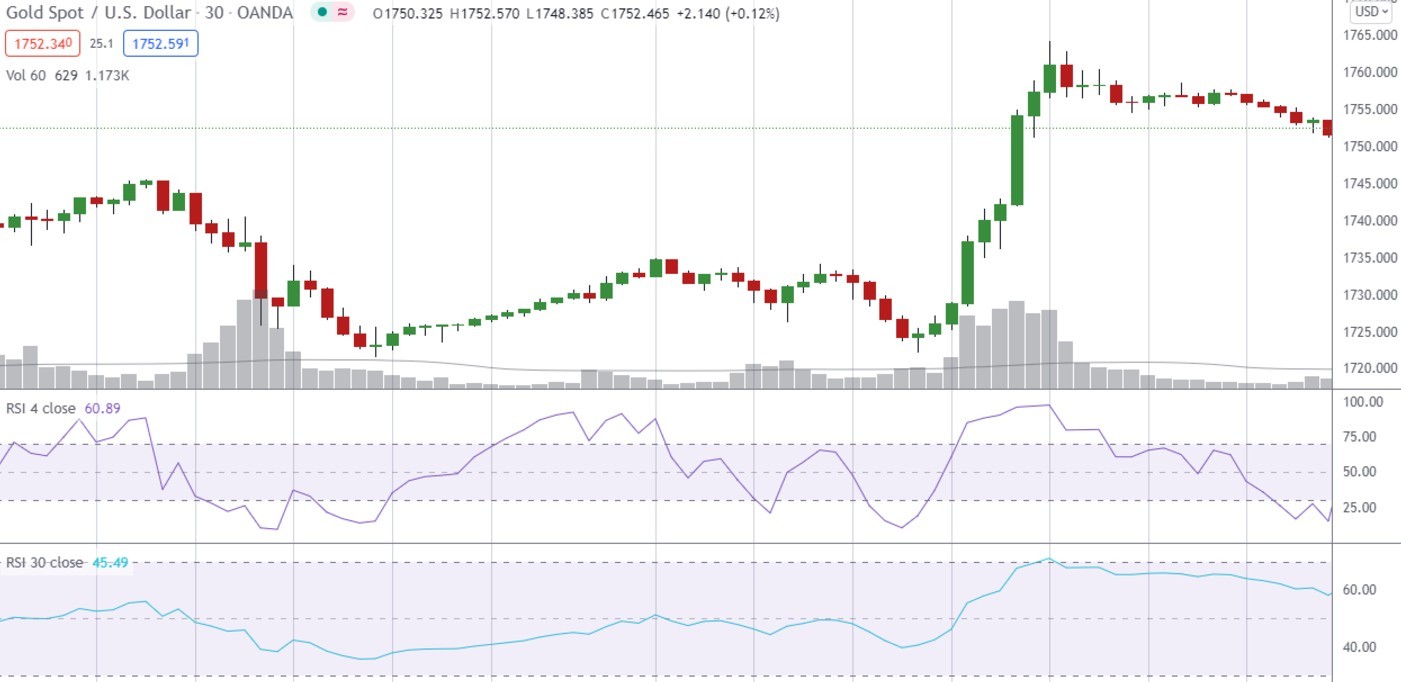
The RSI (relative strength index) indicator was introduced to the world by J. Welles Wilder Jr. in his book “New Concepts in Technical Trading Systems”. It is a momentum oscillator designed to show when a security is overbought or oversold. Despite the fact that the book was released in 1978, the indicator remains relevant fifty years later. It is one of the most popular indicators for trading, as it is searched on Google more often than the others.
Top 3 RSI settings and indicator strategies
Because RSI is a universal indicator, there are many options on how to use it. Let’s review some of the best RSI settings:
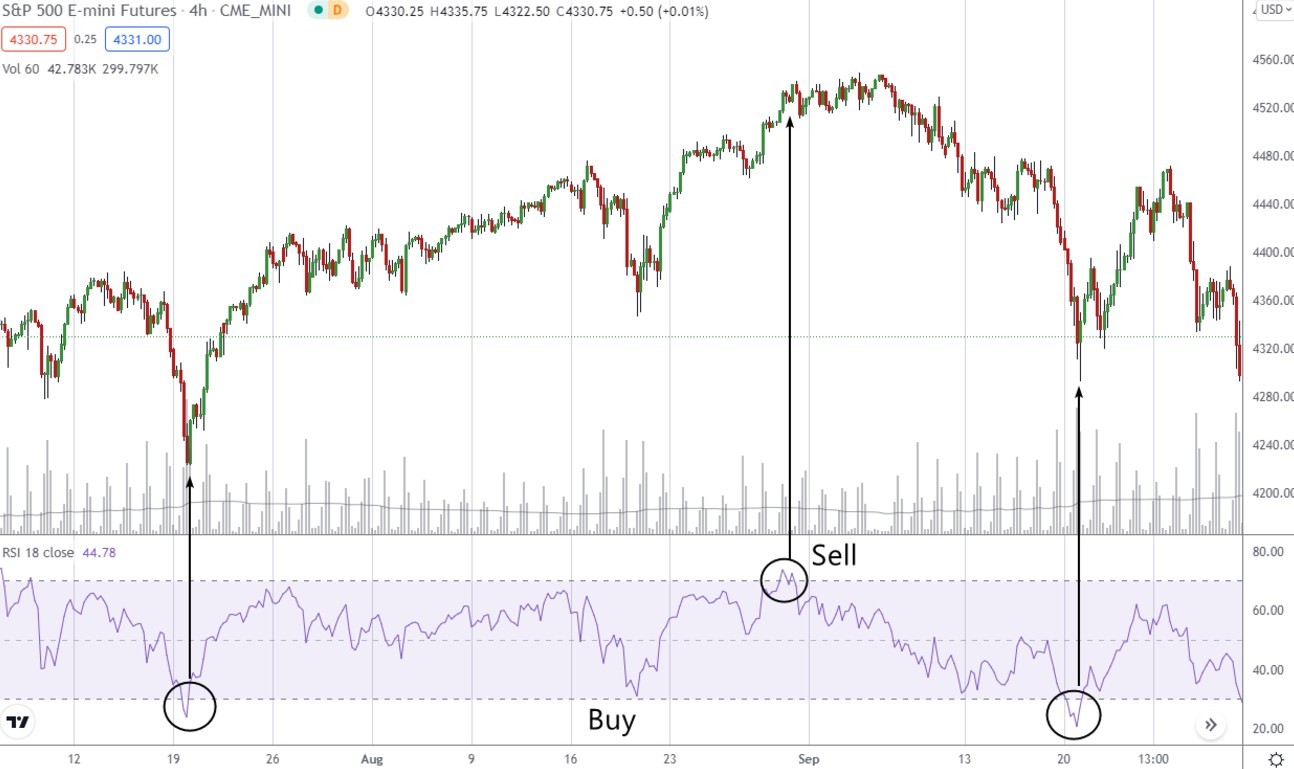
Strategy 1
In his book, Wilder recommended using RSI combined with the 30 and 70 levels, specifically. Buy when the indicator leaves the oversold zone (crosses the 30 line in an upward movement). Sell when the indicator leaves the overbought zone (crosses the 70 line in a downward movement).
Although the RSI indicator can be used in this simplistic form it is more effective when combined with a variety of technical analysis and a review of the weight of evidence. Otherwise, traders would just set automated strategies for RSI and it would work consistently. However, that is not the case. It should be considered one tool in the tool box of RSI trading strategies and settings.
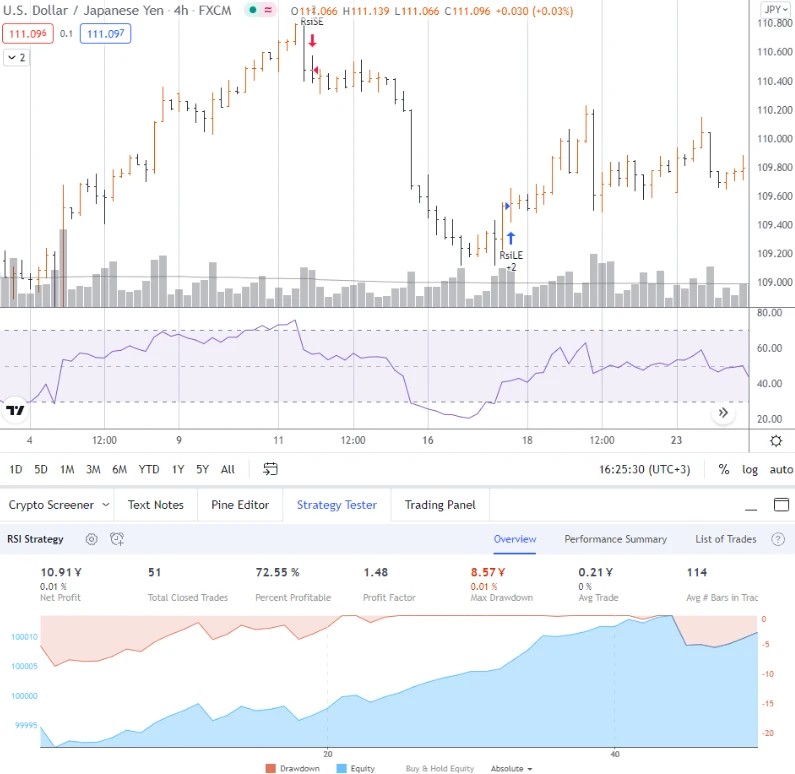
Example of the best RSI settings. On the price chart (see the screenshot below), the red arrow indicates entry into a short position. The blue arrow indicates exit from short and entry into a long position.
This approach, when a position is closed on a signal to enter a position in the opposite direction, assumes that the trader is always in a position, “flipping” it based on the indicator signals. Technically, this is permissible and forms a basic RSI strategy. However, by a few tweaking one can get this close to the best RSI settings.
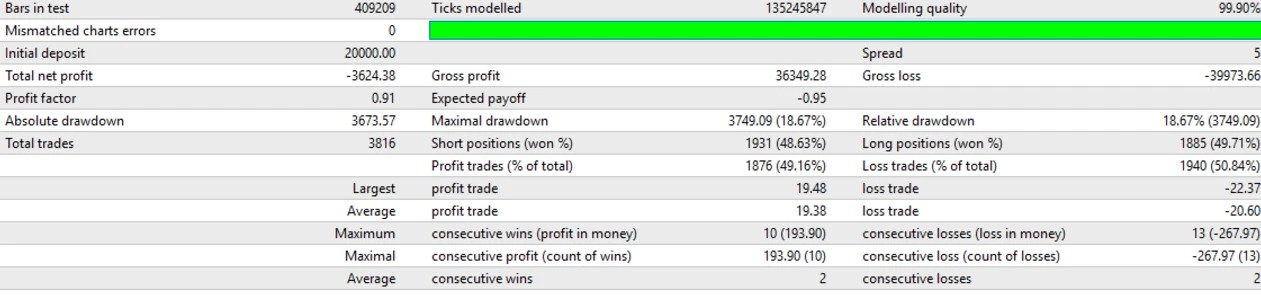
Strategy tester indicates that with this approach, when the trader is always in position, trading on the RSI (14) signals on a four-hour USD/JPY currency pair chart showed a profit factor (profit/loss ratio) of 1.45. It is a worthy result, but 50 trades is not enough to prove the efficiency of the best RSI settings and trading strategy. After performing more tests, we came to a conclusion that in the longer run, the result of intraday trading based on the RSI indicator becomes less optimistic due to false signals that arise in ranging markets.
Best RSI settings with stop losses and take profits
What if you don’t hold the position all the time, but add Stop Loss and Take Profit settings? Then, the position won’t “flip”; it will close when the specified values of profit or loss are reached.
To do this, you can also use a robot that:
buys when the indicator leaves the oversold zone;
sells when the indicator leaves the overbought zone.
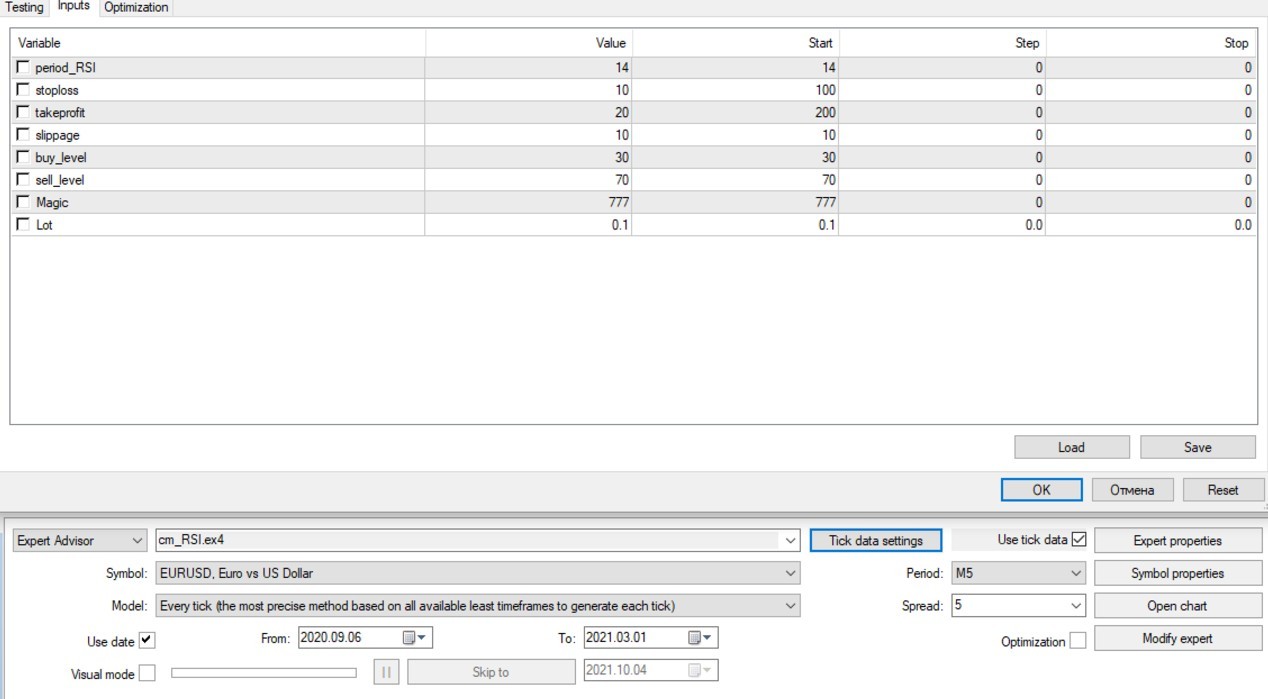
Such robot will allow you to set Stop Loss and Take Profit and also change the RSI Period and signal levels 30-70. Here’s how it looks on the chart.
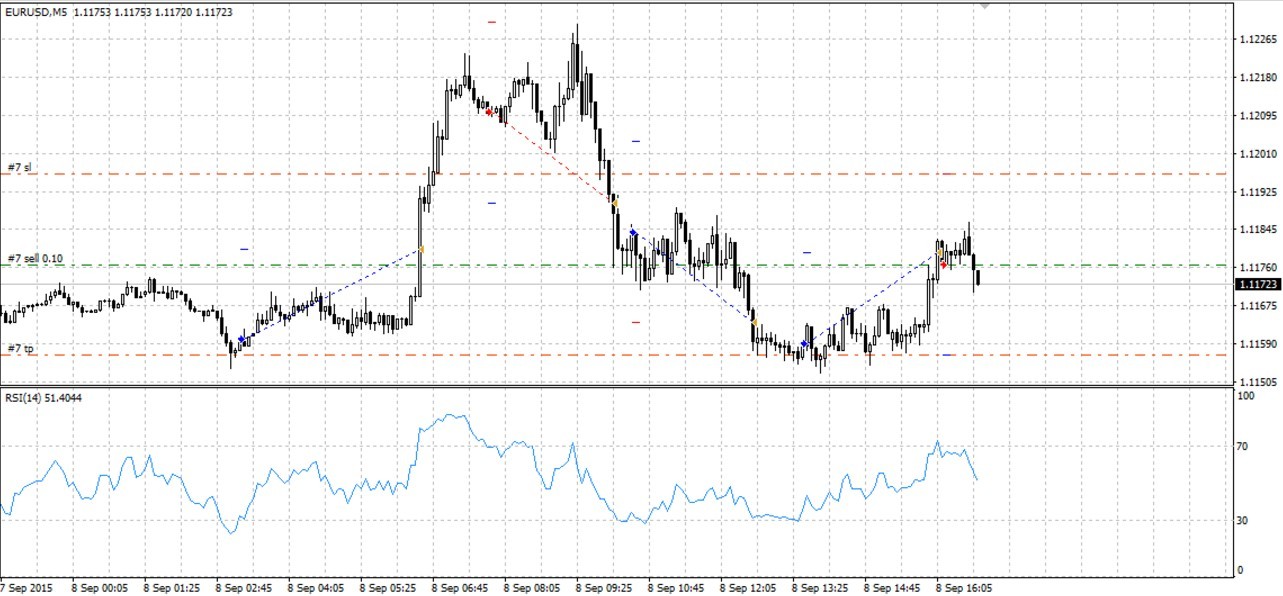
Out of 4 trades, 3 closed at a profit, having compensated the loss on the one unprofitable trade. We launched the robot for testing on an intraday 5-minute EUR/USD chart, having used the data for several months.
These trades were also cross-verified with the RSI trendline to confirm RSI signals and avoid premature entries.
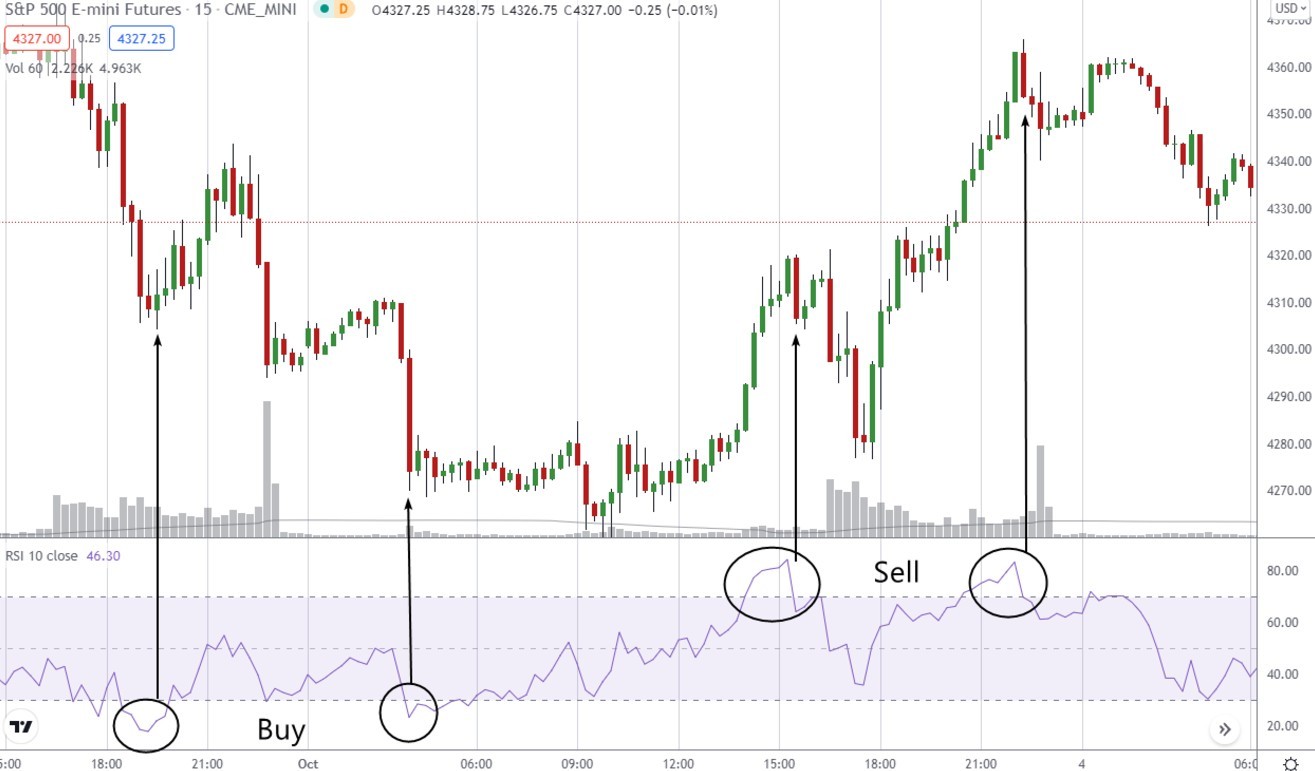
Strategy 2
Testing Strategy No. 1 for RSI trading highlighted the importance of non-standard approaches or combining RSI with other indicators. Following Larry Connors’ approach, signals are refined by focusing on extreme RSI levels (10 for oversold and 90 for overbought) providing fewer but more reliable signals is one of the best RSI settings. An additional condition requires the price to be above the 200-day SMA, a widely used trend indicator in asset management.
A strategy developed by Larry Connors can be one of the solutions. According to the rules of the strategy, a trader enters a buy position if;
RSI (Period = 2) is in an oversold situation;
The price is above SMA (200);
Signal levels are set to equal 10 and 90.
The reverse is applicable for the sell opportunity. This idea is focused on trading the main trend, but with an entry at corrections. The strategy can be applied for the buy opportunities in a growing stock market or other markets with a pronounced trend.
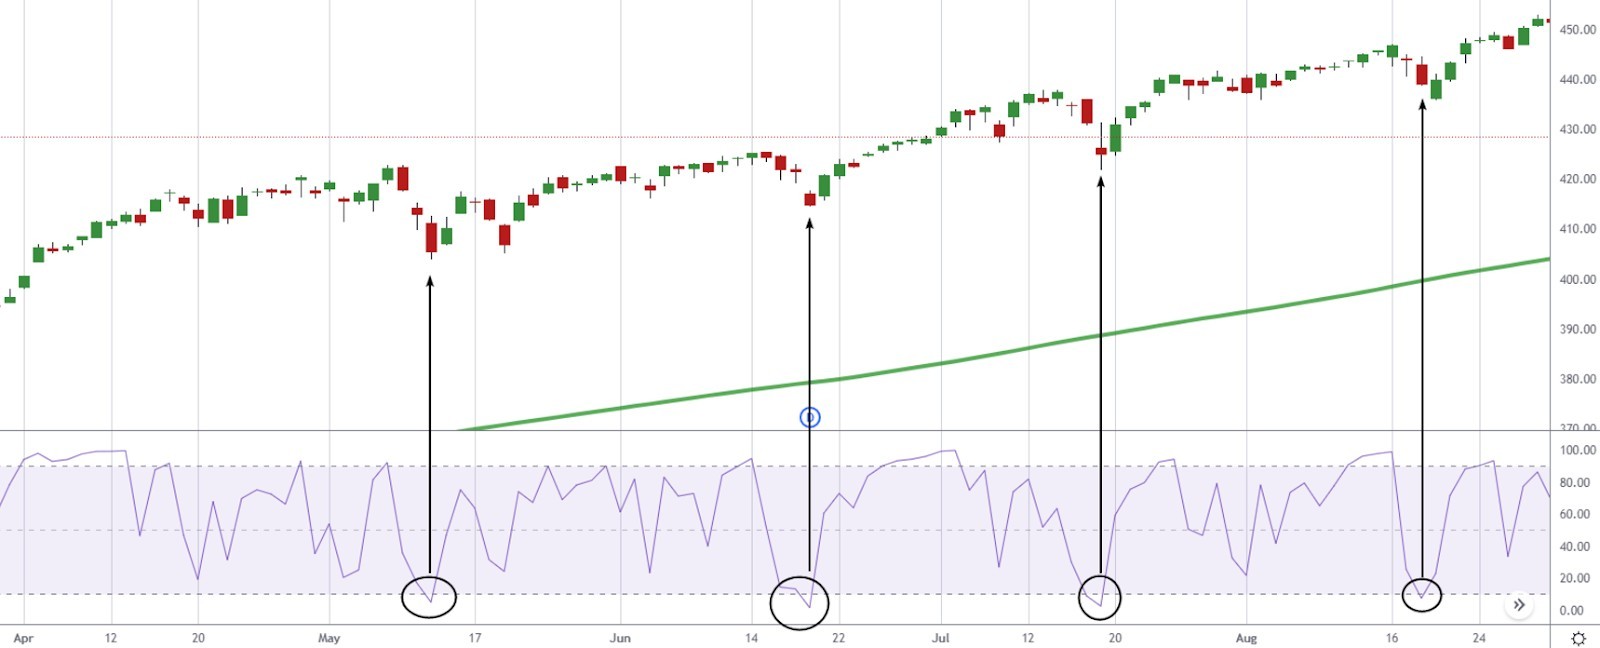
The arrows show 4 strategy-based signals. Every time, right after the entry we see two upward candlesticks that make the strategy nearly perfect. However, truth be told, such stable trends don’t happen often in the US stock market, which is why you need to be very picky in terms of market choice in order to use the strategy, for example focus on the intraday timeframes, where the trends occur more often, albeit they are shorter.
Strategy 3
Another useful RSI strategy involves spotting divergences between price and the indicator, which can signal potential trend reversals. For instance, in bearish divergence, the price makes higher highs while the RSI fails to do so, indicating a weakening trend and a possible reversal. In contrast, a bullish divergence occurs when price makes lower lows but RSI forms higher lows, which suggests strength building up for a bounce. This method is particularly effective during trend exhaustion, allowing traders to anticipate changes early.
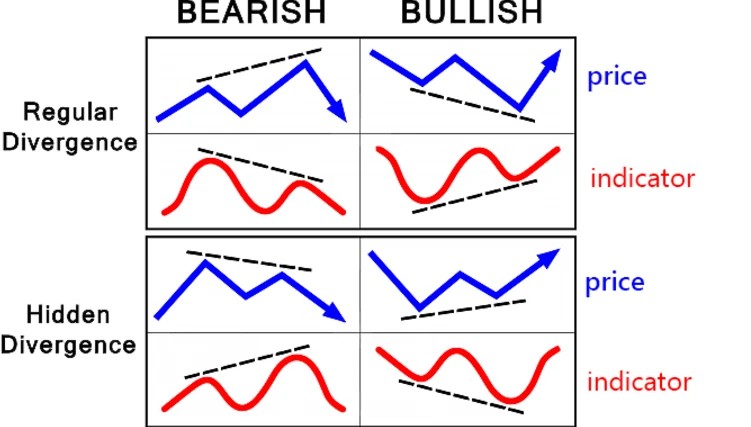
RSI divergence occurs when the direction of the RSI conflicts with the direction of the price.
Recognizing this setup alongside a clean RSI trendline can offer high-quality entries when combined with supporting price action cues.
What are the best day-trading brokers?
What makes a good day trading broker
Choosing the right broker is one of the most important decisions a trader can make, especially for those involved in day trading. A good broker provides not only fast execution and low spreads but also robust infrastructure that supports high-frequency strategies in volatile financial markets.
The best day trading brokers meet the following key criteria to meet the best RSI settings. First, they must offer high trading volumes to ensure liquidity. Liquidity is essential for day traders, as it allows them to enter and exit positions quickly without significantly impacting the market price. Fast execution is the difference between capitalizing on a move or missing it entirely when working within very short timeframes.
Importance of ECN accounts and low spreads
Brokers that offer ECN accounts with raw market spreads are ideal for day trading. Tighter spreads translate to reduced trading costs, which is especially important when placing a high number of trades per session. Even minor inefficiencies can add up quickly in a scalping or high-frequency environment, making ultra-low costs a necessity rather than a luxury.
These accounts are often preferred by professional traders and institutions, as they provide direct access to market liquidity and help maintain a competitive edge in fast-moving financial markets.
The role of technology and trading platforms
Features that support trade automation, such as algorithmic strategy execution and advanced trading platforms like MetaTrader 5 (MT5) and cTrader, are no longer optional, they are essential. One of the critical aspects of automated trading is setting up technical indicators correctly, and for many traders, finding the best RSI settings is key to maximizing profitability. With day trading rapidly evolving through the use of automated bots and AI-driven tools, having a platform that supports these integrations is vital.
Most trading platforms now come equipped with features like one-click trading, API access, and real-time data feeds, all of which are critical for modern intraday trading strategies. These tools allow traders to test, optimize, and deploy custom trading models with minimal delay. To further enhance the precision of automated strategies, traders often experiment with the best RSI settings to adapt to different market conditions and achieve better signal accuracy.
Why VPS and execution speed matter
Execution speed can make or break a day trader. That’s why a reliable Virtual Private Server (VPS) is a major advantage. A good VPS offers a stable, high-speed internet connection that minimizes latency and maximizes execution accuracy. In intraday trading, where every millisecond counts, using a VPS can dramatically improve trade outcomes.
Latency issues, even by a fraction of a second, can cause slippage, missed entries, or unfavorable exits. Brokers that provide free or subsidized VPS services stand out as ideal choices for day trading professionals.
Matching brokers with trader needs
Not all brokers are built for day trading. Those that are will offer deep liquidity, tight spreads, cutting-edge trading platforms, fast execution, and tools that support algorithmic and manual strategies alike. Most importantly, they will help traders take full advantage of the opportunities in financial markets, especially during high-volatility periods common in intraday trading.
| Day Trading | Demo | Min. deposit, $ | Max. leverage | ECN Spread EUR/USD | Max. Regulation Level | TU overall score | Open an account | |
|---|---|---|---|---|---|---|---|---|
| Yes | Yes | 100 | 1:500 | 0,1 | Tier-1 | 9.1 | Open an account Your capital is at risk. |
|
| Yes | Yes | 5 | 1:1000 | 0,2 | Tier-1 | 9 | Open an account Your capital is at risk. |
|
| Yes | Yes | 10 | 1:2000 | 0,2 | Tier-3 | 8.9 | Open an account Your capital is at risk. |
|
| Yes | Yes | 10 | 1:500 | 0,2 | Tier-1 | 8.6 | Open an account Your capital is at risk. |
|
| Yes | Yes | 100 | 1:500 | 0,3 | Tier-1 | 8.69 | Open an account Your capital is at risk. |
Why trust us
We at Traders Union have analyzed financial markets for over 14 years, evaluating brokers based on 250+ transparent criteria, including security, regulation, and trading conditions. Our expert team of over 50 professionals regularly updates a Watch List of 500+ brokers to provide users with data-driven insights. While our research is based on objective data, we encourage users to perform independent due diligence and consult official regulatory sources before making any financial decisions.
Learn more about our methodology and editorial policies.
RSI indicator settings - what you should know
Understanding RSI settings for different trading styles
The Relative Strength Index (RSI) is a highly flexible indicator that adapts well to different trading styles and changing market conditions. Whether you're a swing trader or a scalper, customizing your RSI settings allows for better alignment with your trading objectives. By default, RSI operates on a 14-period setting, which serves as a middle ground between sensitivity and stability. This standard, introduced by Wilder, has stood the test of time, but it’s far from one-size-fits-all.
Optimizing RSI starts with choosing the best RSI settings for your specific trading style. Shorter settings increase responsiveness and suit fast-paced markets, while longer periods filter out noise for those who prefer steadier, trend-following strategies. Traders often test these variations using historical data to fine-tune performance based on backtested results.
How RSI period and behavior impact signals
Altering the RSI period directly influences the speed and frequency of signals. Shorter RSI period settings such as 4 or 7 make the indicator highly sensitive to small market fluctuations, making them ideal for aggressive strategies like scalping or day trading. In contrast, a 21 or 30-period RSI is smoother and works well for spotting broader trends in swing trading setups.
The RSI behavior also changes across different timeframes. For instance, a low RSI reading on a 5-minute chart might suggest a short-term pullback, while the same RSI value on a daily chart may signal a potential trend reversal. Understanding this dynamic is key to effective application of RSI across multiple timeframes.
RSI day trading settings
For traders operating in fast-paced markets like stock index futures, shorter timeframes demand quicker reaction times. That’s where optimized RSI day trading settings come in. Using a Period between 7 and 14 on a 5-minute chart can help capture rapid price swings with precision. Many day traders favor an RSI of 10 for balancing sensitivity and reliability.
This approach helps capitalize on intraday price volatility, especially when combined with chart patterns or volume analysis. As always, traders should validate these configurations using price data and historical performance before implementing them in live trades.
RSI swing trading settings
Longer-term traders typically hold positions for several hours or days. For this group, the settings for swing trading need to reflect stability rather than speed. Common RSI swing trading configurations include periods of 14, 18, or even 21. These allow traders to ride broader trends and avoid false entries caused by short-term fluctuations.
For example, using RSI (18) on a 4-hour chart offers a well-balanced approach. It smooths out erratic movements while still being responsive enough to catch trend shifts. Traders often validate these setups using price data and examine how the RSI indicator is calculated through the standard RSI formula, which considers average gain and loss over the set period.
Backtesting and refining RSI settings
Before applying any RSI configuration, backtesting on historical data is essential. This allows you to assess performance, drawdowns, and win rates across different market conditions. By evaluating how specific RSI settings behave over time, traders can confidently select setups aligned with their risk tolerance and strategy goals.
Additionally, non-traditional chart types like Heiken Ashi, Range, or Point & Figure can offer new perspectives on RSI. These formats help traders see how RSI behavior shifts when plotted against alternative visual representations of market data.
The versatility of the RSI indicator makes it an indispensable part of any trader’s toolkit. Whether you're engaging in rapid day trading or more patient swing trading, tuning your RSI settings allows you to better align with your preferred strategy. Understanding how RSI reading, RSI value, and RSI behavior interact with price and time is crucial for making informed, confident trading decisions.
By grounding your approach in data, customizing your RSI period settings, and continuously refining through testing, you position yourself to extract consistent value from one of the market’s most reliable technical indicators.
How to use RSI signals?
We recommend starting your intraday RSI trading experiments with the analysis of divergences. This approach enhances the accuracy of RSI signals by combining RSI with trend confirmation tools and helps in identifying overbought or oversold conditions in real time.
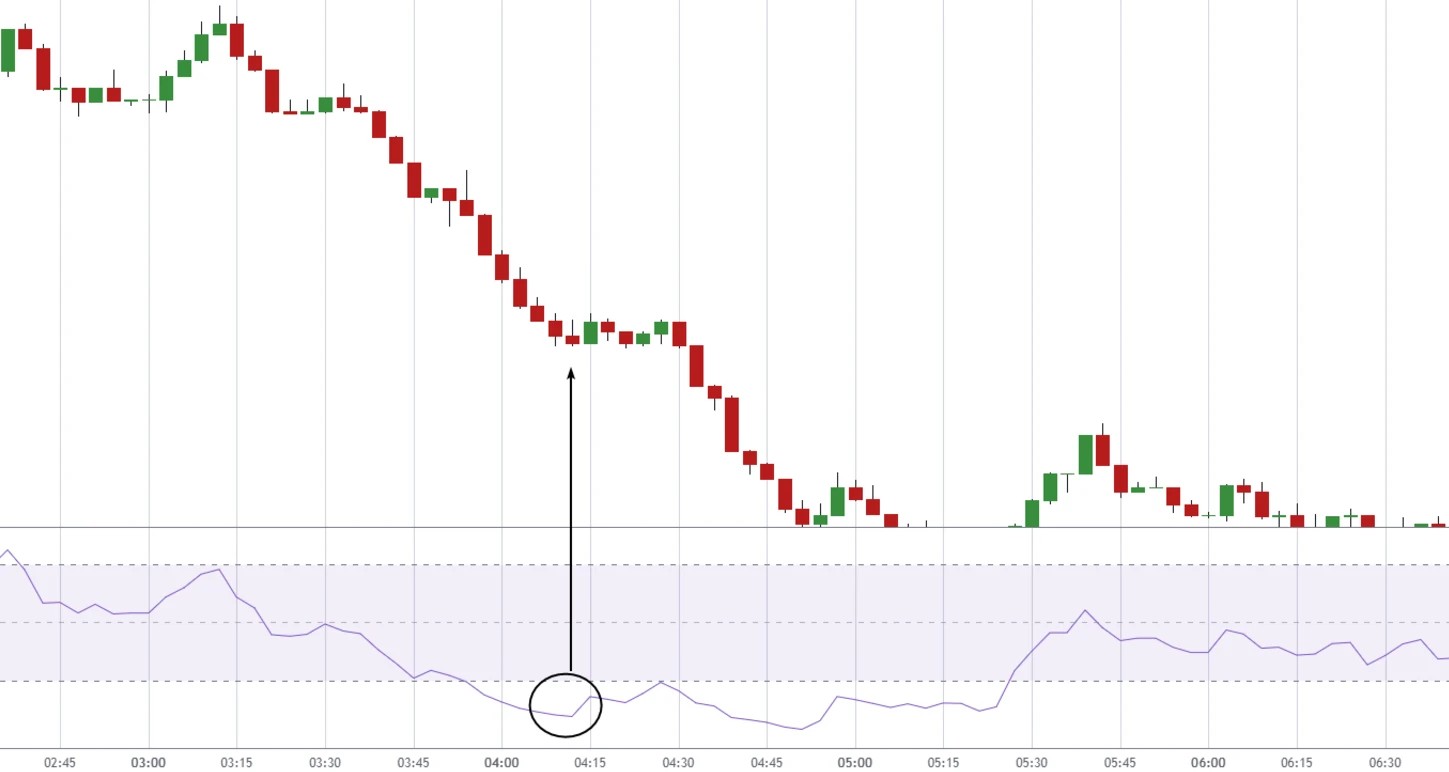
Example. The 3-minute USD/JPY chart shows a triple bullish divergence on the RSI indicator. In such cases, where an asset's RSI falls while the price forms a flat or rising trend, it often highlights the weakening of bearish pressure.
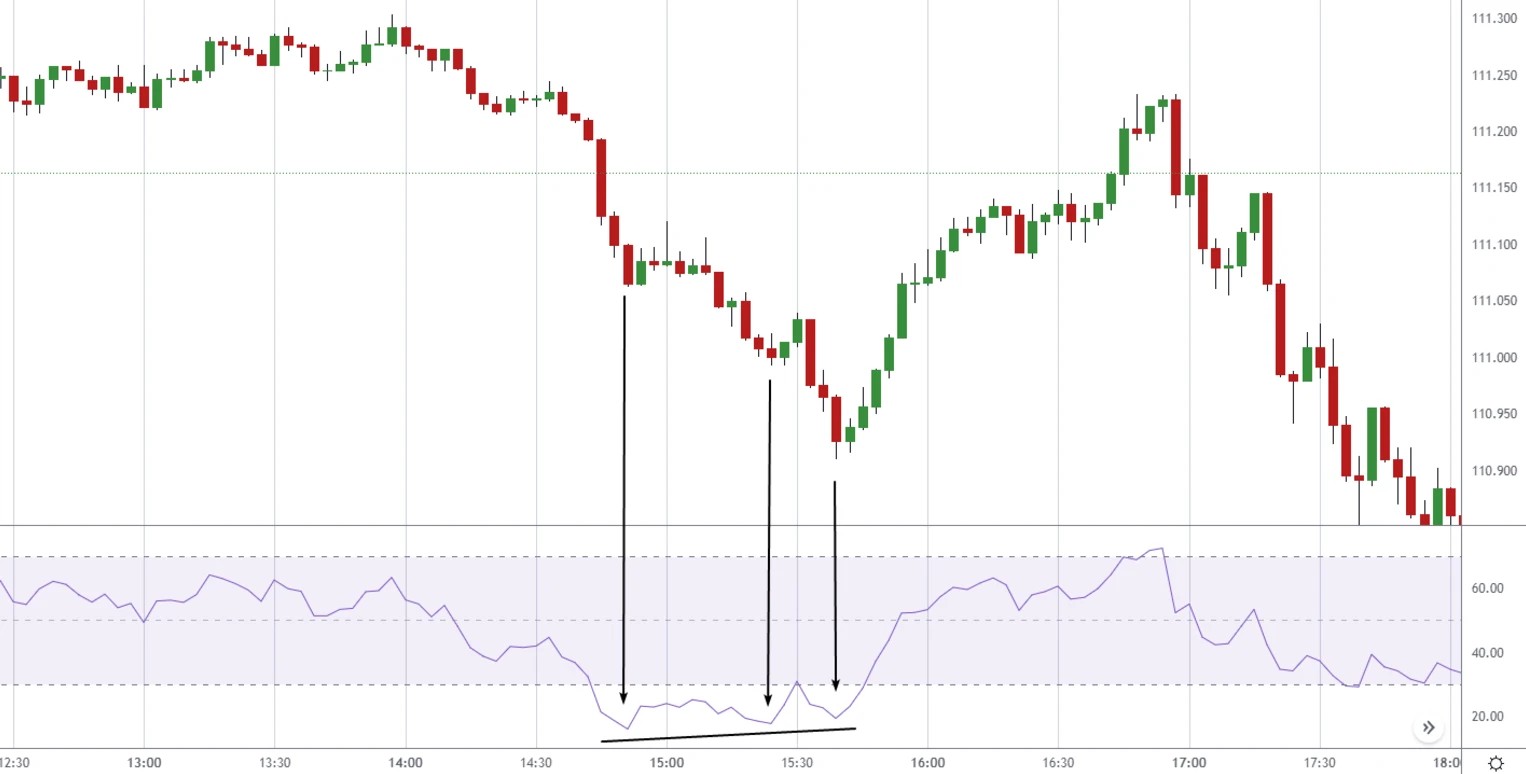
This is a classic sign of a potential reversal from oversold territory and can serve as a strong buy or sell signal depending on direction.
The divergence indicates that the downward impulse is possibly exhausted and the traders have reason to close the short and/or open the long position. Such divergence-based trading signals are especially reliable when confirmed by RSI crosses above key overbought and oversold levels, such as the 30 and 70 marks.
RSI helps traders assess whether the price is entering an overbought or oversold territory, aiding in predicting future price movements. The RSI also acts as a momentum oscillator, reflecting the speed and change of price movements, a feature that makes it a popular momentum oscillator in both short-term and long-term setups.
To boost accuracy, traders can refer to RSI trading rules that focus on overbought and oversold conditions, with levels adjusted according to volatility. Typically, oversold conditions are identified below 30, while 70 and above suggest overbought conditions. However, some traders shift these bands to 20 and 80 depending on the asset and timeframe.
Using RSI along with moving averages and chart patterns not only improves confirm RSI signals but also sharpens entries and exits. This is especially valuable when RSI crosses a signal line or reverses after hitting extreme overbought or oversold levels.
RSI chart analysis
Using RSI patterns for technical analysis
The Relative Strength Index (RSI) is not just a momentum gauge. When examined carefully, the RSI indicator can also provide pattern-based signals that are crucial in technical analysis. Many traders overlook the fact that RSI itself can form recognizable chart patterns such as triangles, trendlines, and even head-and-shoulders, just like you would expect on a price chart.
Tracking the RSI line allows traders to anticipate price movements by observing these formations within the indicator window. This kind of approach has been increasingly adopted in modern technical trading systems, especially among traders who specialize in short- to medium term price movements. The patterns often serve as early warning signals, offering a preview of potential breakout directions even before the price action confirms them.
RSI as a leading momentum indicator
The Relative Strength Index, developed by J. Welles Wilder, is one of the most popular technical indicators used in trading today. Typically displayed in a separate window below the price chart, the RSI oscillates between 0 and 100, with readings above 70 generally considered overbought and readings below 30 seen as oversold.
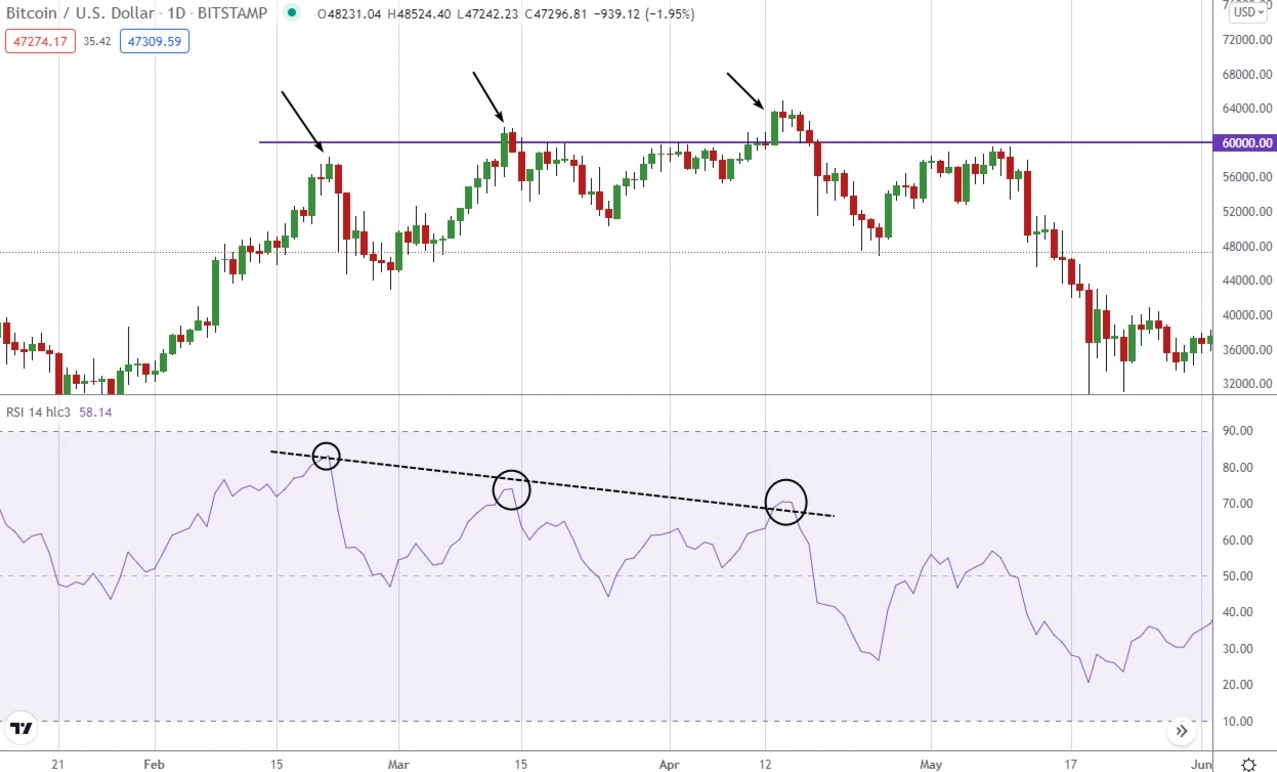
However, beyond these classic thresholds, the RSI is especially useful in identifying divergence setups and early trend reversals. For example, a breakout in the RSI trendline can indicate a shift in momentum before it becomes apparent in the actual market price. In such cases, the RSI reading functions as a forward-looking signal, offering a strategic edge.
Price and RSI chart correlation
It is not only acceptable, but also insightful, to track patterns directly within the RSI chart itself. These visual cues often reflect changes in momentum, and in many cases, precede moves in the actual price chart. Traders often combine these RSI patterns with support/resistance levels or moving averages for stronger confirmation.
An effective method for short-term setups is overlaying RSI trendlines alongside key moving averages on the price chart, using both together to spot entry points or continuation patterns. Meanwhile, for medium term price movements, analyzing broader RSI structures — such as double bottoms, wedges, or breakouts — can provide a more stable basis for trade execution.
Practical example from GBP/USD intraday chart
Take the example of the intraday GBP/USD chart below. The image shows a breakout of the trend line built on the RSI indicator. The Relative Strength Index RSI established a local low ahead of the price action, suggesting a shift in momentum that traders could use for early positioning.
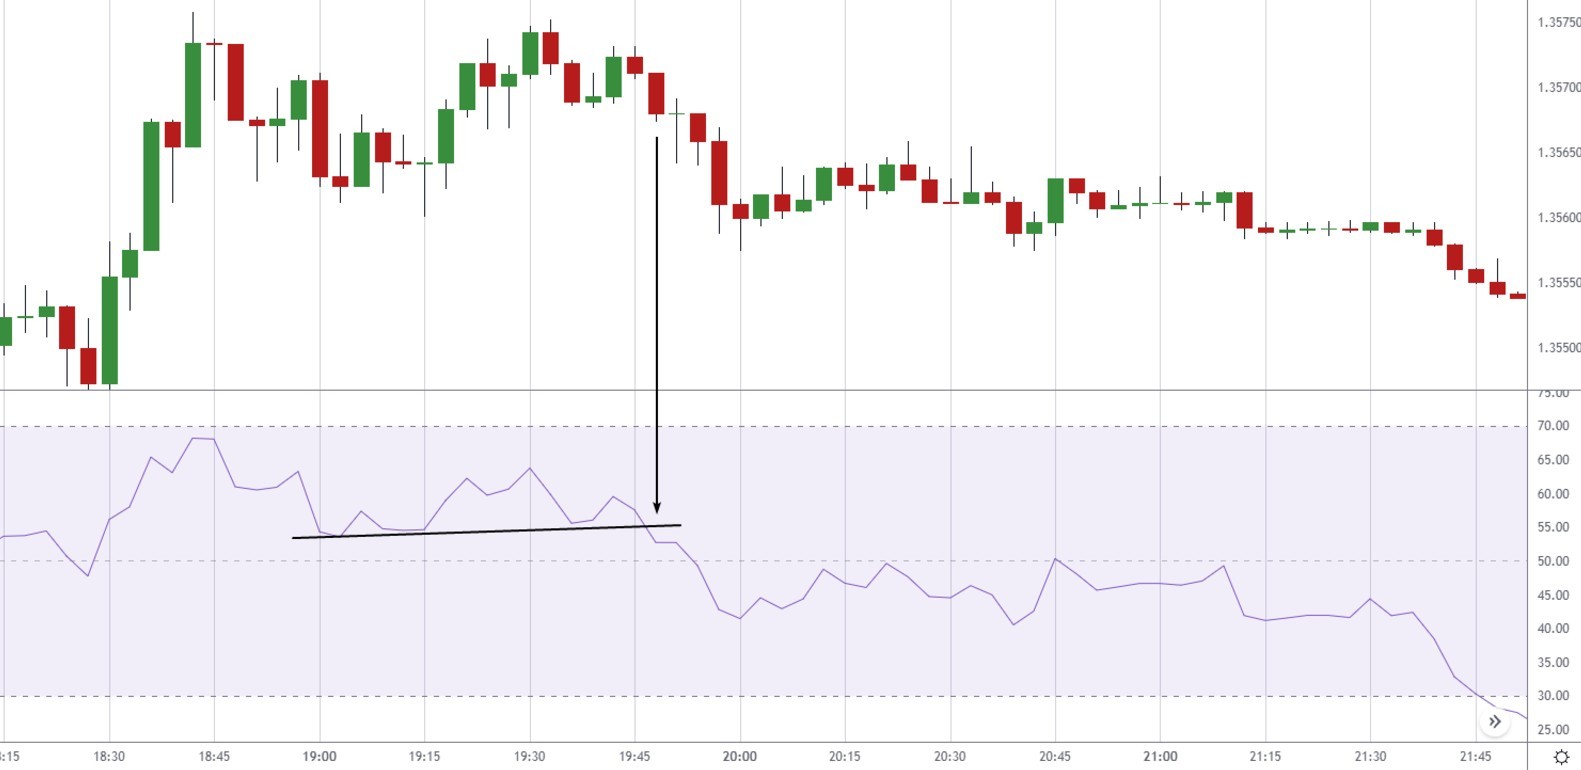
In this case, the RSI acted as a leading indicator, breaking its trendline before the price followed suit. Such early warnings are especially useful for scalpers and intraday traders who rely on precise timing. This is a textbook demonstration of how the RSI indicator, when interpreted correctly, can offer a valuable edge in dynamic market conditions.
The RSI indicator is much more than a simple overbought/oversold signal. When used as part of a broader technical analysis framework and integrated with technical trading systems, RSI becomes a powerful tool for anticipating price movements and navigating shifting market momentum. Whether you're focused on immediate breakouts or more gradual medium term price movements, the RSI provides flexible insights that can enhance your trading strategy.
By studying the RSI chart alongside the price chart, and paying close attention to evolving RSI readings, traders can unlock more nuanced signals and improve their overall edge in the market.
Frequent mistake made in trading based on RSI
One of the most common errors traders make when using the Relative Strength Index is misinterpreting what it means when the RSI enters the overbought or oversold territory. A frequent mistake occurs when traders decide to enter short positions simply because the RSI moves above 70, indicating an overbought condition, even though the market remains in a strong upward trend. Similarly, some traders rush into buy positions when the RSI drops below 30, interpreting it as oversold, while the broader market context still points to a persistent downtrend.
This kind of premature decision-making ignores the broader RSI behavior and violates key RSI trading rules. The RSI is not a standalone trigger; it's a momentum indicator, and its position in the overbought or oversold zone doesn’t automatically mean a reversal is imminent. Relying solely on RSI levels without assessing the broader context often leads to false signals that can cause substantial losses.
Frequent mistake
It’s risky to open a buy position in such setups, like the one illustrated above. The RSI tracks momentum, and a trend is made up of a succession of these momentum waves. You might get lucky and enter near a price bottom or top once or twice, but over time, trading against the momentum will likely lead you to losses. Entering trades at extremes without additional confirmation puts you in conflict with the prevailing trend and can be hazardous to your capital.
That’s why seasoned traders emphasize the importance of identifying overbought or oversold zones in relation to broader market structure. Just because the RSI is above 70 or below 30 doesn’t mean price will immediately reverse. It is far more prudent to wait for additional evidence, such as candlestick confirmation, volume divergence, or support and resistance signals before entering a position.
Therefore:
Don’t click on the SELL button just because the price looks high, while RSI > 70;
Don’t click on the BUY button just because the price looks low, while RSI < 30.
The smarter approach is to use other indicators to confirm RSI signals. Whether it’s Moving Averages, MACD, or volume-based tools, incorporating more data points strengthens your trade logic. Even simple chart patterns or price action support can offer meaningful validation when paired with RSI.
Ultimately, recognizing a valid RSI reversal setup takes patience, discipline, and context awareness. Blindly acting on RSI levels without checking market structure or aligning with supporting indicators often turns into chasing false signals. To become consistently profitable, a trader must go beyond the surface and follow time-tested RSI trading rules, always factoring in the surrounding trend and technical landscape.
Combine best RSI settings with candlestick patterns to confirm potential market reversals

If you're day trading with RSI, try tweaking the standard 14-period setting down to 7 or 9 periods. This change helps the RSI react faster to price changes, giving you quicker signals that are vital in day trading. But watch out, this increased sensitivity can also mean more false alarms, so it's wise to back up RSI signals by combining RSI with other indicators.
Another advanced technique involves combining RSI readings with candlestick patterns to confirm RSI signals and detect possible trend reversals. For instance, if the RSI indicates an overbought condition (above 70) and you observe a bearish candlestick pattern like a shooting star, it strengthens the case for a potential short position. This confluence approach enhances the reliability of your trades by aligning momentum indicators with price action signals. In addition, using tools like moving averages or Moving Average Convergence Divergence (MACD) — also known as average convergence divergence — alongside RSI can give a clearer view of whether the market is in a bullish trend or a bearish trend. This multi-layered setup increases the accuracy of your entries and exits and reduces your chances of reacting to short-term noise.
Conclusion
The RSI is a widely used indicator designed to highlight overbought and oversold market conditions. It calculates these levels by analyzing price dynamics over a specified number of past periods. Known for its versatility, the RSI can be applied across various markets, including Forex, cryptocurrency, and stocks. It works effectively on any timeframe, whether for intraday strategies or swing trading. Traders use the best RSI settings both for identifying trends and spotting potential reversals, making it suitable as a standalone tool or in conjunction with other indicators. Additionally, analyzing divergences is a particularly valuable technique for leveraging the RSI’s full potential.
FAQs
What should RSI be set at?
The default RSI setting is 14, but it can be adjusted based on your strategy and market conditions.
What is the best RSI setting for day trading?
For day trading, shorter periods like 5 or 9 offer frequent signals, while longer periods like 25 or 50 help filter noise. To optimize performance, traders often experiment with the best RSI settings to strike a balance between signal frequency and accuracy, ensuring that their strategy adapts to changing market conditions.
What are the most accurate RSI settings?
Accuracy depends on market conditions and individual strategies; there is no universally best setting.
Which RSI indicator is best?
The ideal RSI depends on your approach. Popular variations include Wilder's RSI, Stochastic RSI, and Adaptive RSI.
Related Articles
Team that worked on the article
Rinat Gismatullin is an entrepreneur and a business expert with 9 years of experience in trading. He focuses on long-term investing, but also uses intraday trading. He is a private consultant on investing in digital assets and personal finance. Rinat holds two degrees in Economy and Linguistics.
Chinmay Soni is a financial analyst with more than 5 years of experience in working with stocks, Forex, derivatives, and other assets. As a founder of a boutique research firm and an active researcher, he covers various industries and fields, providing insights backed by statistical data. He is also an educator in the field of finance and technology.
As an author for Traders Union, he contributes his deep analytical insights on various topics, taking into account various aspects.
Mirjan Hipolito is a journalist and news editor at Traders Union. She is an expert crypto writer with five years of experience in the financial markets. Her specialties are daily market news, price predictions, and Initial Coin Offerings (ICO).
An ECN, or Electronic Communication Network, is a technology that connects traders directly to market participants, facilitating transparent and direct access to financial markets.
Volatility refers to the degree of variation or fluctuation in the price or value of a financial asset, such as stocks, bonds, or cryptocurrencies, over a period of time. Higher volatility indicates that an asset's price is experiencing more significant and rapid price swings, while lower volatility suggests relatively stable and gradual price movements.
A long position in Forex, represents a positive outlook on the future value of a currency pair. When a trader assumes a long position, they are essentially placing a bet that the base currency in the pair will appreciate in value compared to the quote currency.
Xetra is a German Stock Exchange trading system that the Frankfurt Stock Exchange operates. Deutsche Börse is the parent company of the Frankfurt Stock Exchange.
Trade execution is knowing how to place and close trades at the right price. This is the key to turning your trading plans into real action and has a direct impact on your profits.


-
 Afghanistan
-
 Albania
-
 Algeria
-
 Argentina
-
 Armenia
-
 Australia
-
 Austria
-
 Azerbaijan
-
 Bahamas
-
 Bahrain
-
 Bangladesh
-
 Belgium
-
 Botswana
-
 Brazil
-
 Brunei
-
 Bulgaria
-
 Burma
Burma
-
 Cambodia
-
 Cameroon
-
 Canada
-
 Chile
Chile
-
 China
China
-
 Colombia
-
 Costa Rica
-
 Cote d'Ivoire
-
 Croatia
-
 Cyprus
-
 Czech Republic
-
 Denmark
-
 Dominican Republic
-
 Ecuador
-
 Egypt
Egypt
-
 Estonia
-
 Eswatini
-
 Ethiopia
-
 Finland
-
 France
-
 Georgia
-
 Germany
-
 Ghana
Ghana
-
 Greece
-
 Haiti
Haiti
-
 Hong Kong
-
 Hungary
-
 India
India
-
 Indonesia
-
 Iran, Islamic republic
-
 Iraq
Iraq
-
 Ireland
-
 Israel
-
 Italy
Italy
-
 Jamaica
-
 Japan
Japan
-
 Jordan
-
 Kazakhstan
-
 Kenya
Kenya
-
 Korea
Korea
-
 Kuwait
-
 Kyrgyzstan
-
 Laos
Laos
-
 Latvia
-
 Lebanon
-
 Libyan Arab Jamahiriya
-
 Lithuania
-
 Luxembourg
-
 Macedonia
-
 Madagascar
-
 Malaysia
-
 Malta
Malta
-
 Mauritius
-
 Mexico
-
 Moldova
-
 Mongolia
-
 Montenegro
-
 Morocco
-
 Mozambique
-
 Namibia
-
 Nepal
Nepal
-
 Netherlands
-
 Nigeria
-
 Norway
-
 Oman
Oman
-
 Pakistan
-
 Palestine
-
 Papua New Guinea
-
 Peru
Peru
-
 Philippines
-
 Poland
-
 Portugal
-
 Puerto Rico
-
 Qatar
Qatar
-
 Romania
-
 Rwanda
-
 Saudi Arabia
-
 Serbia
-
 Singapore
-
 Slovakia
-
 Slovenia
-
 Somalia
-
 South Africa
-
 Spain
Spain
-
 Sri Lanka
-
 Sweden
-
 Switzerland
-
 Syrian Arab Republic
-
 Taiwan
-
 Tajikistan
-
 Tanzania, United Republic Of
-
 Thailand
-
 Trinidad and Tobago
-
 Tunisia
-
 Turkey
-
 UAE
UAE
-
 Uganda
-
 Ukraine
-
 United Kingdom
-
United States
-
 Uzbekistan
-
 Venezuela
-
 Vietnam
-
 Yemen
Yemen
-
 Zambia
-
 Zimbabwe
- Forex
- Crypto
