How Do You Trade Using the Squeeze Momentum indicator?


Editorial Note: While we adhere to strict Editorial Integrity, this post may contain references to products from our partners. Here's an explanation for How We Make Money. None of the data and information on this webpage constitutes investment advice according to our Disclaimer.

The Squeeze Momentum Indicator is designed to measure the volatility in the market to identify potential breakout points. It is based on the interaction of Bollinger Bands and Keltner Channels.
- Effective in markets transitioning from consolidation to significant price movements.
- Entry signaled by Bollinger Bands expanding outside Keltner Channels.
- Exit strategies include momentum decrease and predefined stop-losses.
- Best used with additional market analysis for confirmation.
- Pros include clear volatility signals and anticipation of major market moves.
- Cons involve potential false signals and the risk of late entries.
In trading, capturing momentum can mean the difference between profit and loss. Momentum indicators are vital tools for traders aiming to leverage market movements effectively. However, one common hurdle is distinguishing false signals from those forecasting significant price movements.
This article will explore the Squeeze Momentum Indicator, a sophisticated tool that helps pinpoint potential breakout points with higher accuracy, enhancing your trading strategy.
Understanding the Squeeze Momentum Indicator
The Squeeze Momentum Indicator cleverly combines Bollinger Bands and Keltner Channels to forecast potential market breakouts by identifying periods of low volatility.
Bollinger Bands: These bands adjust based on standard deviation and market volatility, tightening during less volatile periods, indicative of the “squeeze” setup.
Keltner Channels: These channels use an exponential moving average flanked by boundaries based on the average true range, widening with increased volatility.
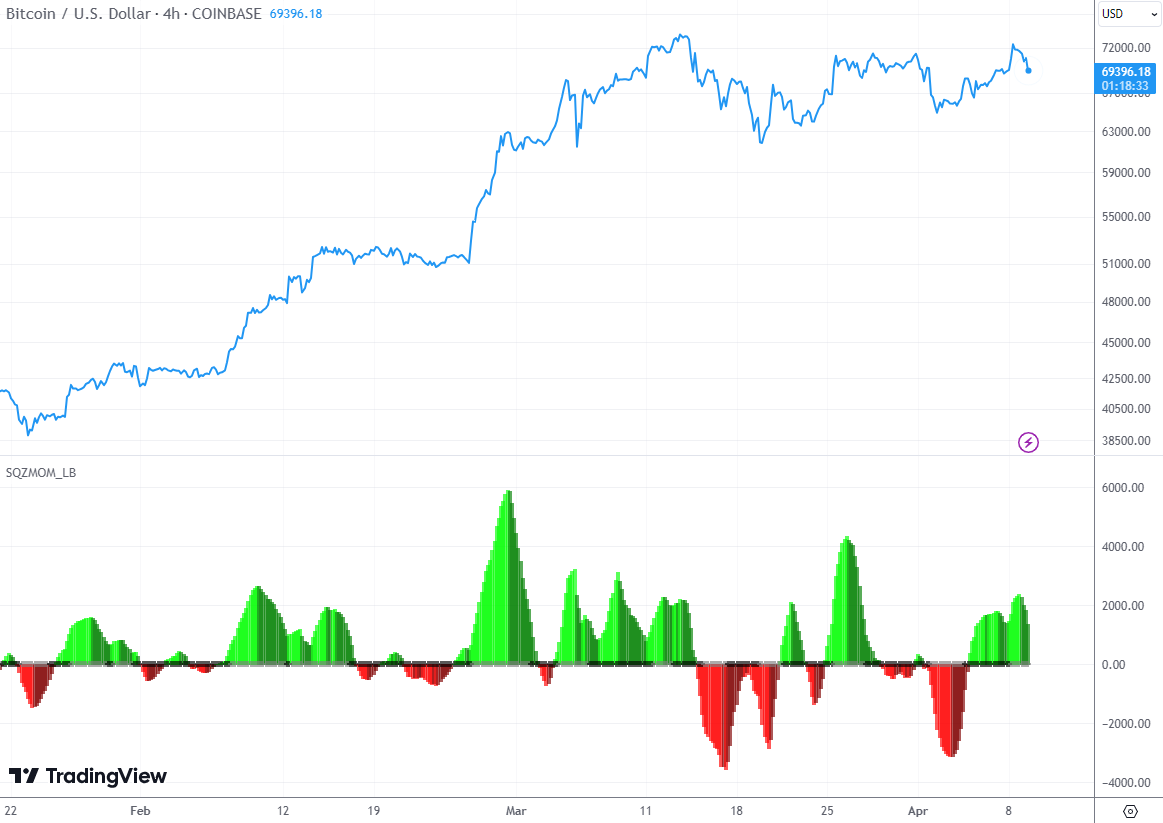
When the Squeeze Momentum indicator is added to Tradingview, a red-green histogram with black-gray crosses along the zero axis will appear on the chart below the price area.
Although Squeeze Momentum in Tradingview is provided free of charge (which makes it the best indicator among custom indicators on the platform), MetaTrader users will likely have to pay money.
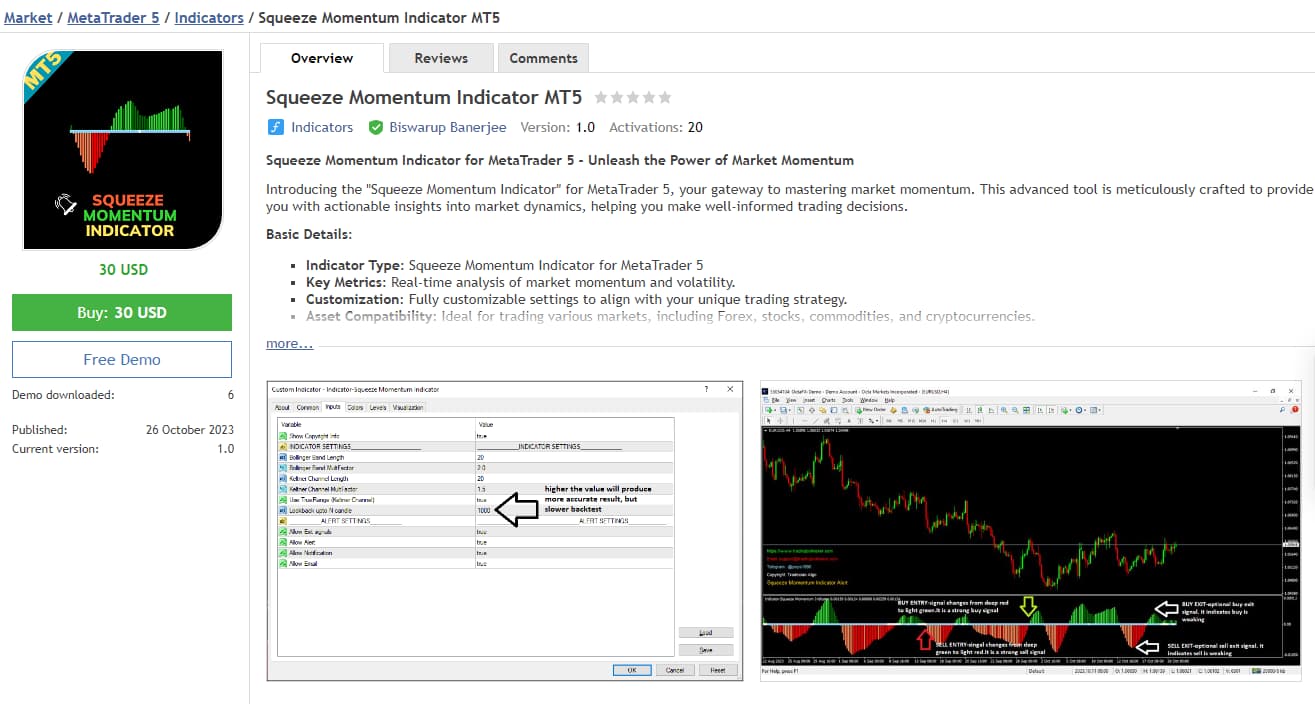 Squeeze Momentum for MetaTrader
Traders can download Squeeze Momentum for MetaTrader from the MQL5 marketplace.
How Do You Read Squeeze Momentum?
Reading the Squeeze Momentum Indicator involves understanding the interaction between Bollinger Bands and Keltner Channels to interpret market movements. Here’s how to decipher the phases and signals:
The Squeeze Phase – Black Dots
When Bollinger Bands contract and fit within the Keltner Channels, it indicates a squeeze or low volatility phase. This contraction suggests that the market is consolidating, and typically, this period of low volatility is a precursor to a significant price movement. At this phase, the Squeeze Momentum indicator displays black dots near the zero axis.
The Release Phase – Gray Dots
The release phase begins once the Bollinger Bands expand and move outside the Keltner Channels, signaling an increase in volatility and thus a potential breakout. This expansion can lead to potent price movements, providing profitable trading opportunities.
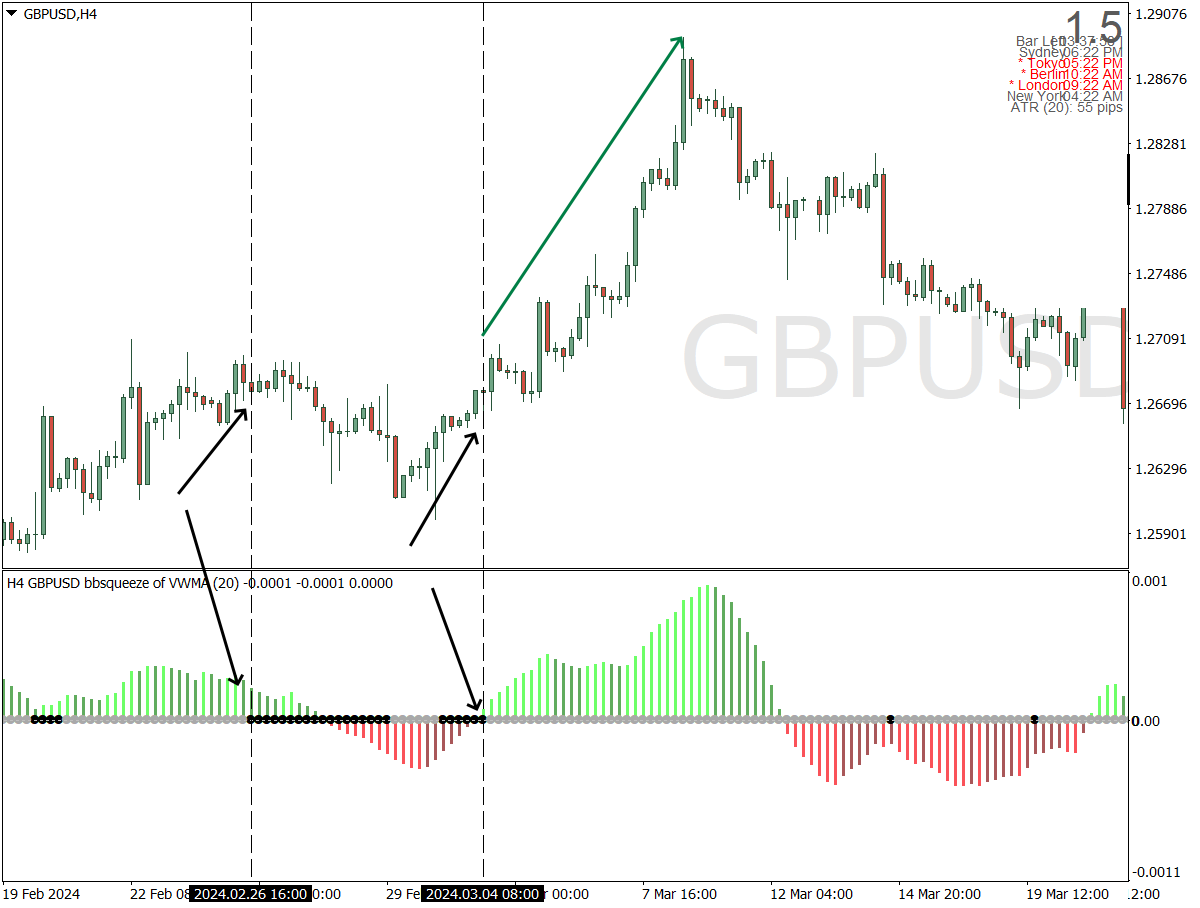
When the market comes out of compression, the indicator prints gray dots along the zero axis. The direction of the breakout, whether upward or downward, is often indicated by the initial movement of the prices as they leave the squeeze phase.
By recognizing these 2 phases, traders can enhance their ability to make informed decisions, entering trades during the build-up and capitalizing on the subsequent price surge. This method not only increases the likelihood of executing successful trades but also helps in managing risk more effectively by identifying clearer entry and exit points.
Understanding the Squeeze Momentum Indicator is only part of the equation. To apply its signals effectively, traders need a trading environment that supports fast execution, stable platforms, and access to the necessary indicators. Not all brokers offer the same conditions for momentum-based strategies, especially during volatile breakout phases.
Below is a comparison of Forex brokers that provide suitable trading platforms, competitive spreads, and reliable execution – key factors when trading with the Squeeze Momentum Indicator.
| zForex | Plus500 | OANDA | Trading.com USA | FOREX.com | |
|---|---|---|---|---|---|
|
Min. deposit, $ |
10 | 100 | No | 50 | 100 |
|
Tradable assets |
80 | 2800 | 129 | 69 | 5500 |
|
Standard EUR/USD spread |
0.3 | 0.7 | 0.3 | 1.1 | 1.0 |
|
Max. leverage |
1:1000 | 1:300 | 1:200 | 1:50 | 1:50 |
|
Max. Regulation Level |
Not regulated | Tier-1 | Tier-1 | Tier-1 | Tier-1 |
|
TU overall score |
8.05 | 7.57 | 6.89 | 6.15 | 6.87 |
|
Open an account |
Go to broker Your capital is at risk.
|
Go to broker 80% of retail CFD accounts lose money. |
Go to broker Your capital is at risk. |
Go to broker Your capital is at risk. |
Study review |
How to Use Squeeze Momentum Indicator for Trading
Utilizing the Squeeze Momentum Indicator effectively requires recognizing two primary conditions:
The Squeeze Condition (Consolidation). During this phase, traders should prepare for a potential significant price movement, as this “squeeze” indicates that the market is building energy for the next big move. This is the ideal time to monitor the market closely, rather than take immediate action.
The Release Condition (Trending). This movement indicates that a breakout has occurred, suggesting an increase in market volatility and the beginning of a new directional trend. Traders should consider this an opportune moment to enter a trade in the direction of the breakout. This condition is crucial as it marks the release of the energy built up during the Squeeze Condition and often leads to significant price moves.
Trading Rules for the Squeeze Momentum Indicator
When using the Squeeze Momentum Indicator to identify potential entry and exit points, traders typically look for specific patterns in the indicator's histogram bars and the presence of dots, either black or gray, which indicate whether the market is in a squeeze or has released from one.
Potential Entry Points: Traders often consider entering a trade when the Squeeze is released, which is signaled by the switch from black to gray crosses (dots). The idea is to enter just as the market is starting to move out of a consolidation phase, potentially capturing the momentum as it starts. This might be just after the last black dot, when you start seeing gray dots, and the histogram bars are turning from red to green, indicating a potential upward price movement.
Potential Exit Points: As for exit points, traders look for signs that the momentum is fading or when the histogram starts to decline after a peak, indicating that the current movement is losing strength. Also, the transition back to black dots can signal that the market is returning to a squeeze phase, suggesting it might be a good time to exit and take profits before the market enters another period of consolidation.
Let’s take a look at the following chart:
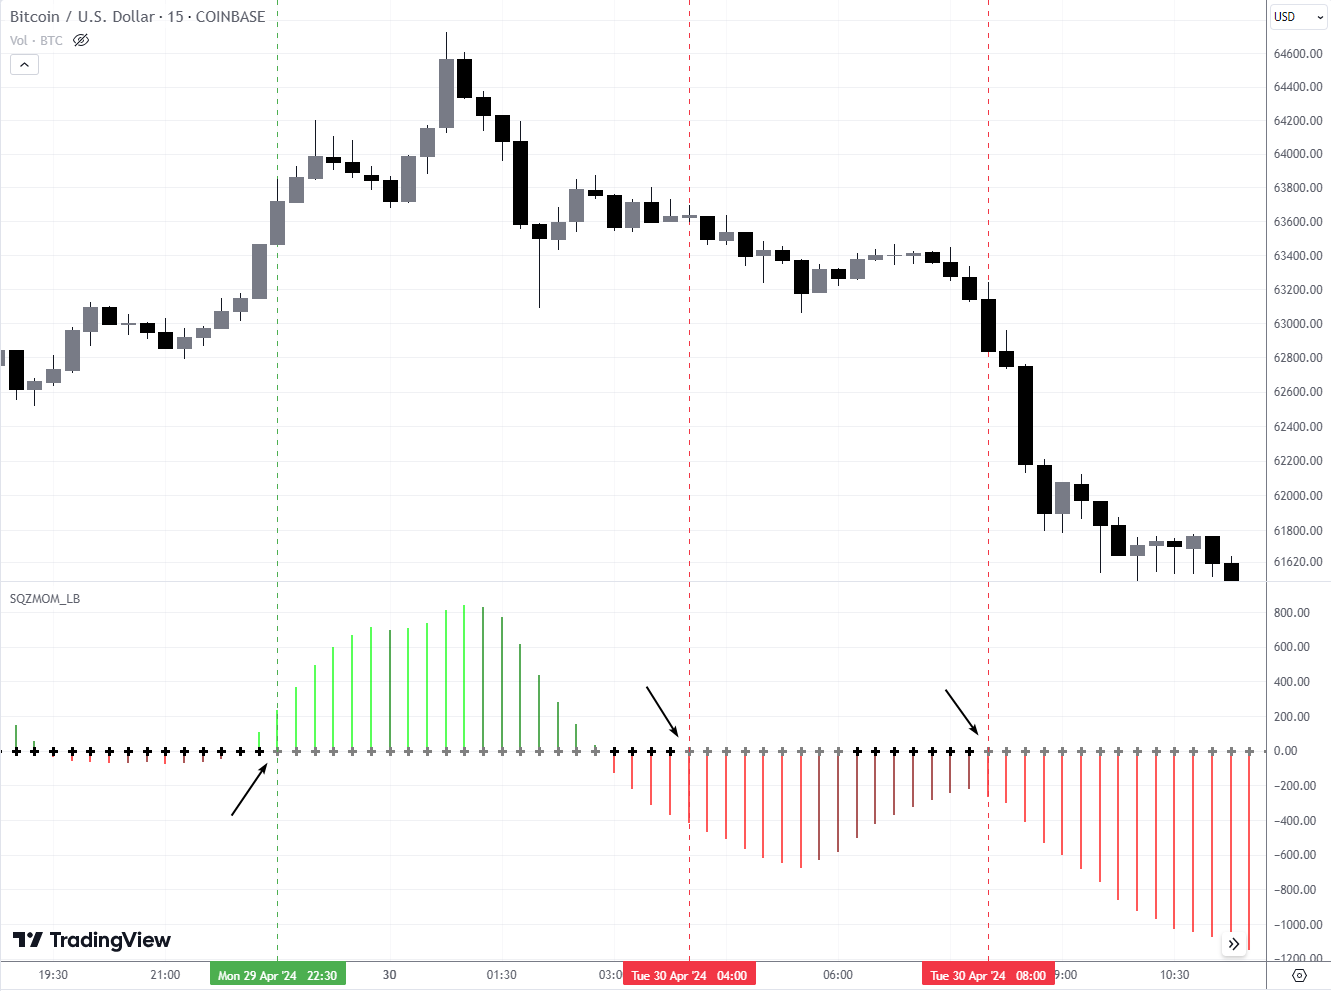
There are 3 entry signals on this chart: the first signal is a buy signal, and then two are sell signals.
The buy signal comes when the dot turns gray (as shown by the arrow). At the close of the candle, the trader has a reason to enter long. His goal is to hold the long position until the bullish momentum runs out. The reason to close the long may be:
A change from light green bars to dark green bars;
When the price reaches an important resistance level;
Bearish divergence signals;
Triggering of a trailing stop;
Take Profit triggering, which can be quite close if the analysis of the higher timeframe shows that the market is not volatile, but is in the flat stage.
For sell trades - the logic can be the same, but in reverse display. The chart shows that the third trade allowed to catch a significant trend (on intraday scale).
Is the Squeeze Momentum Indicator Accurate?
The accuracy of the Squeeze Momentum Indicator is not absolute. It varies with market conditions and the specific asset in question. Its proficiency shines in situations where markets transition from periods of consolidation to significant price movements. For assets that typically exhibit this behavior, the indicator can be a powerful tool for anticipating breakouts.
In trending markets - either uptrend or downtrend - the indicator helps in pinpointing continuation patterns when a temporary period of consolidation gives way to a resumption of the trend. In flat markets, the Squeeze Momentum Indicator may signal the start of a new trend after a period of directionless movement.
However, its use is not limited to a single market state. It’s crucial for traders to combine it with other analysis tools to confirm signals, especially in volatile or unpredictable markets, to enhance its effectiveness and accuracy in trade decision-making.
Benefits of Using Squeeze Momentum Indicator
Clear Signals for Volatility Shifts: It provides explicit visual cues for shifts from low to high volatility, which can precede market breakouts.
Dual-Indicator System: Combining Bollinger Bands and Keltner Channels offers a multifaceted view of market momentum and volatility.
Anticipation of Major Moves: The indicator excels in predicting significant price movements following consolidation phases.
Why Not to Trade Using Squeeze Momentum Indicator
False Signals: During highly volatile or sideways markets, the indicator can produce false signals leading to potential losses.
Lagging Nature: Being a lagging indicator, it might result in late entries, causing traders to miss optimal trade points.
Over-Reliance Risk: Sole reliance on this indicator without confirmation from additional analysis can lead to misinformed trading decisions.
If you are interested in speculating based on impulsive price movements, you may find this article useful: Momentum trading Definition and Best Strategies.
Risk management should be built around volatility, not fixed assumptions

The Squeeze Momentum Indicator works best when it is treated as a context filter, not a standalone trigger. I use it to identify moments when the market is preparing for expansion, but I never enter a trade based on the squeeze alone. The most consistent results come when the release aligns with a clear directional bias on a higher timeframe and a nearby technical level that can define risk.
I also recommend being selective about when not to trade. If the squeeze forms inside a choppy range or during low-liquidity sessions, I often stand aside, even if the indicator releases. In real trading, patience during compression phases is just as important as reacting to the breakout itself. Waiting for the first pullback after the release often provides better entries than chasing the initial move.
Finally, risk management should be built around volatility, not fixed assumptions. When using the Squeeze Momentum Indicator, I adjust position size and stops based on recent average range, because breakouts can fail quickly. Used with discipline and confirmation, the indicator becomes a powerful timing tool – but only when it supports a broader trading plan rather than replacing it.
Conclusion
The Squeeze Momentum Indicator stands out as a powerful tool for traders aiming to pinpoint prime moments to enter or exit the market. By clearly signaling periods of volatility contraction and expansion, it empowers users to anticipate breakout opportunities and avoid premature trades. For example, when the indicator reveals a squeeze release, traders can ride the ensuing trend with greater confidence, while during low-momentum phases, they can wisely step back and manage risk. Ultimately, mastering this indicator doesn't just improve decision-making—it offers a competitive edge, reminding us that in trading, timing is everything.
FAQs
What additional analysis methods can strengthen signals from the Squeeze Momentum Indicator?
How should position sizing be adjusted when trading with the Squeeze Momentum Indicator?
Are there certain trading sessions or conditions where the Squeeze Momentum Indicator is less effective?
What are best practices for entering and exiting trades using the Squeeze Momentum Indicator?
Editors' Top Picks and Insights

Crypto test drive: How automakers are exploring digital assets

Lindsey Graham death: U.S. senator’s crypto legacy

Tether under pressure: USDT in Europe, audit questions, and the fight for trust

Lean Ethereum: Why Buterin wants to rebuild the network

SK Hynix debuts on Nasdaq: Largest U.S. offering by foreign company

SpaceX falls out of orbit: Does anyone still want Musk’s stock?
Related Articles
Team that worked on the article
Vuk stands at the forefront of financial journalism, blending over six years of crypto investing experience with profound insights gained from navigating two bull/bear cycles. A dedicated content writer, Vuk has contributed to a myriad of publications and projects.
Dan Blystone began his trading career in 1998 as an arbitrage clerk on the floor of the Chicago Mercantile Exchange (CME). He later traded bond and Eurex futures at proprietary firms such as Altea Trading, gaining valuable experience in high-frequency trading and risk management.
Chinmay Soni is a financial analyst with more than 5 years of experience in working with stocks, Forex, derivatives, and other assets. As a founder of a boutique research firm and an active researcher, he covers various industries and fields, providing insights backed by statistical data.
A Trailing Stop Order is a type of order that automatically adjusts the stop-loss level as the market price moves in a favorable direction, helping to protect profits.
A long position in Forex, represents a positive outlook on the future value of a currency pair. When a trader assumes a long position, they are essentially placing a bet that the base currency in the pair will appreciate in value compared to the quote currency.
Ethereum is a decentralized blockchain platform and cryptocurrency that was proposed by Vitalik Buterin in late 2013 and development began in early 2014. It was designed as a versatile platform for creating decentralized applications (DApps) and smart contracts.
Forex leverage is a tool enabling traders to control larger positions with a relatively small amount of capital, amplifying potential profits and losses based on the chosen leverage ratio.
Index in trading is the measure of the performance of a group of stocks, which can include the assets and securities in it.

-
 Afghanistan
-
 Albania
-
 Algeria
-
 Angola
-
 Argentina
-
 Armenia
-
 Australia
-
 Austria
-
 Azerbaijan
-
 Bahamas
-
 Bahrain
-
 Bangladesh
-
 Belarus
-
 Belgium
-
 Bolivia
-
 Botswana
-
 Brazil
-
 Brunei
-
 Bulgaria
-
 Cambodia
-
 Cameroon
-
 Canada
-
 Chile
Chile
-
 China
China
-
 Colombia
-
 Congo
Congo
-
 Costa Rica
-
 Cote d'Ivoire
-
 Croatia
-
 Cuba
Cuba
-
 Cyprus
-
 Czechia
-
 DR Congo
-
 Denmark
-
 Dominican Republic
-
 Ecuador
-
 Egypt
Egypt
-
 El Salvador
-
 Estonia
-
 Eswatini
-
 Ethiopia
-
 Finland
-
 France
-
 Georgia
-
 Germany
-
 Ghana
Ghana
-
 Greece
-
 Haiti
Haiti
-
 Hong Kong
-
 Hungary
-
 India
India
-
 Indonesia
-
 Iran, Islamic republic
-
 Iraq
Iraq
-
 Ireland
-
 Israel
-
 Italy
Italy
-
 Jamaica
-
 Japan
Japan
-
 Jordan
-
 Kazakhstan
-
 Kenya
Kenya
-
 Korea
Korea
-
 Kuwait
-
 Kyrgyzstan
-
 Laos
Laos
-
 Latvia
-
 Lebanon
-
 Lesotho
-
 Libya
Libya
-
 Lithuania
-
 Luxembourg
-
 Madagascar
-
 Malaysia
-
 Malta
Malta
-
 Mauritius
-
 Mexico
-
 Moldova
-
 Mongolia
-
 Montenegro
-
 Morocco
-
 Mozambique
-
 Myanmar
-
 Namibia
-
 Nepal
Nepal
-
 Netherlands
-
 New Zealand
-
 Nigeria
-
 North Macedonia
-
 Norway
-
 Oman
Oman
-
 Pakistan
-
 Palestine
-
 Panama
-
 Papua New Guinea
-
 Paraguay
-
 Peru
Peru
-
 Philippines
-
 Poland
-
 Portugal
-
 Puerto Rico
-
 Qatar
Qatar
-
 Reunion
-
 Romania
-
 Rwanda
-
 Saudi Arabia
-
 Serbia
-
 Singapore
-
 Slovakia
-
 Slovenia
-
 Somalia
-
 South Africa
-
 Spain
Spain
-
 Sri Lanka
-
 Sweden
-
 Switzerland
-
 Syria
Syria
-
 Taiwan
-
 Tajikistan
-
 Tanzania
-
 Thailand
-
 Trinidad and Tobago
-
 Tunisia
-
 Turkey
-
 UAE
UAE
-
 Uganda
-
 Ukraine
-
 United Kingdom
-
United States
-
 Uruguay
-
 Uzbekistan
-
 Venezuela
-
 Vietnam
-
 Yemen
Yemen
-
 Zambia
-
 Zimbabwe
- Forex
- Crypto
