Keltner Channels Explained: How To Use, Set Up, And Trade With This Powerful Volatility Indicator


Editorial Note: While we adhere to strict Editorial Integrity, this post may contain references to products from our partners. Here's an explanation for How We Make Money. None of the data and information on this webpage constitutes investment advice according to our Disclaimer.
Keltner Channels are a volatility-based technical indicator used in trading to identify trends, breakouts, and dynamic support and resistance levels. They consist of an exponential moving average (EMA) with upper and lower bands derived from the Average True Range (ATR). Traders use Keltner Channels to spot price breakouts, reversals, and trend strength. This indicator adapts to market conditions, making it a valuable tool for Forex, stocks, and crypto trading.
In this article, we’ll explore Keltner Channels, a powerful volatility-based trading indicator. You’ll learn how they work, how to set them up, and how traders use them to identify trends, breakouts, and dynamic support and resistance levels. We’ll also compare them to Bollinger Bands and discuss trading strategies to maximize their effectiveness in Forex, stocks, and crypto markets.
Introduction to Keltner channels
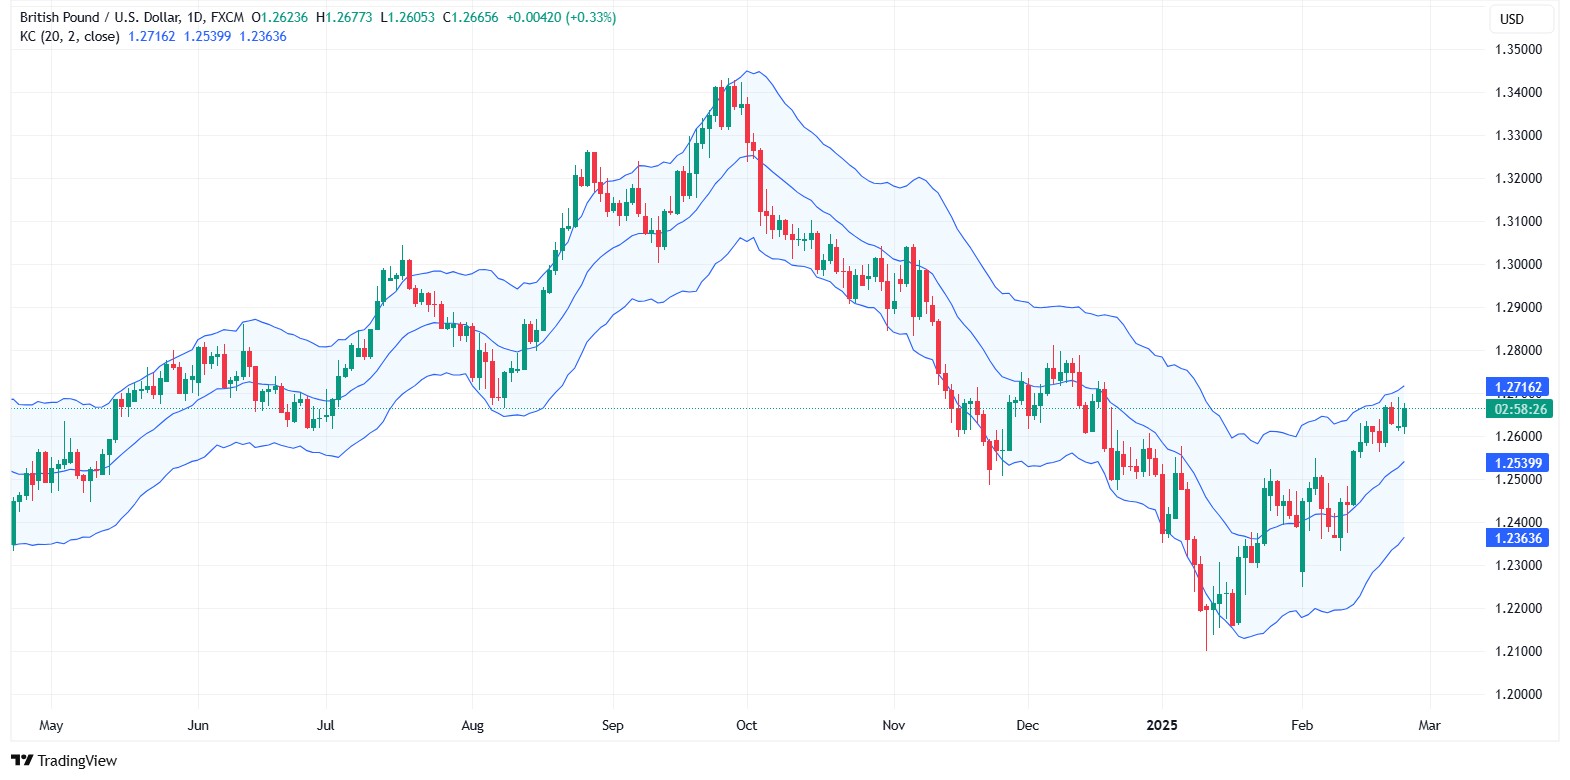
Keltner channels are a technical analysis tool used to assess market trends and volatility. They consist of three lines. A central moving average and two parallel bands above and below it. These channels help traders identify potential overbought or oversold conditions, as well as possible breakout opportunities.
Historical background
The concept of Keltner channels was introduced by American commodities trader Chester W. Keltner in his 1960 book How to Make Money in Commodities. Keltner's original methodology, known as the ten-day moving average trading rule, involved calculating a simple moving average (SMA) of the typical price. The typical price was defined as the average of the high, low, and closing prices. The upper and lower bands were then plotted by adding and subtracting a moving average of the trading range, which is the difference between the high and low prices, from the SMA.

In the 1980s, technical analyst Linda Bradford Raschke refined Keltner's original formula to enhance its responsiveness to market volatility.
Exponential moving average (EMA). Replacing the SMA with an EMA for the central line to give more weight to recent price data. This made the indicator more sensitive to current market conditions.
Average true range (ATR). Utilizing the ATR to set the distance of the upper and lower bands from the central EMA. The ATR accounts for gaps and limit moves, providing a more comprehensive measure of volatility.
Understanding the components of Keltner channels

Keltner channels are a technical analysis tool that helps traders assess market trends and volatility. They consist of three components.
Middle line (exponential moving average - EMA). This line represents the average price over a specified period, smoothing out short-term fluctuations to highlight the underlying trend.
Upper band. Calculated by adding a multiple of the average true range (ATR) to the EMA, this band indicates potential overbought conditions.
Lower band. Determined by subtracting a multiple of the ATR from the EMA, this band signals possible oversold conditions.
The average true range measures market volatility by evaluating the range of price movements over a set period. By incorporating the ATR, Keltner channels adjust dynamically to changing market conditions, providing traders with a visual representation of price action relative to volatility.
How to set up Keltner channels
Setting up Keltner channels on your trading platform involves a few straightforward steps. Here’s how you can do it.
Access the indicator
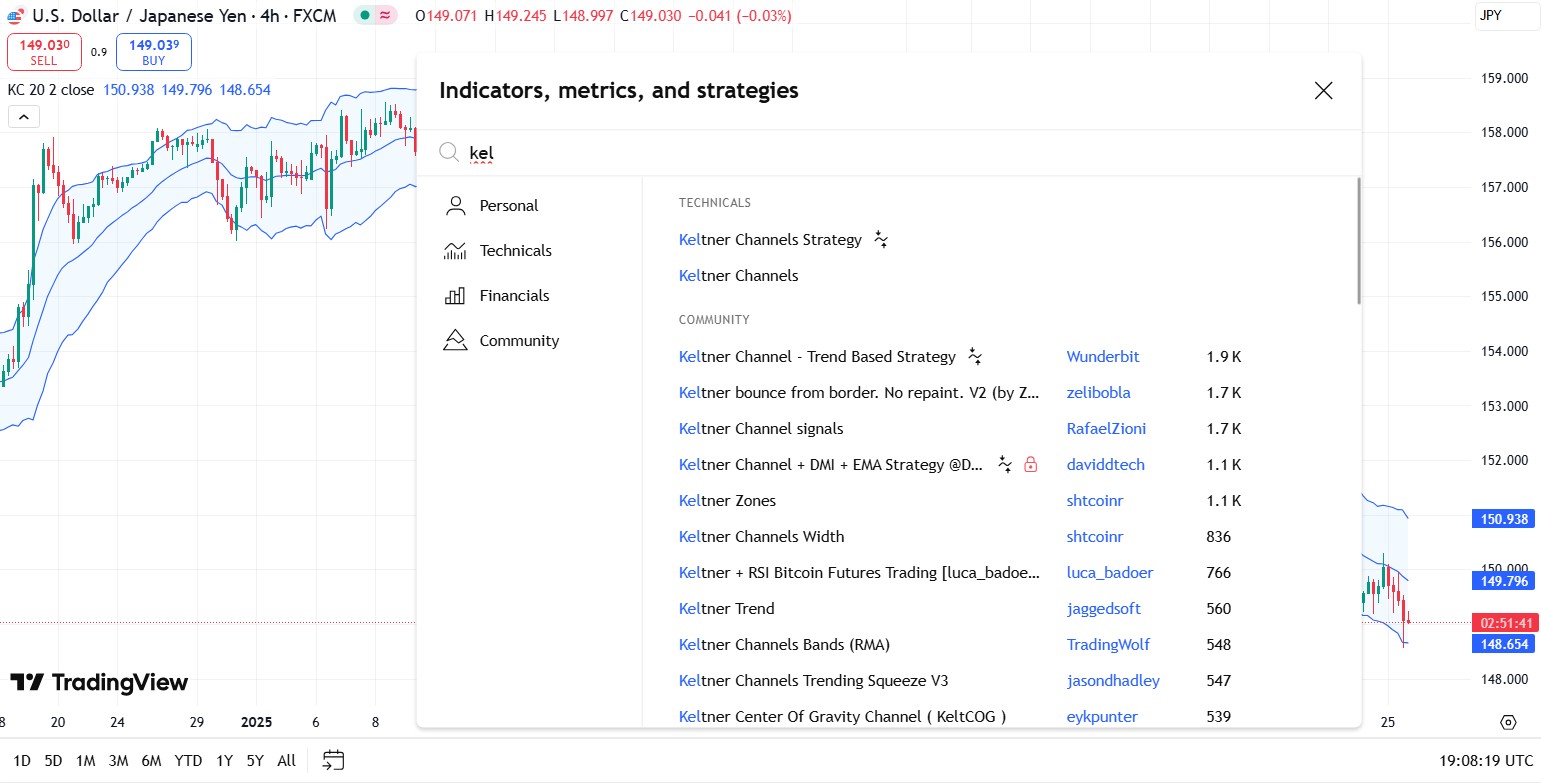
Open your trading platform and select the chart of the asset you’re analyzing.
Navigate to the indicators section, typically found in the toolbar or menu.
Search for "Keltner channels" in the list of available indicators.
Configure the parameters

Length (EMA period). Set the period for the exponential moving average (EMA), which serves as the middle line. A common default is 20 periods.
Multiplier (ATR multiplier). Determine the multiplier applied to the average true range (ATR) to establish the channel’s width. The default setting is often 2.
Source. Choose the price point used in calculations, such as the closing price. The default is typically "close."
Apply the indicator
After configuring the parameters, apply the Keltner channels to your chart.
The chart will display three lines.
Middle line. The EMA reflecting the average price over the specified period.
Upper band. Calculated by adding the ATR (multiplied by your chosen multiplier) to the EMA.
Lower band. Calculated by subtracting the ATR (multiplied by your chosen multiplier) from the EMA.
Keltner channels vs. Bollinger bands
Keltner channels and Bollinger bands are two popular volatility-based indicators used in technical analysis. While both help traders identify trends, breakouts, and overbought/oversold conditions, their calculation methods and applications differ. Understanding these differences can help traders choose the right tool for their strategies.
| Feature | Keltner channels | Bollinger bands |
|---|---|---|
| Calculation method | Uses an exponential moving average (EMA) with upper and lower bands based on the average true range (ATR). | Uses a simple moving average (SMA) with bands calculated using standard deviation of price. |
| Volatility measurement | Based on ATR, which accounts for true price movements, making it smoother. | Based on standard deviation, making it highly responsive to price volatility. |
| Best for | Identifying stable trends and dynamic support/resistance. | Detecting price breakouts and reversals in volatile markets. |
| Sensitivity to price changes | Less reactive, provides smoother signals. | Highly reactive, making it suitable for short-term trading. |
| Breakout confirmation | Confirms trend continuation rather than quick price reversals. | Quick reaction to breakouts, often used for mean reversion trading. |
| Use in trading strategies | Better for trend-following strategies. | More effective for range-bound and breakout strategies. |
Which one should traders use?
Use Keltner channels if:
You prefer a smoother, more stable indicator that adapts to price trends.
You trade trend-following strategies, where price moves consistently in one direction.
You want a less noisy indicator that avoids excessive false signals.
Use Bollinger bands if:
You trade high-volatility assets and need a more sensitive tool.
You look for overbought and oversold signals in range-bound markets.
You want to capitalize on breakout trading strategies, as Bollinger bands expand and contract based on volatility.
Combining both indicators
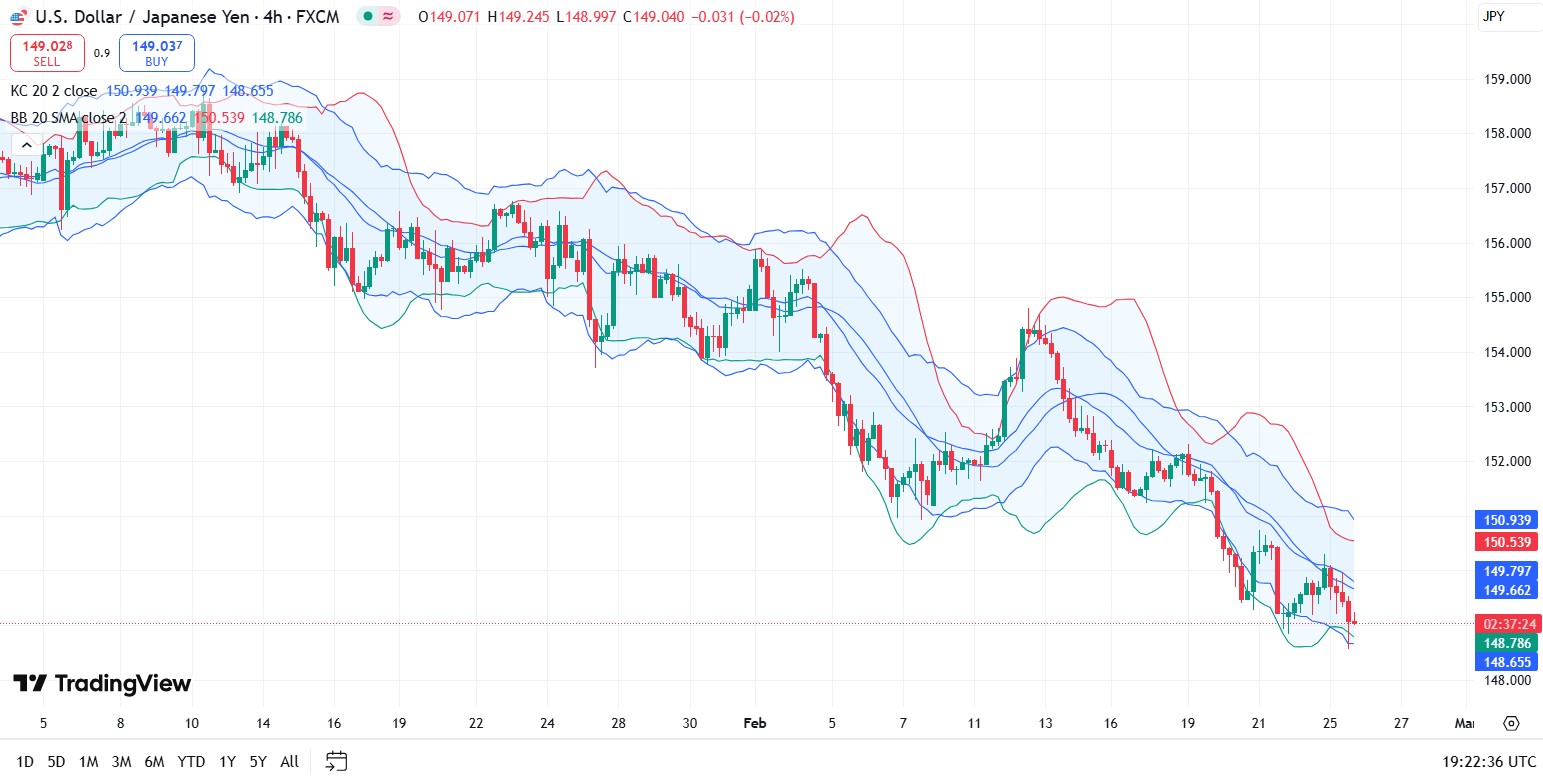
Some traders use both Keltner channels and Bollinger bands together. One popular strategy is the Bollinger band squeeze within Keltner channels, which happens when Bollinger bands contract inside Keltner channels. This suggests an upcoming breakout, helping traders prepare for significant price movements.
To apply Keltner Channels effectively, traders need a reliable trading platform that supports advanced charting tools and technical indicators. Most modern brokers provide built-in indicators, customizable chart settings, and fast order execution that allow traders to implement volatility-based strategies directly from their trading interface. The comparison below highlights several brokers that offer powerful charting platforms and support technical analysis tools such as Keltner Channels.
| zForex | Plus500 | OANDA | Trading.com USA | FOREX.com | |
|---|---|---|---|---|---|
|
Min. deposit, $ |
10 | 100 | No | 50 | 100 |
|
Tradable assets |
80 | 2800 | 129 | 69 | 5500 |
|
Standard EUR/USD spread |
0.3 | 0.7 | 0.3 | 1.1 | 1.0 |
|
Max. leverage |
1:1000 | 1:300 | 1:200 | 1:50 | 1:50 |
|
Max. Regulation Level |
Not regulated | Tier-1 | Tier-1 | Tier-1 | Tier-1 |
|
TU overall score |
8.05 | 7.57 | 6.89 | 6.15 | 6.87 |
|
Open an account |
Go to broker Your capital is at risk.
|
Go to broker 80% of retail CFD accounts lose money. |
Go to broker Your capital is at risk. |
Go to broker Your capital is at risk. |
Study review |
Trading strategies using Keltner channels
1. Breakout strategy

The breakout strategy leverages Keltner channels to signal potential shifts in market momentum.
Setup. Apply the Keltner channel to your trading chart with standard settings, typically a 20-period EMA and a multiplier of 2 for the ATR.
Signal identification.
Bullish breakout. When the price closes above the upper band, it suggests strong upward momentum, indicating a potential buying opportunity.
Bearish breakout. A close below the lower band signals strong downward momentum, suggesting a potential selling opportunity.
Confirmation. To reduce false signals, combine the breakout with additional indicators such as the relative strength index (RSI) or moving average convergence divergence (MACD).
Execution. Enter the trade in the direction of the breakout, setting stop-loss orders just inside the channel to manage risk.
This strategy capitalizes on significant price movements and is particularly effective in volatile markets. However, traders should be cautious of false breakouts and consider using additional confirmation tools.
2. Trend pullback strategy

The trend pullback strategy focuses on entering trades in the direction of the prevailing trend during temporary price retracements.
Setup. Apply the Keltner channel to your chart.
Trend identification. Determine the overall trend direction by observing the slope of the middle line (EMA). An upward slope indicates an uptrend, while a downward slope indicates a downtrend.
Pullback recognition.
Uptrend. Wait for the price to pull back towards or just below the middle line.
Downtrend. Wait for the price to rise towards or just above the middle line.
Entry point. Enter the trade in the direction of the main trend when the price resumes movement in that direction after the pullback.
Stop-loss and take-profit.
Stop-loss. Place just beyond the opposite band of the channel.
Take-profit. Set at a multiple of the risked amount or near significant support or resistance levels.
3. Mean reversion strategy
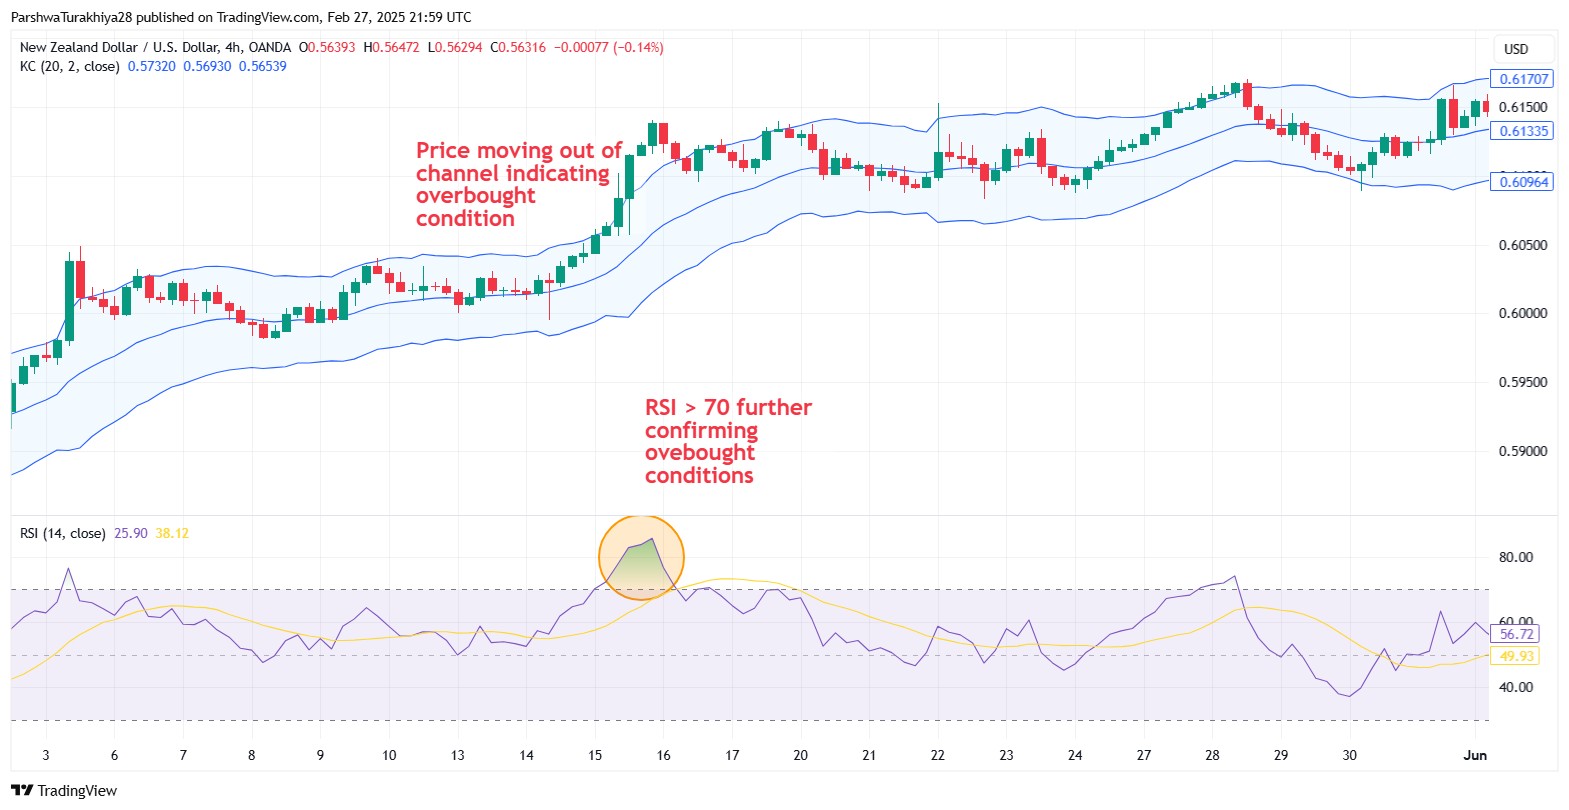
The mean reversion strategy is based on the idea that prices will revert to their mean or average over time.
Setup. Apply the Keltner channel to your chart.
Signal identification.
Overbought condition. When the price touches or exceeds the upper band, it may indicate an overbought market.
Oversold condition. When the price touches or falls below the lower band, it may indicate an oversold market.
Entry point.
Sell signal. In overbought conditions, consider entering a short position.
Buy signal. In oversold conditions, consider entering a long position.
Confirmation. Use additional indicators like RSI or stochastic oscillators to confirm overbought or oversold conditions.
Execution. Enter the trade anticipating a reversal toward the middle line of the channel.
4. Volatility expansion strategy

This strategy takes advantage of periods when Keltner channel bands widen, indicating increased market volatility and potential trading opportunities.
Setup. Apply the Keltner channel to your chart.
Signal identification.
Band expansion. Noticeable widening of the channel bands suggests a volatility increase.
Price action. Observe the price movement in relation to the expanding bands to identify potential breakout directions.
Entry point.
Bullish signal. Enter a long position if the price breaks above the upper band during expansion.
Bearish signal. Enter a short position if the price breaks below the lower band during expansion.
Stop-loss and take-profit.
Stop-loss. Place just inside the channel to manage risk.
Take-profit. Set based on the expected volatility and distance to the next support or resistance level.
5. Combining Keltner channels with other indicators
Enhancing the reliability of Keltner channel signals can be achieved by combining them with other technical indicators.
Relative strength index (RSI).
Overbought or oversold confirmation. Use RSI to confirm potential reversal signals indicated by Keltner channels.
Moving averages.
Trend confirmation. Incorporate longer-term moving averages to confirm the direction of the prevailing trend.
MACD.
Momentum assessment. Use the MACD to gauge the strength of the trend and identify potential entry points.
Advantages and limitations of Keltner Channels

Keltner channels are a widely used technical analysis tool that helps traders evaluate market volatility and identify potential trading opportunities. While they offer several benefits, it is essential to understand their limitations to use them effectively.
- Pros
- Cons
Ease of use. Keltner Channels are simple to understand and apply, making them accessible to both novice and experienced traders.
Trend identification. The indicator helps traders determine the direction of the prevailing trend and spot potential reversals.
Dynamic support and resistance. Unlike fixed horizontal levels, Keltner Channels adjust dynamically to market movements, providing more relevant support and resistance zones.
Volatility assessment. The channel width expands and contracts based on market volatility, allowing traders to gauge market conditions and adjust their strategies accordingly.
Lagging indicator. Since Keltner Channels are based on moving averages, they may lag behind current price action, making them less effective in rapidly changing markets.
False signals. In choppy or sideways markets, the indicator may generate misleading signals, leading to potential losses if not used in combination with other tools.
Limited standalone use. While helpful for trend identification, Keltner Channels are best used alongside other technical indicators for confirmation, as they don’t provide direct buy or sell signals.
Less effective in low volatility conditions. During periods of low volatility, the channel may become too narrow, reducing its effectiveness in identifying meaningful trading opportunities.
If the bands are slowly expanding while price is stuck in a tight range, the market is pre-loading for an explosive move

Most traders look at Keltner channels as just another volatility indicator, but the real power lies in how you combine the middle line with liquidity zones rather than just waiting for price to touch the bands. Instead of blindly entering on breakouts, analyze whether the middle line (EMA) is acting as a liquidity magnet. Market makers and institutions often push prices back toward the EMA to fill large orders. If you see a sharp move away from the middle line without any retest or wick rejection, it’s likely a false breakout engineered to trap retail traders. Always wait for confirmation in the form of price exhaustion near the upper or lower band — look for smaller candles, declining volume, or multiple wicks — before taking a position.
Another overlooked strategy is using Keltner channels to detect hidden momentum shifts before price makes a move. The upper and lower bands aren't just for breakout confirmation; they reveal how strong market sentiment actually is. Instead of waiting for price to break out, pay attention to how the bands react to price compression. If the bands are slowly expanding while price is stuck in a tight range, the market is pre-loading for an explosive move. The trick is to track whether the price is hugging the upper or lower quartile of the channel — this tells you which direction has the real momentum, even before a breakout happens. This is how professional traders get in before retail traders even see a setup.
Conclusion
Keltner Channels stand out as a versatile tool for traders seeking to identify trends and capitalize on breakouts with greater clarity. Unlike some other volatility bands, they smooth out price movements, reducing noise and offering cleaner signals, especially when combined with momentum indicators. For instance, using Keltner Channels in a trending market can help confirm entry points, while in a sideways market, they aid in spotting potential reversals. Ultimately, mastering Keltner Channels empowers traders to make more confident and informed decisions, turning market volatility into strategic trading opportunities.
FAQs
What trading assets are most suitable for Keltner Channels strategies?
How can Keltner Channels help identify hidden momentum shifts before major price moves?
What role does the middle line of the Keltner Channel play in trading decisions?
Are there limitations to using Keltner Channels during periods of low market volatility?
Editors' Top Picks and Insights

Do politicians make the best stock traders?

Crypto test drive: How automakers are exploring digital assets

Lindsey Graham death: U.S. senator’s crypto legacy

Tether under pressure: USDT in Europe, audit questions, and the fight for trust

Lean Ethereum: Why Buterin wants to rebuild the network

SK Hynix debuts on Nasdaq: Largest U.S. offering by foreign company
Related Articles
Team that worked on the article
Oleg Tkachenko is an economic analyst and risk manager having more than 14 years of experience in working with systemically important banks, investment companies, and analytical platforms. He has been a Traders Union analyst since 2018.
Dan Blystone began his trading career in 1998 as an arbitrage clerk on the floor of the Chicago Mercantile Exchange (CME). He later traded bond and Eurex futures at proprietary firms such as Altea Trading, gaining valuable experience in high-frequency trading and risk management.
Chinmay Soni is a financial analyst with more than 5 years of experience in working with stocks, Forex, derivatives, and other assets. As a founder of a boutique research firm and an active researcher, he covers various industries and fields, providing insights backed by statistical data.
Forex trading, short for foreign exchange trading, is the practice of buying and selling currencies in the global foreign exchange market with the aim of profiting from fluctuations in exchange rates. Traders speculate on whether one currency will rise or fall in value relative to another currency and make trading decisions accordingly. However, beware that trading carries risks, and you can lose your whole capital.
A long position in Forex, represents a positive outlook on the future value of a currency pair. When a trader assumes a long position, they are essentially placing a bet that the base currency in the pair will appreciate in value compared to the quote currency.
ATR (Average True Range) is a volatility indicator that helps traders assess the potential price range or volatility of a financial instrument. It calculates the average of true price ranges over a specified period, providing insight into the level of price fluctuations within that timeframe.
Bitcoin is a decentralized digital cryptocurrency that was created in 2009 by an anonymous individual or group using the pseudonym Satoshi Nakamoto. It operates on a technology called blockchain, which is a distributed ledger that records all transactions across a network of computers.
Day trading involves buying and selling financial assets within the same trading day, with the goal of profiting from short-term price fluctuations, and positions are typically not held overnight.

-
 Afghanistan
-
 Albania
-
 Algeria
-
 Angola
-
 Argentina
-
 Armenia
-
 Australia
-
 Austria
-
 Azerbaijan
-
 Bahamas
-
 Bahrain
-
 Bangladesh
-
 Belarus
-
 Belgium
-
 Bolivia
-
 Botswana
-
 Brazil
-
 Brunei
-
 Bulgaria
-
 Cambodia
-
 Cameroon
-
 Canada
-
 Chile
Chile
-
 China
China
-
 Colombia
-
 Congo
Congo
-
 Costa Rica
-
 Cote d'Ivoire
-
 Croatia
-
 Cuba
Cuba
-
 Cyprus
-
 Czechia
-
 DR Congo
-
 Denmark
-
 Dominican Republic
-
 Ecuador
-
 Egypt
Egypt
-
 El Salvador
-
 Estonia
-
 Eswatini
-
 Ethiopia
-
 Finland
-
 France
-
 Georgia
-
 Germany
-
 Ghana
Ghana
-
 Greece
-
 Haiti
Haiti
-
 Hong Kong
-
 Hungary
-
 India
India
-
 Indonesia
-
 Iran, Islamic republic
-
 Iraq
Iraq
-
 Ireland
-
 Israel
-
 Italy
Italy
-
 Jamaica
-
 Japan
Japan
-
 Jordan
-
 Kazakhstan
-
 Kenya
Kenya
-
 Korea
Korea
-
 Kuwait
-
 Kyrgyzstan
-
 Laos
Laos
-
 Latvia
-
 Lebanon
-
 Lesotho
-
 Libya
Libya
-
 Lithuania
-
 Luxembourg
-
 Madagascar
-
 Malaysia
-
 Malta
Malta
-
 Mauritius
-
 Mexico
-
 Moldova
-
 Mongolia
-
 Montenegro
-
 Morocco
-
 Mozambique
-
 Myanmar
-
 Namibia
-
 Nepal
Nepal
-
 Netherlands
-
 New Zealand
-
 Nigeria
-
 North Macedonia
-
 Norway
-
 Oman
Oman
-
 Pakistan
-
 Palestine
-
 Panama
-
 Papua New Guinea
-
 Paraguay
-
 Peru
Peru
-
 Philippines
-
 Poland
-
 Portugal
-
 Puerto Rico
-
 Qatar
Qatar
-
 Reunion
-
 Romania
-
 Rwanda
-
 Saudi Arabia
-
 Serbia
-
 Singapore
-
 Slovakia
-
 Slovenia
-
 Somalia
-
 South Africa
-
 Spain
Spain
-
 Sri Lanka
-
 Sweden
-
 Switzerland
-
 Syria
Syria
-
 Taiwan
-
 Tajikistan
-
 Tanzania
-
 Thailand
-
 Trinidad and Tobago
-
 Tunisia
-
 Turkey
-
 UAE
UAE
-
 Uganda
-
 Ukraine
-
 United Kingdom
-
United States
-
 Uruguay
-
 Uzbekistan
-
 Venezuela
-
 Vietnam
-
 Yemen
Yemen
-
 Zambia
-
 Zimbabwe
- Forex
- Crypto
