Fear And Greed Index in Crypto Trading


Editorial Note: While we adhere to strict Editorial Integrity, this post may contain references to products from our partners. Here's an explanation for How We Make Money. None of the data and information on this webpage constitutes investment advice according to our Disclaimer.
The fear and greed index can help crypto traders identify market cycles and adjust their strategies. When the index is low, it signals fear and a good time to buy low. When high, it signals greed and time to sell high.
Many traders keep a close eye on indicators and signals when deciding their next moves, but have you considered looking at emotions? Human sentiment greatly influences crypto prices. This article shares real-time readings of the Fear and Greed Index that can help you better understand the cycles of market emotions.
By tracking signals from traders online and factors like volatility, this index gives a daily reading between extreme fear and greed. Learning how it's made may satisfy your investing curiosity, and understanding where sentiment stands could help you spot opportunities when others are panic selling or FOMO buying. We also explore how studying this emotional element can benefit your trading strategies.
Fear and Greed Index in Crypto Today
The fear and greed index is updated daily by a team of developers and enthusiasts who are passionate about crypto and blockchain. The team is based in Germany and operates under the name of Alternative.me.
Below you can find the latest readings of the index.
 The Fear and Greed Index (source: alternative.me)
This index is based on the idea that fear and greed are the two main emotions that govern the crypto market. When this market is fearful, people tend to sell their crypto assets, causing the prices to drop.
When the market is greedy, people tend to buy more crypto assets, causing the prices to rise. These emotions can also create opportunities for savvy traders who can exploit the market inefficiencies and take advantage of the price swings.
Best cryptocurrency exchanges


Using the fear and greed index in crypto trading
One of the most practical ways to apply the Fear and Greed Index is to identify potential entry and exit points for opening and closing trades.
For entries, look for opportunities when the index shows extreme fear (under 20). This indicates prices are likely oversold as traders are panicking. Bitcoin/ETH often see rebounds within a week of such fear spikes. Go long with tight stops, aiming to capture 10-20% moves as sentiment improves.
Another approach is trend continuation trades. When the index transitions from fear to greed, it suggests the prevailing downtrend is losing steam. Watch for divergence between still falling prices and a rising index. Once prices stabilize, go long for the next leg up as FOMO takes over.
On the exit side, look to take profits when greed is maximum (over 80). This shows prices are arguably overextended with little room left to run short-term. Take gains off the table before the inevitable correction.
Consolidation periods with a high, steady index also present chances to bank wins. As euphoria solidifies into a plateau, prices often move sideways for weeks. Set profit targets and trailing stops to capitalize on volatility without guessing the top.
The 20-30 range marks classic indecision between fear and greed. Choppy, sideways markets are common. Consider closing positions and waiting on the sidelines until stronger signals emerge again.
By setting price alerts based on index thresholds, traders can automate entries and exits informed by evolving market psychology. Backtesting different strategies on historical data also helps optimize approaches.
Various market sentiment indexes
The fear and greed index is not the only market sentiment index that exists
Glassnode's fear and greed index is a popular market sentiment index that is similar to the crypto fear and greed index.
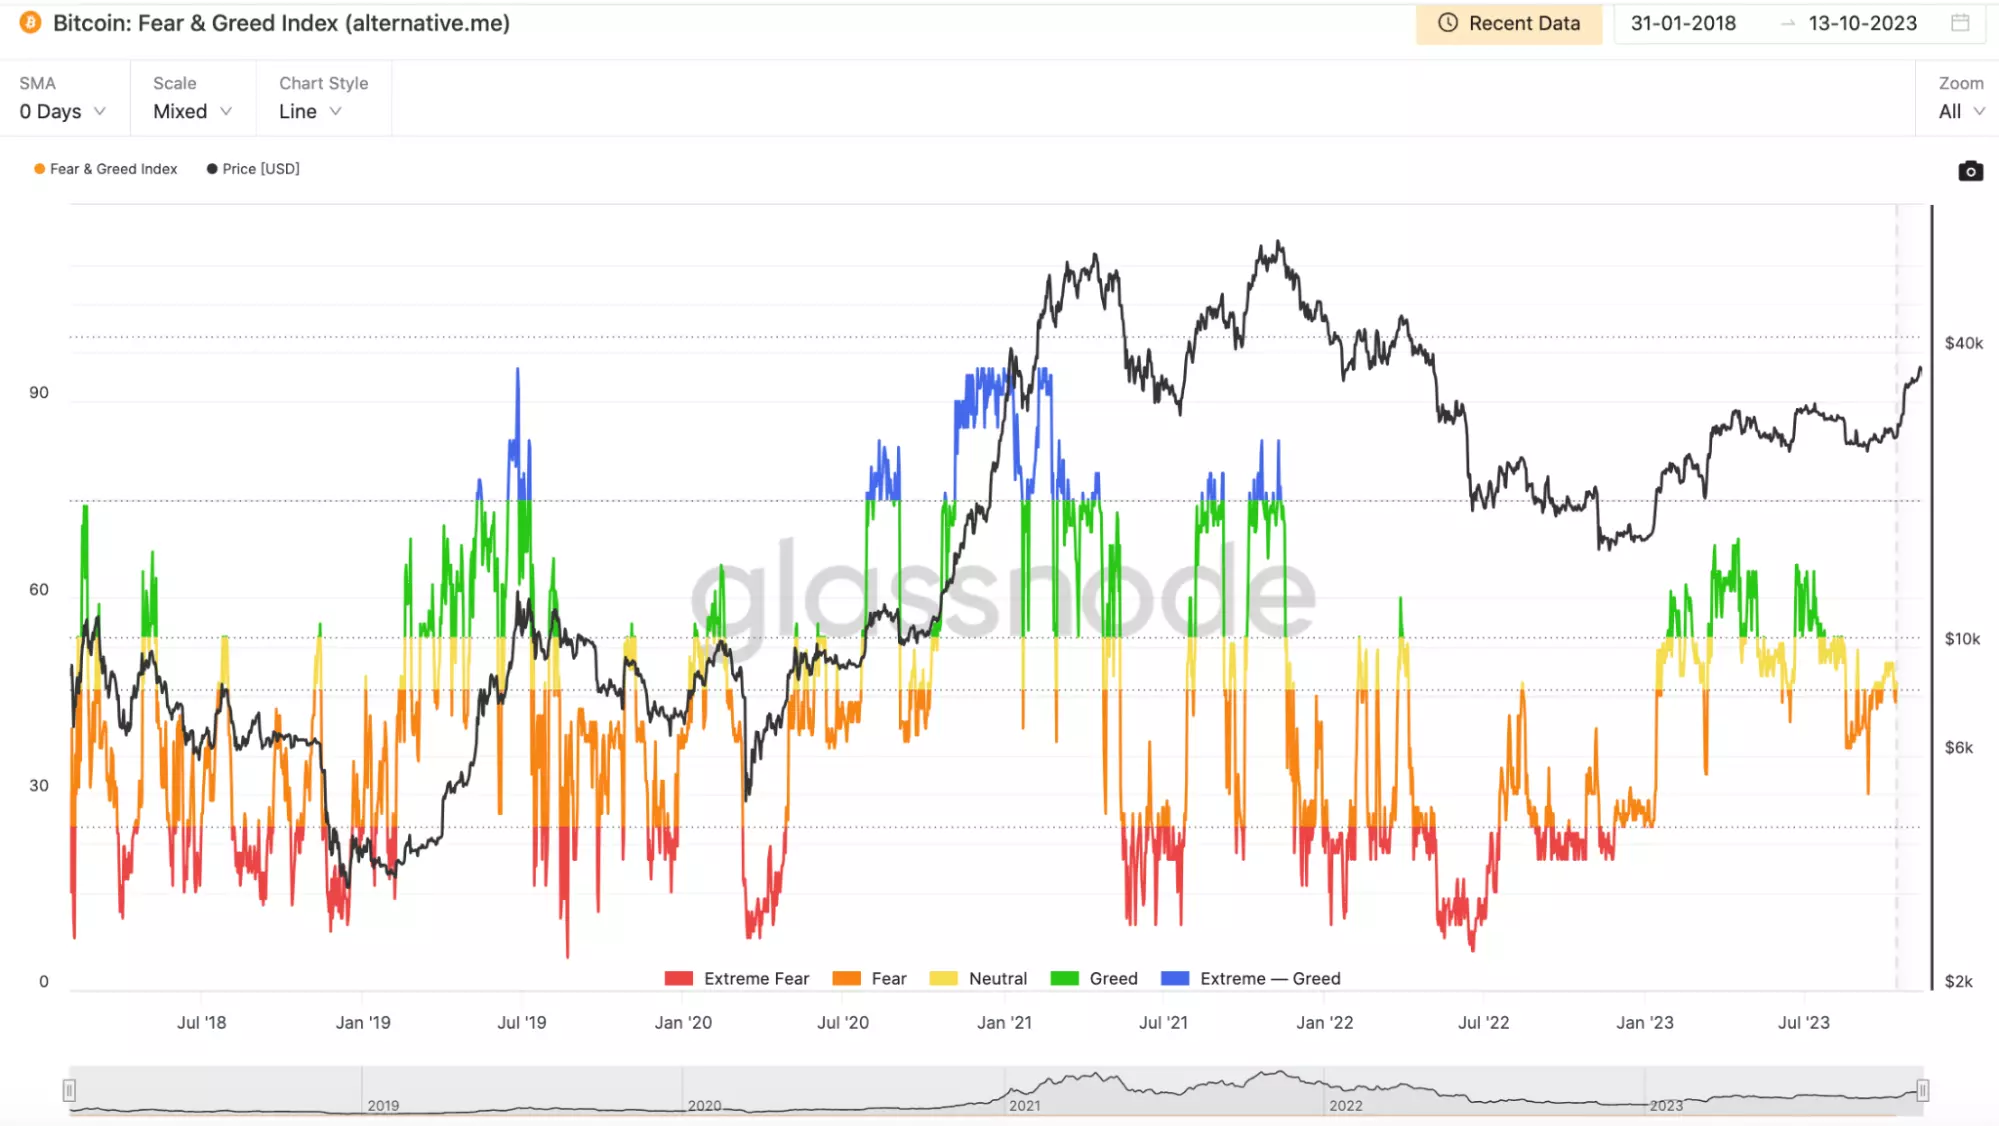 Glassnode’s Fear and Greed Index (source:studio.glassnode.com)
It tracks the sentiment of crypto investors by analyzing a variety of on-chain data, such as transaction activity and network congestion. This index is updated daily and ranges from 0 (extreme fear) to 100 (extreme greed).
The sentiment strength indicator (SSI) is a unique market sentiment index that tracks the strength of both positive and negative sentiment in the crypto market.
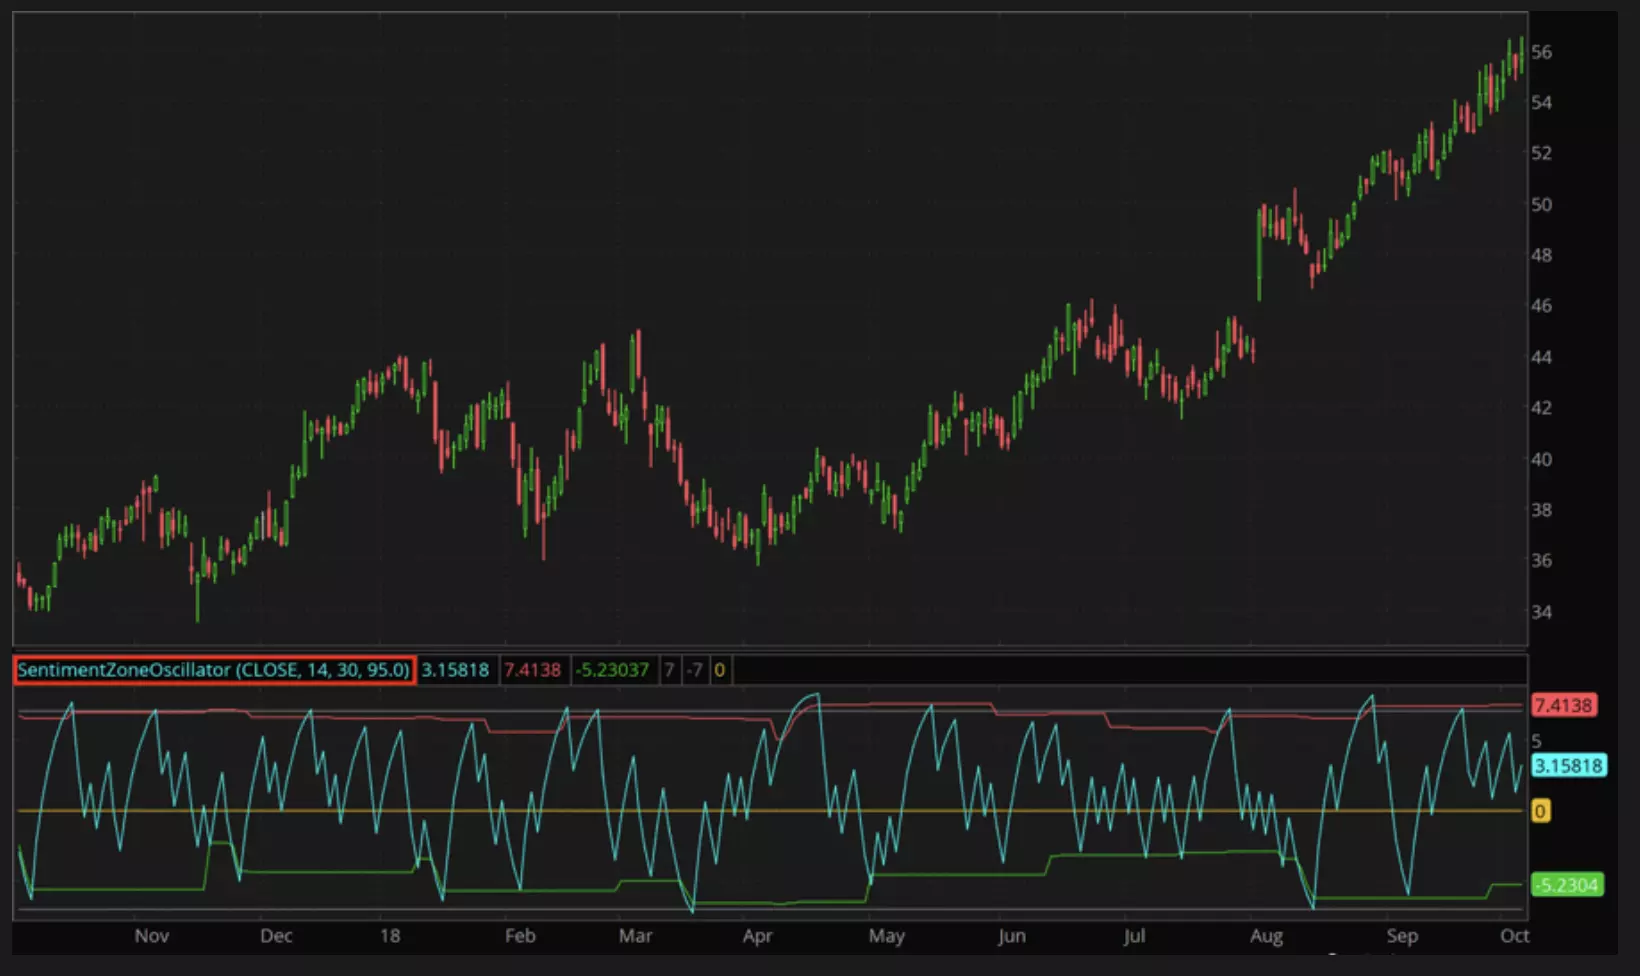 Sentiment Strength Indicator (SSI) (source:tlc.thinkorswim.com)
The SSI is calculated using a proprietary machine learning algorithm that analyzes the sentiment of social media posts, such as those from Twitter and Reddit. The algorithm considers the sentiment of the words used in the posts, the number of likes and retweets, and the reputation of the author of the post. The index is updated daily and ranges from -2 (strongly negative) to 2 (strongly positive).
The crypto volatility index (CVIX) by BitMEX is a measure of the volatility of the crypto market.
CVIX is calculated using a logarithmic formula that analyzes the daily price changes of Bitcoin over the past 30 days. This formula takes into account the standard deviation of these price changes, effectively measuring the dispersion of Bitcoin's value over the specified period. The index is updated daily and ranges from 0 (low volatility) to 100 (high volatility).
Measuring market sentiment is important
Measuring market sentiment is important in trading for several reasons.
First, market sentiment analysis helps define future price movements and helps traders align their investments with these movements. By knowing the prevailing mood of the market, traders can anticipate the possible reactions of other traders and plan entry and exit points accordingly.
Market sentiment helps traders take control of their emotions and make a calculated decision instead of being vulnerable to market volatility. By avoiding panic selling or FOMO buying, traders can reduce their losses and increase their profits.
Market sentiment can help traders identify profitable opportunities that may not be obvious from technical or fundamental analysis. For example, traders can spot oversold or overbought conditions, contrarian signals, or emerging trends by analyzing the sentiment indicators.
Market sentiment can also help traders diversify their portfolio by exposing the trader to different crypto assets and sectors. By following social media and community analytics, traders can discover new projects, innovations, and developments that may have a positive impact on the crypto market.
Market sentiment can also help traders improve their trading skills by challenging their assumptions and biases. By comparing their own views with the views of other traders and experts, they can learn from their perspectives and experiences, and refine their own strategies.
Computing the fear and greed index
The fear and greed index is computed by using a weighted average of five different factors. Each factor has a different contribution to the index and is based on a different data source. These five factors are summarized below.
Volatility. This factor compares the current volatility and maximum drawdowns of Bitcoin with the average values of the last 30 and 90 days. A high volatility indicates a fearful market, while a low volatility indicates a greedy market. This factor contributes 25% to the index.
Market momentum/volume. This factor measures the current volume and market momentum of Bitcoin and compares them with the average values of the last 30 and 90 days. A high buying volume and positive market momentum indicate a greedy market, while a low buying volume and negative market momentum indicate a fearful market. This factor also contributes 25% to the index.
Social media. This factor analyzes the emotions and sentiments of crypto-related posts on X and Reddit. A high number of positive posts and interactions indicate a greedy market, while a high number of negative posts and interactions indicate a fearful market. This factor contributes 15% to the index.
Surveys. This factor collects the opinions of crypto investors and experts through online surveys. A high percentage of bullish responses indicate a greedy market, while a high percentage of bearish responses indicate a fearful market. This factor also contributes 15% to the index.
Google trends. This factor tracks the search volume of crypto-related keywords on Google. A high search volume indicates a high public interest and a greedy market, while a low search volume indicates a low public interest and a fearful market. This factor contributes 10% to the index.
Expert opinion

Price movements in the volatile crypto market are heavily driven by emotions, so incorporating market sentiment indicators like the Fear and Greed Index can provide valuable insight.
One piece of advice I would offer novice traders is not to overreact to fear and greed signals alone. Extreme readings on the index often present opportunities, but it's still important to confirm trends and price levels with your own analysis. Don't simply buy when others are fearful or sell when euphoria reigns - make sure the technicals also support your entry and exit points.
Sentiment indicators should complement, not replace, your core trading strategy. Use fear and greed readings to shine additional light on the market's underlying mood, then apply your strategy filters to capitalize on validated trading setups.
I'd also caution against being too greedy when greed is high. Yes, squeezing out that last 5-10% gain can be tempting as prices hover near new record highs. But sentiment reversals can happen quickly, and cutting your winners short is better than giving back profits entirely during a major correction. Try taking a portion of the stack off the table every 10-15 Greed points above 60 - this dollar cost averaging approach harvests gains without forcing you to pick tops.
Related Articles
Team that worked on the article
Thomas Wettermann is an experienced writer and a contributor to the Traders Union website. Over the last 30 years, he has written posts, articles, tutorials, and publications on several different high tech, health, and financial technologies, including FinTech, Forex trading, cryptocurrencies, metaverses, blockchain, NFTs and more. He is also an active Discord and Crypto Twitter user and content producer.
Dr. BJ Johnson is a PhD in English Language and an editor with over 15 years of experience. He earned his degree in English Language in the U.S and the UK. In 2020, Dr. Johnson joined the Traders Union team. Since then, he has created over 100 exclusive articles and edited over 300 articles of other authors.
Mirjan Hipolito is a journalist and news editor at Traders Union. She is an expert crypto writer with five years of experience in the financial markets. Her specialties are daily market news, price predictions, and Initial Coin Offerings (ICO).
A Trailing Stop Order is a type of order that automatically adjusts the stop-loss level as the market price moves in a favorable direction, helping to protect profits.
Forex trading, short for foreign exchange trading, is the practice of buying and selling currencies in the global foreign exchange market with the aim of profiting from fluctuations in exchange rates. Traders speculate on whether one currency will rise or fall in value relative to another currency and make trading decisions accordingly. However, beware that trading carries risks, and you can lose your whole capital.
The deviation is a statistical measure of how much a set of data varies from the mean or average value. In forex trading, this measure is often calculated using standard deviation that helps traders in assessing the degree of variability or volatility in currency price movements.
Volatility refers to the degree of variation or fluctuation in the price or value of a financial asset, such as stocks, bonds, or cryptocurrencies, over a period of time. Higher volatility indicates that an asset's price is experiencing more significant and rapid price swings, while lower volatility suggests relatively stable and gradual price movements.
Backtesting is the process of testing a trading strategy on historical data. It allows you to evaluate the strategy's performance in the past and identify its potential risks and benefits.

-
 Afghanistan
-
 Albania
-
 Algeria
-
 Argentina
-
 Armenia
-
 Australia
-
 Austria
-
 Azerbaijan
-
 Bahamas
-
 Bahrain
-
 Bangladesh
-
 Belgium
-
 Botswana
-
 Brazil
-
 Brunei
-
 Bulgaria
-
 Burma
Burma
-
 Cambodia
-
 Cameroon
-
 Canada
-
 Chile
Chile
-
 China
China
-
 Colombia
-
 Costa Rica
-
 Cote d'Ivoire
-
 Croatia
-
 Cyprus
-
 Czech Republic
-
 Denmark
-
 Dominican Republic
-
 Ecuador
-
 Egypt
Egypt
-
 Estonia
-
 Eswatini
-
 Ethiopia
-
 Finland
-
 France
-
 Georgia
-
 Germany
-
 Ghana
Ghana
-
 Greece
-
 Haiti
Haiti
-
 Hong Kong
-
 Hungary
-
 India
India
-
 Indonesia
-
 Iran, Islamic republic
-
 Iraq
Iraq
-
 Ireland
-
 Israel
-
 Italy
Italy
-
 Jamaica
-
 Japan
Japan
-
 Jordan
-
 Kazakhstan
-
 Kenya
Kenya
-
 Korea
Korea
-
 Kuwait
-
 Kyrgyzstan
-
 Laos
Laos
-
 Latvia
-
 Lebanon
-
 Libyan Arab Jamahiriya
-
 Lithuania
-
 Luxembourg
-
 Macedonia
-
 Madagascar
-
 Malaysia
-
 Malta
Malta
-
 Mauritius
-
 Mexico
-
 Moldova
-
 Mongolia
-
 Montenegro
-
 Morocco
-
 Mozambique
-
 Namibia
-
 Nepal
Nepal
-
 Netherlands
-
 Nigeria
-
 Norway
-
 Oman
Oman
-
 Pakistan
-
 Palestine
-
 Papua New Guinea
-
 Peru
Peru
-
 Philippines
-
 Poland
-
 Portugal
-
 Puerto Rico
-
 Qatar
Qatar
-
 Romania
-
 Rwanda
-
 Saudi Arabia
-
 Serbia
-
 Singapore
-
 Slovakia
-
 Slovenia
-
 Somalia
-
 South Africa
-
 Spain
Spain
-
 Sri Lanka
-
 Sweden
-
 Switzerland
-
 Syrian Arab Republic
-
 Taiwan
-
 Tajikistan
-
 Tanzania, United Republic Of
-
 Thailand
-
 Trinidad and Tobago
-
 Tunisia
-
 Turkey
-
 UAE
UAE
-
 Uganda
-
 Ukraine
-
 United Kingdom
-
United States
-
 Uzbekistan
-
 Venezuela
-
 Vietnam
-
 Yemen
Yemen
-
 Zambia
-
 Zimbabwe
- Forex
- Crypto

