50-Day Moving Average (50 MA): Definition, Strategies And Settings


Editorial Note: While we adhere to strict Editorial Integrity, this post may contain references to products from our partners. Here's an explanation for How We Make Money. None of the data and information on this webpage constitutes investment advice according to our Disclaimer.
The 50-day moving average (50 MA) is a widely-used technical indicator that helps traders analyze market trends and make informed trading decisions. It smooths out price fluctuations over the past 50 days, making it easier to identify trend direction, support, and resistance levels. Traders often use the 50 MA alongside other indicators for more accurate signals.
The 50-day moving average (50-day MA) is an indicator used mostly by traders using medium-term strategies. The 50-day MA is a “faster” moving average that is most frequently used together with “slower” 100-day and/or 200-day moving averages. In this article we will discuss the differences between the main types of moving averages, how to trade a 50-day MA, main recommendations and strategies for working with this indicator.
What is a 50-day MA?
A 50-day moving average (50-DMA) is a technical analysis tool that calculates the average closing price of a security over the past 50 trading days. This average is plotted daily, creating a trend line that smooths out short-term price fluctuations, helping traders and investors identify the underlying trend of a security.
Calculation: To compute the 50-DMA, sum the closing prices of the security for the last 50 days and divide by 50. Each day, the oldest data point is replaced with the most recent closing price, allowing the average to "move" forward.
How to trade a 50-day MA?
The 50-day moving average (50-DMA) is a widely used technical indicator that helps traders identify intermediate-term trends by smoothing out price data over the past 50 trading days. Incorporating the 50-DMA into your trading strategy can enhance decision-making through various approaches.
Trend identification
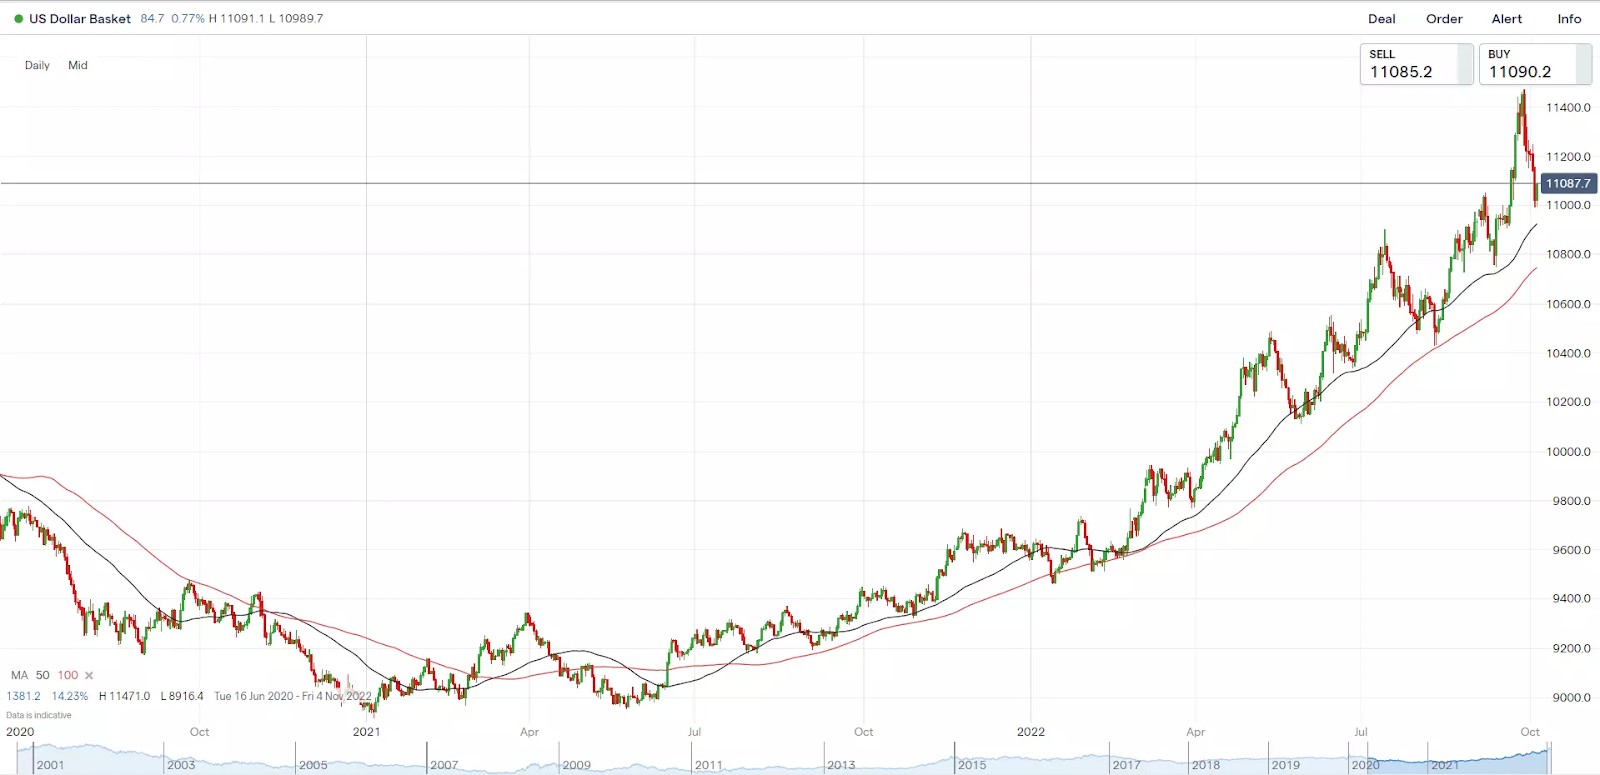
Bullish trend. When the asset's price consistently remains above the 50-DMA, it indicates an upward trend.
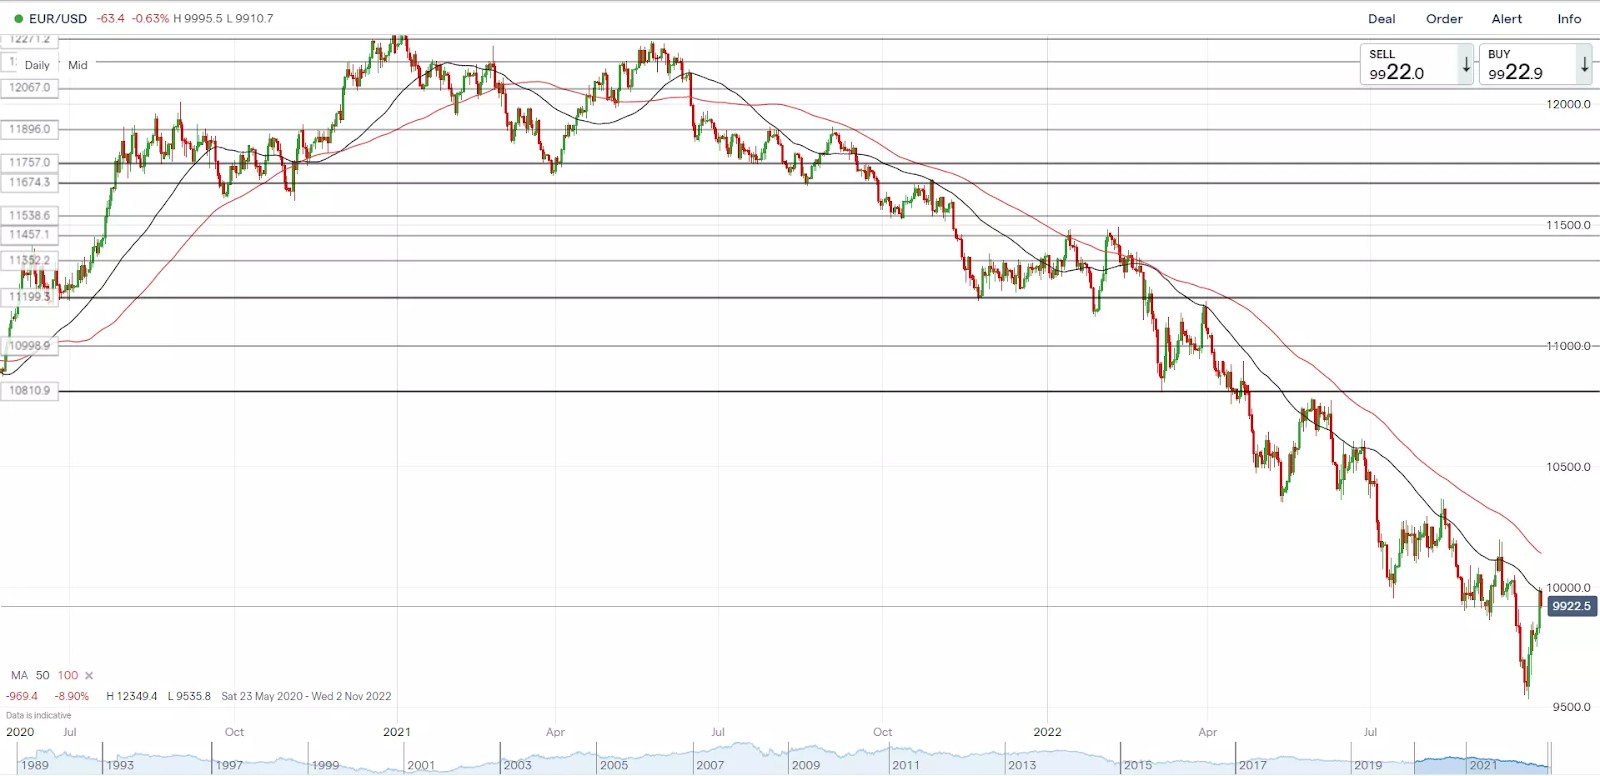
Bearish trend. Conversely, a price consistently below the 50-DMA suggests a downward trend.
Support and resistance levels
Support. In an uptrend, the 50-DMA often acts as a support level where the price may find buying interest.

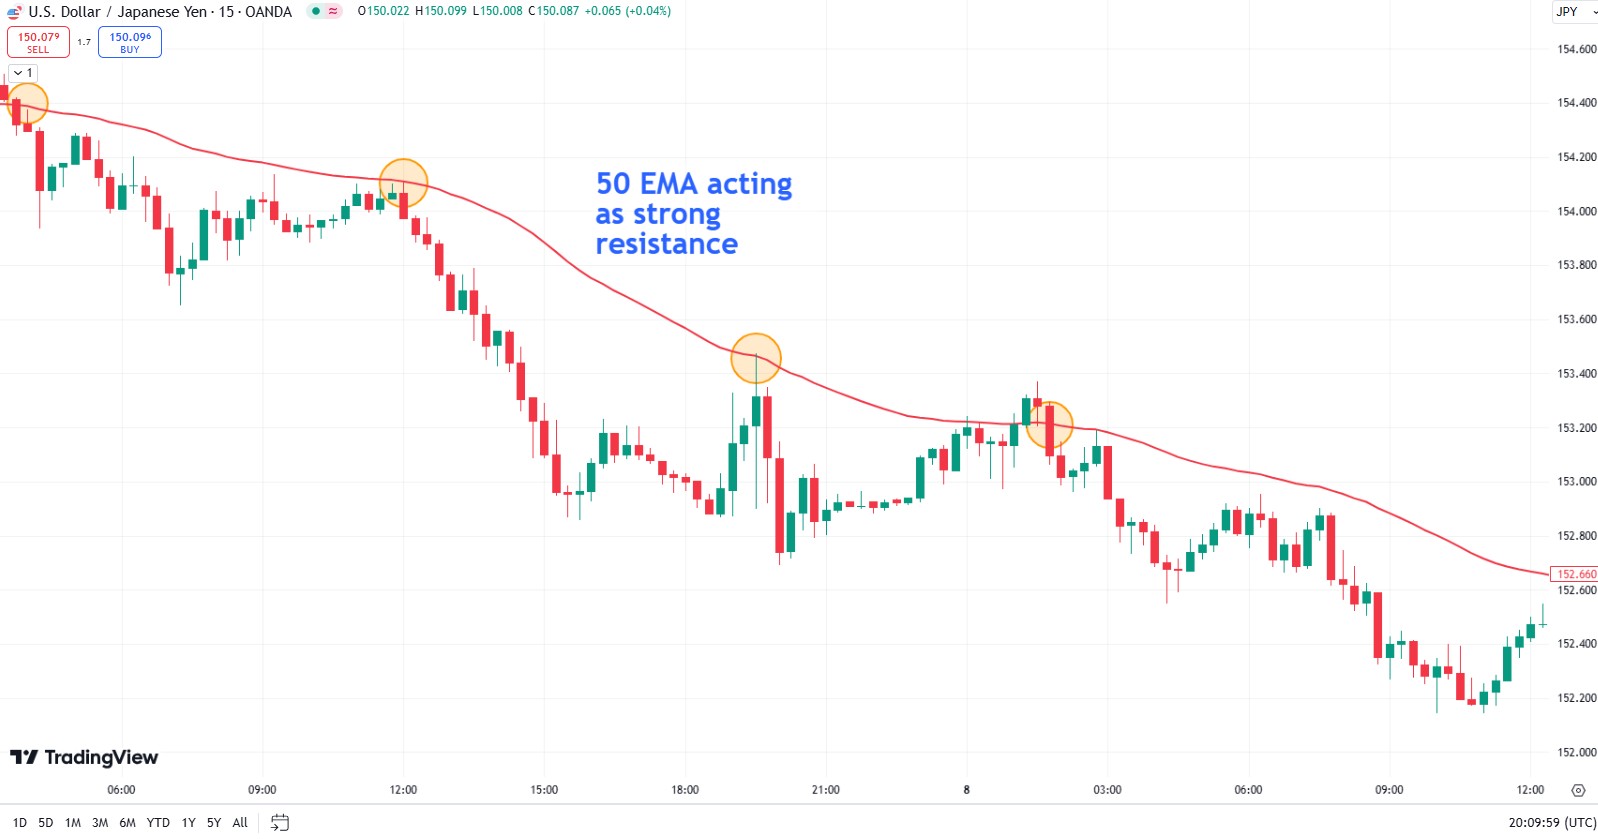
Resistance. In a downtrend, the 50-DMA can serve as a resistance level where selling pressure might emerge.
Moving average crossovers
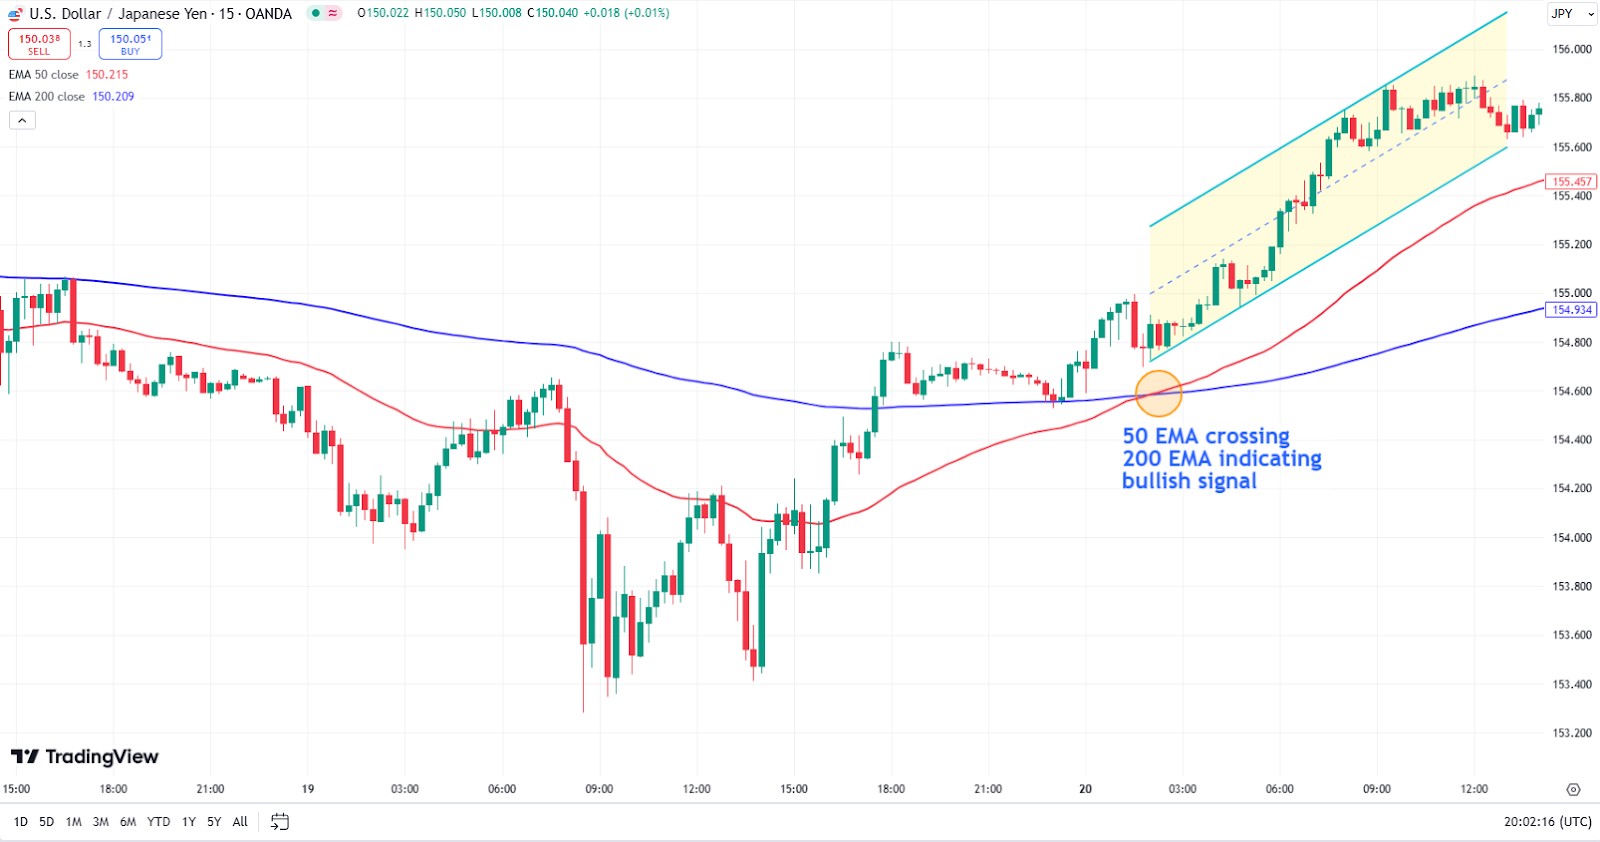
Golden cross. Occurs when the 50-DMA crosses above the 200-day moving average, signaling a potential bullish market shift.
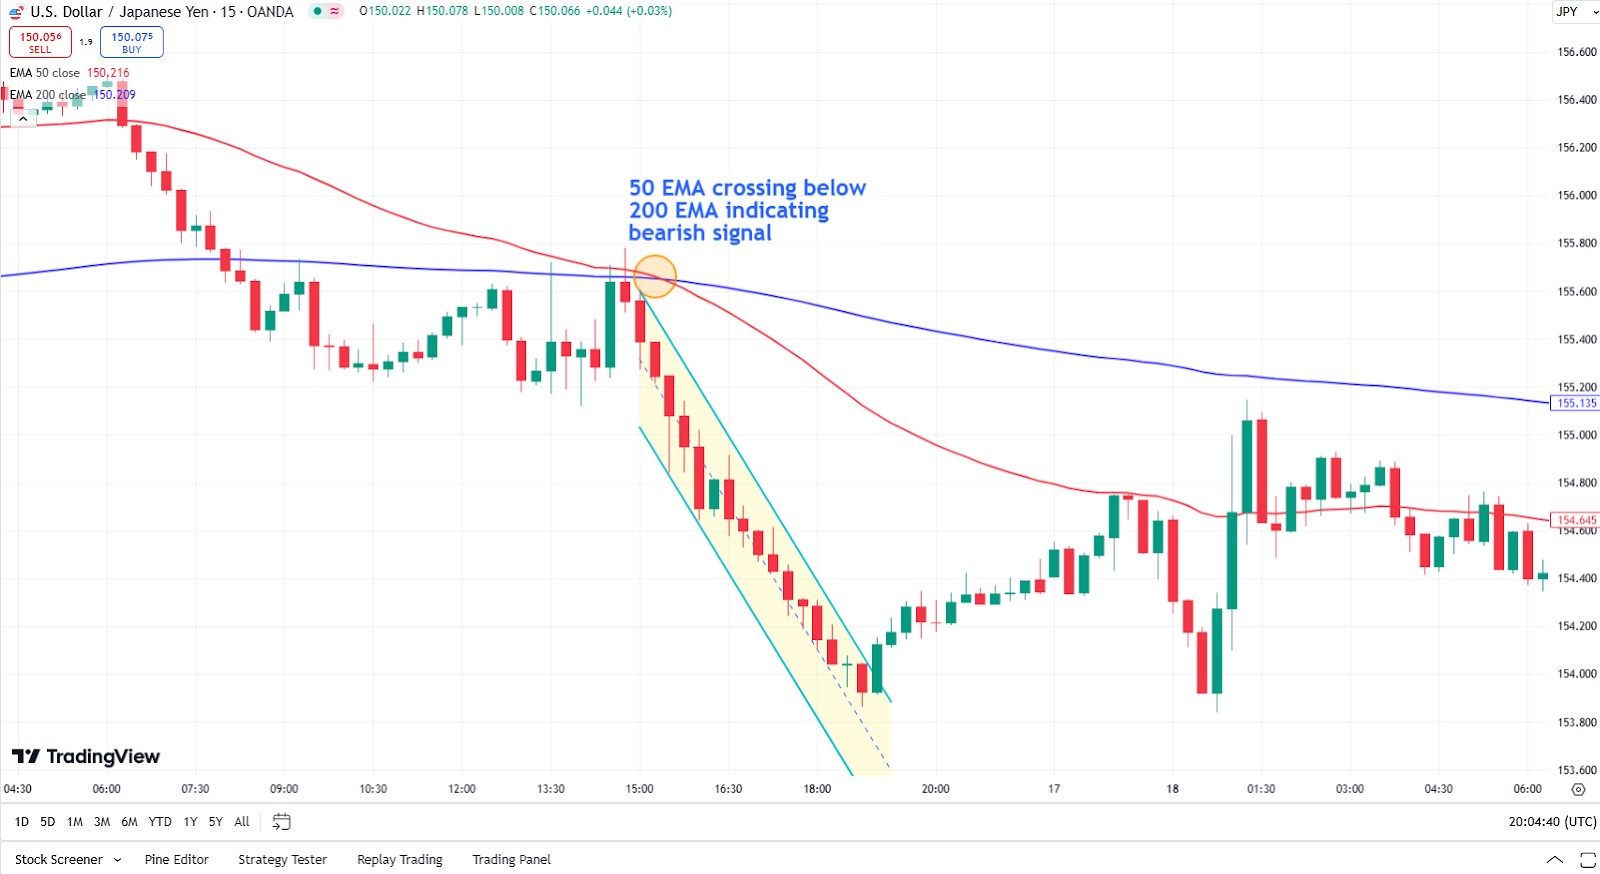
Death cross. Happens when the 50-DMA crosses below the 200-day moving average, indicating a possible bearish trend.
Entry and exit signals
Buying opportunity. Consider entering a long position when the price crosses above the 50-DMA, especially if confirmed by other indicators.
Selling opportunity. Consider exiting or shorting when the price falls below the 50-DMA, particularly if supported by additional bearish signals.
Trailing stop-loss
Use the 50-DMA as a dynamic stop-loss level to protect profits. For instance, in a long position, you might exit if the price closes below the 50-DMA.
Combining with other indicators
Enhance the reliability of signals by combining the 50-DMA with other technical tools like the relative strength index (RSI) or moving average convergence divergence (MACD).
The 50-day MA trading strategies
Regardless of the period of the moving average, the trading strategy using it is quite standard, i.e. traders either trade from the moving average, thereby following the trend, or use the crossovers of moving averages of different periods in an attempt to enter a trade at the trend reversal.
These strategies, which have long become classics, are the golden cross and the death cross. If the 50-day moving average crosses the 100-day MA (and/or 200-day MA) from below to above, the signal is bullish and is called the golden cross. In this case, traders should consider either exiting a short position or opening a long one.
Crossing of a “long” 100-day MA (and/or 200 MA) by the “short” 50-day MA from above to below forms a bearish signal – the death cross, and traders either need to make a decision to exit a long position or open a short position.
Below is an example of the golden cross formation on the Apple chart.
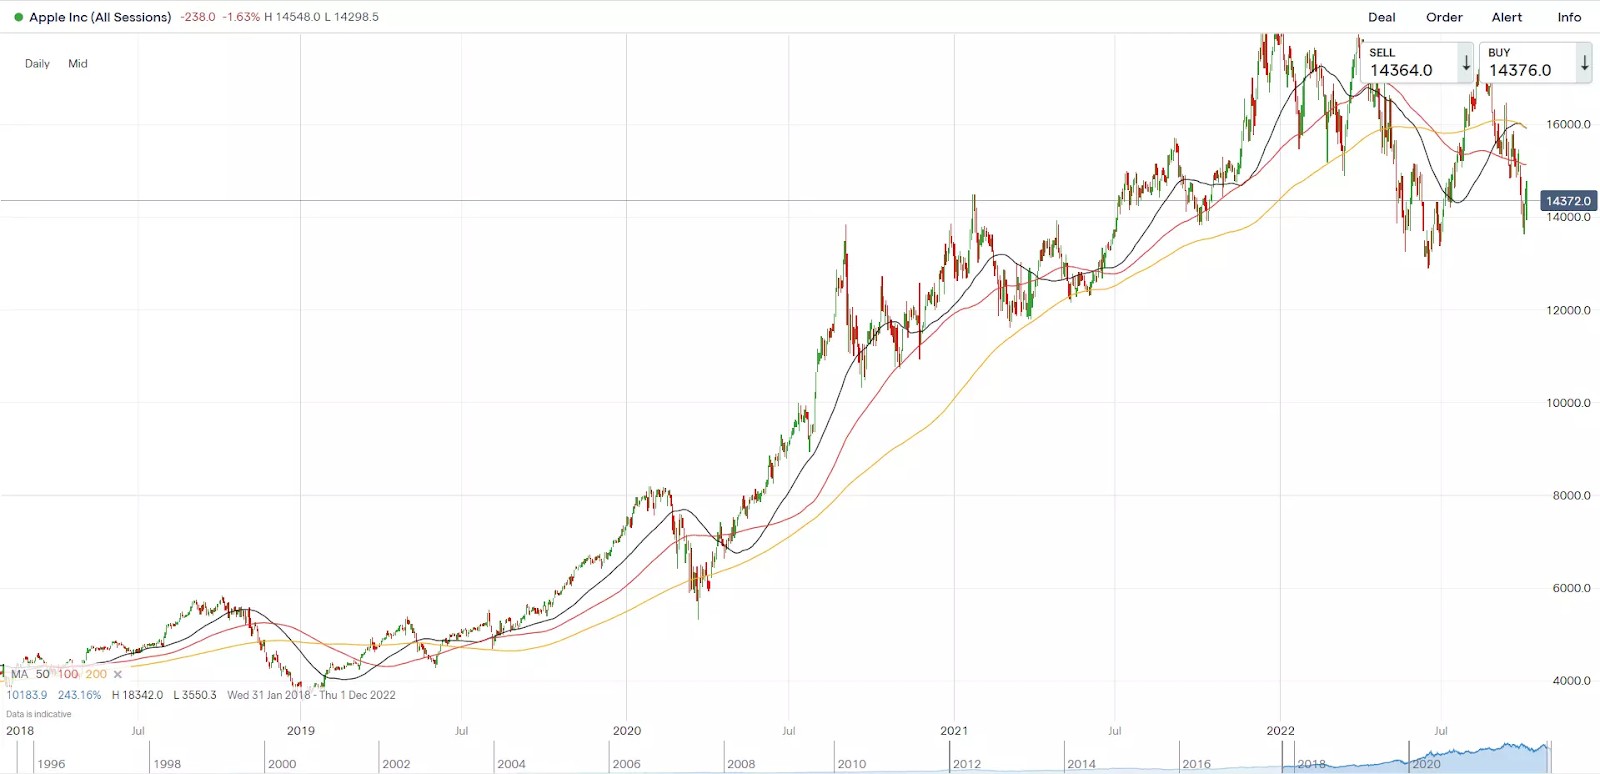
Following the 2018-2019 consolidation, Apple quotes broke out the resistance and started a long-term upward trend. Therefore, trend reversal, in addition to resistance breakout, was confirmed by the crossing of the 50-day MA, 100 MA and 200 MA. The situation was dangerous when the price dropped below the 200-day MA, but it did not cross the 50-day MA, and therefore there was no confirmation of the bearish reversal, and the price once again started moving upwards.
Example of the death cross on the EUR/CHF chart.

Inability of the euro bulls to breakout the resistance at 1.1070-1.1122 caused liquidation of long positions and decline of the pair, which grew into a long downward trend. Crossing of the 50-day MA of the 100-day MA was the first reversal signal, and subsequent crossing of the 200-day MA became a solid confirmation of the trend reversal in the market. As you can see, the following rollbacks both to 100 MA and 200 MA were used to sell, which confirms the importance of the use of all three moving averages.
How to avoid false signals when trading the 50-day MA
The 50-day moving average (50-MA) is a widely used tool in technical analysis, helping traders identify trends and potential reversal points. However, relying solely on the 50-MA can lead to false signals, especially during volatile or sideways markets. To mitigate this risk, consider the following strategies:
Combine multiple moving averages. Using a combination of moving averages with different time frames can help filter out false signals. For instance, pairing a short-term moving average (e.g., 20-day) with a longer-term one (e.g., 50-day) can provide a clearer picture of the market trend. This approach reduces the likelihood of false signals that may arise from using a single moving average.
Incorporate additional technical indicators. Enhance the reliability of your trading signals by integrating other indicators such as the relative strength index (RSI) or the moving average convergence divergence (MACD). These tools can confirm the strength of a trend or indicate potential reversals, providing a more comprehensive analysis.
Assess market conditions. Moving averages are most effective in trending markets but can produce false signals in sideways or choppy markets. Always consider the broader market context before acting on a moving average signal.
Adjust moving average lengths appropriately. Over-optimizing moving average lengths can lead to overfitting, where your strategy works well in the past but performs poorly in the future. It's essential to choose moving average periods that align with your trading strategy and risk tolerance.
Implement risk management practices. Establishing clear risk management rules, such as setting stop-loss orders and position sizing, can help protect your capital against false signals and unexpected market movements.
To test strategies, it is important to choose a reliable broker. We have studied the conditions of the best companies and offer you to read the comparison table:
| Demo | Min. deposit, $ | Max. leverage | Min Spread EUR/USD, pips | Max Spread EUR/USD, pips | Investor protection | Open an account | |
|---|---|---|---|---|---|---|---|
| Yes | 100 | 1:300 | 0,5 | 0,9 | €20,000 £85,000 SGD 75,000 | Open an account Your capital is at risk. |
|
| Yes | No | 1:500 | 0,5 | 1,5 | £85,000 €20,000 €100,000 (DE) | Open an account Your capital is at risk.
|
|
| Yes | No | 1:200 | 0,1 | 0,5 | £85,000 SGD 75,000 $500,000 | Open an account Your capital is at risk. |
|
| Yes | 100 | 1:50 | 0,7 | 1,2 | £85,000 | Study review | |
| Yes | No | 1:30 | 0,2 | 0,8 | $500,000 £85,000 | Open an account Your capital is at risk. |
50 MA vs 50 EMA
In technical analysis, the 50-day Simple Moving Average (SMA) and the 50-day Exponential Moving Average (EMA) are tools used to smooth price data over a specified period, aiding in trend identification. The primary distinction between them lies in their sensitivity to recent price changes:
50-Day SMA. Calculates the average of closing prices over the past 50 days, assigning equal weight to each data point.
50-Day EMA. Applies greater weight to more recent prices, making it more responsive to recent market movements.
50-Day SMA pros and cons
- Pros
- Cons
- Simplicity. Easy to calculate and interpret, making it accessible for traders at all levels.
- Stability. Less susceptible to short-term volatility, providing a clearer view of the overall trend.
- Lagging indicator. May respond slowly to rapid price changes, potentially delaying signals for trend reversals.
50-Day EMA pros and cons
- Pros
- Cons
- Responsiveness. More sensitive to recent price movements, allowing for quicker detection of trend changes.
- Timely signals. Can provide earlier entry and exit points compared to the SMA.
- Susceptibility to noise. In volatile markets, the EMA's sensitivity may lead to false signals due to overreacting to short-term price fluctuations.
Choosing between SMA and EMA
The choice between a 50-day SMA and a 50-day EMA depends on your trading strategy and the specific market conditions:
Stable markets. In markets with less volatility, the SMA's stability can be advantageous for identifying long-term trends.
Volatile markets. In more volatile environments, the EMA's responsiveness may help in capturing short-term movements.
It's common practice to use both types of moving averages in conjunction to gain a comprehensive understanding of market trends. For instance, some traders monitor both the 50-day SMA and EMA to identify potential crossovers, which can signal changes in market direction.
After the breakout, watch how the price reacts when it revisits the 50-MA

The 50-day moving average (50-MA) can be a powerful tool when combined with multi-timeframe analysis. Instead of relying on it alone, use the 50-MA to align short-term and long-term trends. For example, check if the price on the daily chart is above the 50-MA. Then, zoom in on an hourly chart to find a pullback to the 50-MA before entering a trade. This way, you're not just following a trend blindly — you’re improving your timing and reducing unnecessary risks.
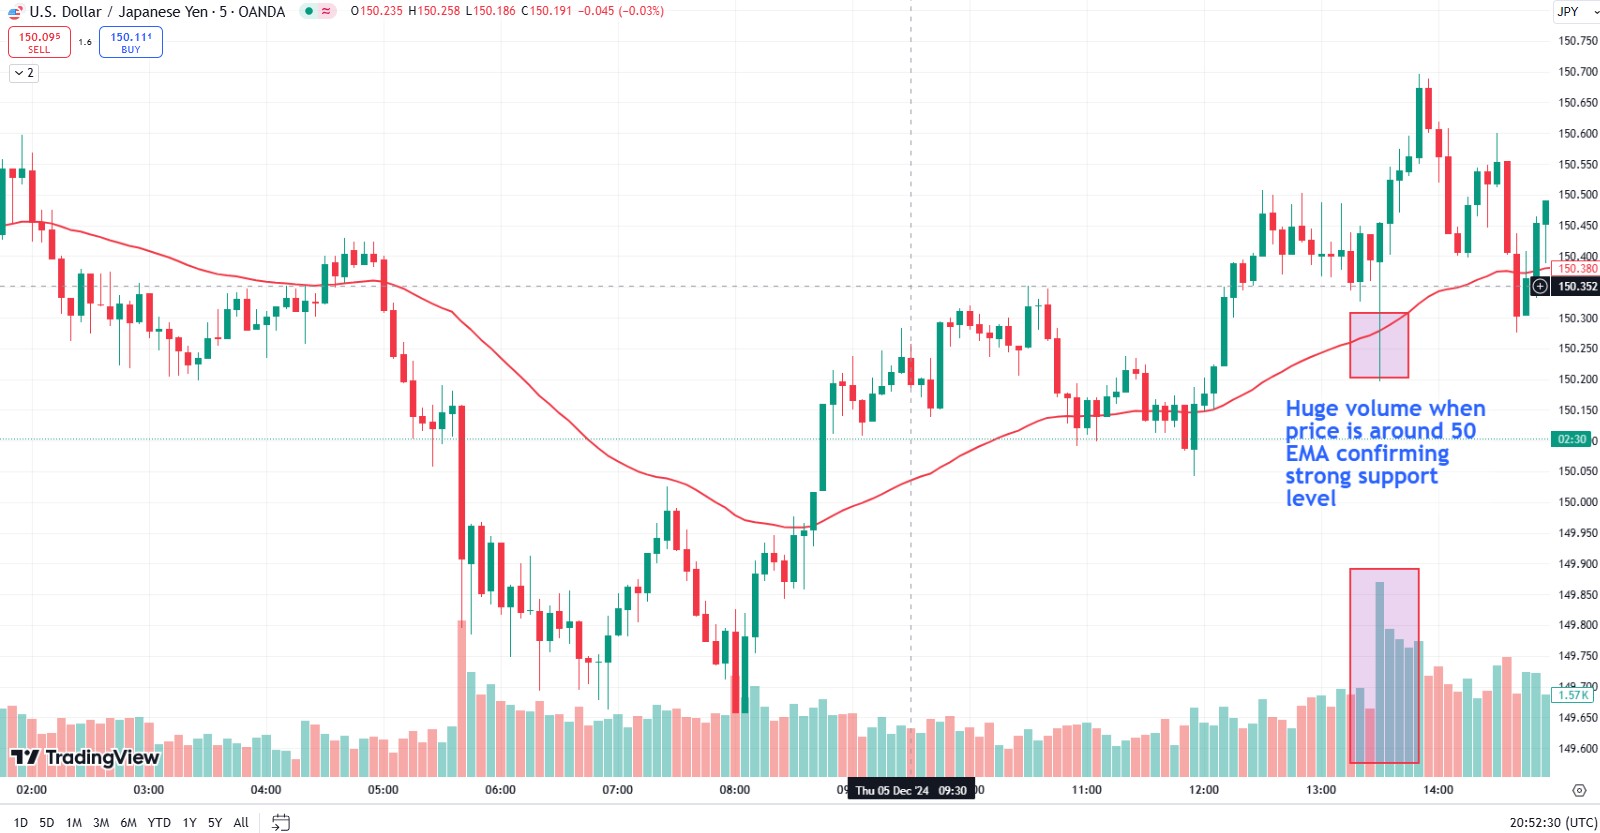
Adding volume analysis to your 50-MA strategy makes it even more effective. A price move above or below the 50-MA holds more weight when trading volume is significantly higher than usual. For instance, if a stock breaks above the 50-MA with a volume spike above its 20-day average, it’s a strong sign of genuine interest from the market. After the breakout, watch how the price reacts when it revisits the 50-MA. A bounce off this level often confirms a solid trend shift and can be a great entry point for your trade.
Conclusion
The 50-day moving average (50 MA) is a versatile tool that helps traders assess market trends and find entry and exit points. Due to its flexibility, this indicator can be used for both short-term and long-term trading, especially when combined with other analytical tools. The settings and strategies for using the 50 MA depend on the trading style and the selected asset, so it is important to test the indicator on historical data. Using the 50 MA together with support and resistance levels or oscillators such as RSI increases the accuracy of signals. Despite its simplicity, the 50 MA requires a careful approach and consideration of market conditions to avoid false signals. For best results, traders are advised to combine the indicator with other technical analysis tools.
FAQs
What is a 50-day moving average?
The 50-day Moving Average is one of the most frequently used technical indicators by investors and traders to identify a trend or its reversal.
50-day MA vs 50-day EMA - what are the pros and cons?
The 50-day exponential moving average (EMA) is faster compared to the 50-day Simple Moving Average, and therefore it provides a buy/sell signal earlier. At the same time, a ‘slow’ moving average gives a more reliable signal that shows lower probability of being false.
How do I trade using the 50-day MA?
As is the case with other moving averages, the 50-day MA is used by traders to identify the trend and trade the trend, using the rollbacks towards it.
What trading strategies use the 50-day MA?
The main strategies of trading in the markets by using the 50-day moving average include the golden cross, i.e. a crossover of the 50-day MA by a “longer” MA from below to above, which may be a confirmation of the changes of the bearish trend for the bullish trend, and also the death cross – a crossover from above to below, thereby confirming the change of the bullish trend for the bearish one.
Related Articles
Team that worked on the article
Mikhail Vnuchkov joined Traders Union as an author in 2020. He began his professional career as a journalist-observer at a small online financial publication, where he covered global economic events and discussed their impact on the segment of financial investment, including investor income. With five years of experience in finance, Mikhail joined Traders Union team, where he is in charge of forming the pool of latest news for traders, who trade stocks, cryptocurrencies, Forex instruments and fixed income.
Chinmay Soni is a financial analyst with more than 5 years of experience in working with stocks, Forex, derivatives, and other assets. As a founder of a boutique research firm and an active researcher, he covers various industries and fields, providing insights backed by statistical data. He is also an educator in the field of finance and technology.
As an author for Traders Union, he contributes his deep analytical insights on various topics, taking into account various aspects.
Mirjan Hipolito is a journalist and news editor at Traders Union. She is an expert crypto writer with five years of experience in the financial markets. Her specialties are daily market news, price predictions, and Initial Coin Offerings (ICO).
Day trading involves buying and selling financial assets within the same trading day, with the goal of profiting from short-term price fluctuations, and positions are typically not held overnight.
Uptrend is a market condition in which prices are generally rising. Uptrends can be identified by using moving averages, trendlines, and support and resistance levels.
Cryptocurrency is a type of digital or virtual currency that relies on cryptography for security. Unlike traditional currencies issued by governments (fiat currencies), cryptocurrencies operate on decentralized networks, typically based on blockchain technology.
Forex leverage is a tool enabling traders to control larger positions with a relatively small amount of capital, amplifying potential profits and losses based on the chosen leverage ratio.
Index in trading is the measure of the performance of a group of stocks, which can include the assets and securities in it.


-
 Afghanistan
-
 Albania
-
 Algeria
-
 Argentina
-
 Armenia
-
 Australia
-
 Austria
-
 Azerbaijan
-
 Bahamas
-
 Bahrain
-
 Bangladesh
-
 Belgium
-
 Botswana
-
 Brazil
-
 Brunei
-
 Bulgaria
-
 Burma
Burma
-
 Cambodia
-
 Cameroon
-
 Canada
-
 Chile
Chile
-
 China
China
-
 Colombia
-
 Costa Rica
-
 Cote d'Ivoire
-
 Croatia
-
 Cyprus
-
 Czech Republic
-
 Denmark
-
 Dominican Republic
-
 Ecuador
-
 Egypt
Egypt
-
 Estonia
-
 Eswatini
-
 Ethiopia
-
 Finland
-
 France
-
 Georgia
-
 Germany
-
 Ghana
Ghana
-
 Greece
-
 Haiti
Haiti
-
 Hong Kong
-
 Hungary
-
 India
India
-
 Indonesia
-
 Iran, Islamic republic
-
 Iraq
Iraq
-
 Ireland
-
 Israel
-
 Italy
Italy
-
 Jamaica
-
 Japan
Japan
-
 Jordan
-
 Kazakhstan
-
 Kenya
Kenya
-
 Korea
Korea
-
 Kuwait
-
 Kyrgyzstan
-
 Laos
Laos
-
 Latvia
-
 Lebanon
-
 Libyan Arab Jamahiriya
-
 Lithuania
-
 Luxembourg
-
 Macedonia
-
 Madagascar
-
 Malaysia
-
 Malta
Malta
-
 Mauritius
-
 Mexico
-
 Moldova
-
 Mongolia
-
 Montenegro
-
 Morocco
-
 Mozambique
-
 Namibia
-
 Nepal
Nepal
-
 Netherlands
-
 Nigeria
-
 Norway
-
 Oman
Oman
-
 Pakistan
-
 Palestine
-
 Papua New Guinea
-
 Peru
Peru
-
 Philippines
-
 Poland
-
 Portugal
-
 Puerto Rico
-
 Qatar
Qatar
-
 Romania
-
 Rwanda
-
 Saudi Arabia
-
 Serbia
-
 Singapore
-
 Slovakia
-
 Slovenia
-
 Somalia
-
 South Africa
-
 Spain
Spain
-
 Sri Lanka
-
 Sweden
-
 Switzerland
-
 Syrian Arab Republic
-
 Taiwan
-
 Tajikistan
-
 Tanzania, United Republic Of
-
 Thailand
-
 Trinidad and Tobago
-
 Tunisia
-
 Turkey
-
 UAE
UAE
-
 Uganda
-
 Ukraine
-
 United Kingdom
-
United States
-
 Uzbekistan
-
 Venezuela
-
 Vietnam
-
 Yemen
Yemen
-
 Zambia
-
 Zimbabwe
- Forex
- Crypto
