Best RSI Settings For Swing Trading


Editorial Note: While we adhere to strict Editorial Integrity, this post may contain references to products from our partners. Here's an explanation for How We Make Money. None of the data and information on this webpage constitutes investment advice according to our Disclaimer.
The best RSI settings for swing trading are:
Momentum Trading (period 9-12, 1-hour to daily charts): target trades lasting several days to weeks.
Range Trading (period 14-25, 1-hour charts): focuses on multi-day consolidations typical in swing trading.
Breakout Trading (10-14, 1-hour to 4-hour charts): captures market trends early for multi-day runs.
Reversal Trading (period 14-20, 1-hour to 4-hour charts): identifies significant turning points, common in swing setups.
Swing trading is a widely practiced short-term trading strategy focusing on capitalizing on price swings in the market. This approach involves holding positions for several days to weeks, allowing traders to profit from brief price movements. One of the most effective tools for swing traders is the Relative Strength Index (RSI). In this article, we will take a look at the best RSI settings for swing trading and learn about other important tweaks that can help up your swing trading game.
Best RSI settings for swing trading
The Relative Strength Index (RSI) is a key indicator in swing trading, offering insights into price momentum, overbought, and oversold market conditions. While the standard RSI setting of 14 periods works well in many situations, experienced traders often adjust settings to align with specific trading styles.
| Swing trading type | Period | Timeframe | Best asset types |
|---|---|---|---|
| Momentum Swing Trading | 9-12 | 1-hour to daily charts | Growth stocks, trending Forex pairs, and commodities |
| Range-Bound Swing Trading | 14-25 | 1-hour charts | Blue-chip stocks, index funds, and stable Forex pairs |
| Breakout Swing Trading | 10-14 | 1-hour to 4-hours charts | Stocks near earnings releases, cryptocurrencies, and Forex pairs before key news events. |
| Reversal Swing Trading | 14-20 | 1-hour to 4-hour charts | Volatile stocks, commodities, and indices in corrective phases. |
Momentum swing trading (period: 9-12 | timeframe: 1-hour to daily charts)
This setting captures early entry points during strong trends. Look for RSI crossing above 50 for bullish momentum or below 50 for bearish momentum. This setting is designed to capture trades that last several days to weeks, aligning well with swing trading objectives. A shorter RSI period increases sensitivity to price movements, aiding in the early identification of emerging trends.
Range-bound swing trading (period: 14-25 | timeframe: 1-hour charts)
In range-bound trading, the RSI identifies overbought and oversold zones within horizontal price channels. Values above 70-80 suggest selling near resistance, while readings below 30-20 signal buying near support. This approach works best in stable markets with clear price boundaries, minimizing false breakouts and improving trade precision.
Breakout swing trading (period: 10-14 | timeframe: 1-hour to 4-hour charts)
Breakout traders use the RSI to spot market momentum surges after consolidations. Readings above 60-70 suggest potential upward breakouts, while dips below 40-30 warn of downward breakouts. Volume spikes confirm breakout strength. This strategy targets multi-day rallies in volatile assets like stocks before earnings or major economic announcements.
Reversal swing trading (period: 14-20 | timeframe: 1-hour to 4-hour charts)
Reversal trading focuses on price extremes using RSI divergence. Bullish reversals occur when prices hit lower lows while RSI forms higher lows. Bearish reversals happen when prices hit higher highs as RSI creates lower highs. This strategy helps traders catch major turning points in volatile markets like stocks and indices.
Dynamic RSI settings for swing trading
The default RSI setting of 14 periods works well, but traders can adjust it for better performance based on their trading style:
Short-term swing trading. Use an RSI period of 7-9 for faster signals.
Long-term swing trading. Use RSI periods of 21-25 for smoother, more reliable signals.
Advanced tip: use multiple RSI settings on the same chart for layered analysis, such as combining RSI (9) and RSI (14).
Basic RSI settings
As a momentum oscillator, RSI evaluates the speed and magnitude of recent price movements. It operates on a scale of 0 to 100, providing a snapshot of an asset's momentum. Traditionally, values above 70 signify an overbought condition, suggesting that the asset might be overvalued and could experience a price correction. Conversely, values below 30 indicate oversold conditions, implying a potential price rebound. Understanding its basic settings can significantly enhance swing trading decisions.
Standard RSI settings:
Period: 14 (default)
Overbought Level: 70
Oversold Level: 30
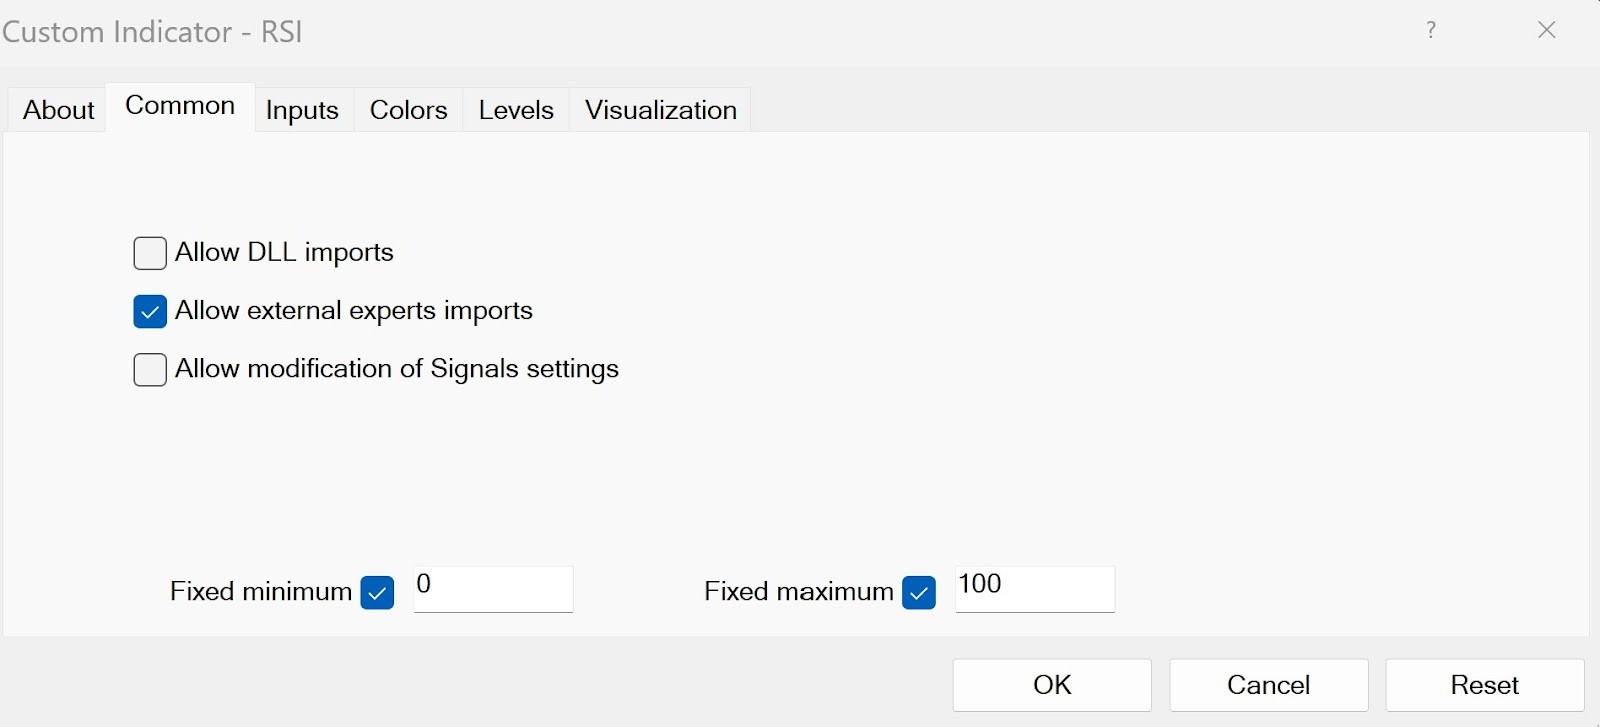
Fixed minimum: 0
Fixed maximum: 100
The RSI indicator's inventor, J. Welles Wilder, suggested these default settings. Here’s how they function:
RSI above 70: Indicates the asset may be overbought and a price correction could follow.
RSI below 30: Suggests the asset may be oversold, signaling a potential price rebound.
What are the best swing trading brokers?
We have compared the best swing trading brokers out there. They provide ideal conditions for swing trading and can help improve the trading experience of beginners and experienced traders alike:
| Demo | Min. deposit, $ | Min Spread EUR/USD, pips | Max Spread EUR/USD, pips | Deposit fee, % | Withdrawal fee, % | Max. Regulation Level | TU overall score | Open an account | |
|---|---|---|---|---|---|---|---|---|---|
| Yes | 100 | 0,5 | 0,9 | No | No | Tier-1 | 6.83 | Open an account Your capital is at risk. |
|
| Yes | No | 0,5 | 1,5 | No | No | Tier-1 | 7.17 | Open an account Your capital is at risk.
|
|
| Yes | No | 0,1 | 0,5 | No | No | Tier-1 | 6.8 | Open an account Your capital is at risk. |
|
| Yes | 100 | 0,7 | 1,2 | No | No | Tier-1 | 6.95 | Study review | |
| Yes | No | 0,2 | 0,8 | No | Yes | Tier-1 | 6.9 | Open an account Your capital is at risk. |
Mastering the RSI indicator: How to use for swing trading
Understanding how RSI is calculated enhances its interpretation. The calculation involves three key steps:
1. Calculate average gain and average loss.
The standard RSI period is 14 days (or candles).
Average gain = (sum of gains over 14 periods) / 14
Average loss = (sum of losses over 14 periods) / 14
2. Determine the relative strength (RS).
RS = average gain / average loss
3. Calculate the RSI using the formula.
RSI = 100 – (100 / (1 + RS))
This calculation generates values between 0 and 100, and you can use it to:
Identify overbought and oversold conditions
Identify overbought:
RSI above 70 signals that the asset may be overbought and due for a price correction.
Traders consider selling or shorting positions when the RSI enters this zone.
Identify oversold:
RSI below 30 indicates oversold conditions, suggesting a potential price rebound.
Traders may look for long (buy) positions when the RSI is in this range.
Expert tip: Adjust these thresholds to 80/20 during strong trends to reduce false signals.
Confirming RSI signals with other indicators
Combining RSI with other indicators ensures higher accuracy.
Moving Averages (MA): they can help confirm RSI signals. Use a moving average crossover system, where a shorter moving average (like 10-day) moves above a longer one (like 50-day), to show bullish momentum. If RSI gives a bullish signal and the price is above the moving averages, it’s a stronger sign. This cuts out weaker RSI signals during flat or down markets.
Bollinger Bands: they make RSI signals easier to time. When RSI hits overbought or oversold levels and the price touches or gets close to the outer band, it shows a stronger chance of success. For example, if RSI drops into the oversold zone near the lower band, it’s likely a good time to look for a reversal. This keeps you from entering too early or too late.
Volume indicators: they show how strong an RSI breakout is. When RSI breaks above 70 or below 30, a spike in volume means more traders are backing the move. For example, rising volume during a bullish RSI breakout points to solid bullish momentum. This makes volume a reliable way to double-check RSI signals before entering a trade.
Stochastic oscillator: pairing RSI with the stochastic oscillator helps confirm overbought or oversold conditions with greater precision. If RSI shows an oversold level, but the stochastic oscillator also dips below 20 and crosses upwards, it strengthens the buy signal. This dual confirmation filters out false signals and ensures momentum is aligning with your trade.
Ichimoku cloud: RSI signals are most reliable when they align with the broader trend. Use the Ichimoku cloud to confirm the trend direction. For example, if RSI shows an oversold signal, ensure the price is above the cloud for a bullish bias.
Spot trend reversals using divergence
RSI divergence is a powerful signal that can anticipate trend reversals. This occurs when the price moves in the opposite direction of the RSI.
Note: Use divergence in combination with support and resistance levels for stronger trade signals. Aligning RSI signals with key support and resistance levels strengthens trade reliability.
Consider the following:
Buying at support:
Look for RSI readings below 30 near major support zones.
Enter a long position when the RSI rebounds.
Selling at resistance:
Watch for RSI readings above 70 near resistance levels.
Initiate short positions if the RSI declines afterward.
Best settings for RSI divergence trading
Choosing the right RSI settings is crucial for accurate divergence detection, helping traders anticipate profitable swing trading opportunities while minimizing false signals.
Standard setting (14). The default RSI setting of 14 provides a balanced view of price momentum and works well across most timeframes. It is the best classic bullish and bearish divergences on daily or 4-hour charts.
Short-term setting (5-7). It reacts quickly to price changes, spotting early divergences, and it is best for scalping or short-term trades on 5-15 minute charts.
Medium-term setting (9-12). Reduces noise while remaining responsive to trend reversals. It is best for swing trading on 1-hour to 4-hour charts.
Long-term setting (20-25). It filters out short-term fluctuations, detecting only strong divergences. It is best for long-term trading on daily or weekly charts.
Risk management with RSI trading
Even with strong RSI signals, proper risk management is critical for successful swing trading. Here’s what you should keep in mind:
Adjust stop-loss levels based on RSI thresholds. Base your stop-loss on RSI levels instead of a fixed amount. For example, if you enter on an RSI oversold signal below 30, place your stop just below the previous low. Adjust it as RSI moves back above 40 to keep your risk lower.
Use RSI divergence to scale your position. If you notice RSI divergence (like price making a lower low but RSI making a higher low), begin with a smaller trade size. Add more to your position only after the price breaks a key resistance, keeping your risk under control while waiting for a clear setup.
Apply dynamic position sizing with RSI zones. Size your trades based on RSI zones. Use smaller trades when RSI is near 50, as momentum isn’t clear. Increase your position size when RSI approaches extreme levels, like above 70 or below 30, and other signals confirm the move.
Avoid overtrading during RSI mid-zone signals. Don’t trade based on RSI signals in the 40-60 range, as they often show market indecision. Trade only when RSI shows strong overbought or oversold signals for better reliability.
How to combine RSI and moving averages for accurate swing trading signals
RSI identifies momentum shifts, while MAs confirm the trend direction, helping traders filter out false signals and make better decisions. The combination of moving averages and RSI in the above image makes it easy to see market trends and signals.
MA downtrend (Bearish phase).
The price stays below the moving average, confirming a downtrend.
RSI Validation: The RSI dips near the oversold zone, generating a Valid Sell Signal (late October).
False RSI signal (Early October).
Although RSI showed oversold conditions, the moving average remained bearish.
This disconnect resulted in a false signal, highlighting the importance of combining RSI with the trend direction from MAs.
Neutral phase (Late November).
The moving average flattens, showing a sideways market.
RSI Confirmation: RSI hovers near 50, indicating weak momentum and a neutral signal.
Valid buy signal (Late September).
RSI reached oversold levels and rebounded, aligning with the price and moving toward the moving average.
For quick swings, use M15 or M30 if you can monitor the market regularly, or use 1H or 4H for better trend signals and fewer false alarms for classic swings. The 4H timeframe is the most recommended for swing trading because it balances trading frequency, reliability, and reduced market noise.
Refined RSI settings with ATR for precise swing trading signals

When it comes to swing trading, changing RSI settings can make your signals more reliable. Try a 20-period RSI to smooth out signals and focus on medium-term trends. This setting cuts out noise from quick price changes, helping you track broader market moves. Pair this with custom overbought and oversold levels of 80 and 20 to spot extreme price levels that match longer-term market moves. This setup helps you avoid false signals and improves your chances of catching strong reversals.
You can also combine RSI with Average True Range (ATR) for even better results. Use a 10-period RSI for quicker signals and filter them with ATR to account for market volatility. For instance, only trade RSI oversold signals during high ATR periods to increase your chances of success. Skip signals when ATR is low to avoid stagnant or slow markets. These changes help you time trades better and avoid common mistakes in swing trading.
Conclusion
The best RSI settings for swing trading depend on your trading style, time frame, and asset type. While the standard RSI setting of 14 works well for most traders, adjusting it to shorter periods like 9-12 enhances responsiveness in fast-moving markets. Use longer periods like 20-25 for smoother signals in long-term trades. Combine RSI with indicators like moving averages and Bollinger Bands for better trade confirmation.
FAQs
What is the best RSI setting for swing trading?
The best RSI settings for swing trading are 9-12 periods for momentum trading and 14-25 periods for range-bound or long-term trades. Adjust based on your trading time frame and market conditions.
How do I set the RSI indicator for swing trading?
Set the RSI period to 9-12 for short-term trades and 14-25 for long-term swing trades. Use overbought and oversold levels of 70/30, or adjust to 80/20 in strong trends to avoid false signals.
Can I use the default RSI setting for swing trading?
Yes, the default setting of 14 works well for general swing trading. However, adjusting the RSI period offers greater flexibility, especially when trading volatile assets or applying specific trading strategies.
How do I use RSI with other indicators for swing trading?
Combine RSI with moving averages to confirm trend direction or Bollinger Bands for spotting overbought/oversold conditions. Use volume indicators to confirm the strength of RSI-based breakouts or reversals. This multi-indicator approach boosts accuracy and reduces false signals.
Related Articles
Team that worked on the article
Peter Emmanuel Chijioke is a professional personal finance, Forex, crypto, blockchain, NFT, and Web3 writer and a contributor to the Traders Union website. As a computer science graduate with a robust background in programming, machine learning, and blockchain technology, he possesses a comprehensive understanding of software, technologies, cryptocurrency, and Forex trading.
Having skills in blockchain technology and over 7 years of experience in crafting technical articles on trading, software, and personal finance, he brings a unique blend of theoretical knowledge and practical expertise to the table. His skill set encompasses a diverse range of personal finance technologies and industries, making him a valuable asset to any team or project focused on innovative solutions, personal finance, and investing technologies.
Chinmay Soni is a financial analyst with more than 5 years of experience in working with stocks, Forex, derivatives, and other assets. As a founder of a boutique research firm and an active researcher, he covers various industries and fields, providing insights backed by statistical data. He is also an educator in the field of finance and technology.
As an author for Traders Union, he contributes his deep analytical insights on various topics, taking into account various aspects.
Mirjan Hipolito is a journalist and news editor at Traders Union. She is an expert crypto writer with five years of experience in the financial markets. Her specialties are daily market news, price predictions, and Initial Coin Offerings (ICO).
Day trading involves buying and selling financial assets within the same trading day, with the goal of profiting from short-term price fluctuations, and positions are typically not held overnight.
Volatility refers to the degree of variation or fluctuation in the price or value of a financial asset, such as stocks, bonds, or cryptocurrencies, over a period of time. Higher volatility indicates that an asset's price is experiencing more significant and rapid price swings, while lower volatility suggests relatively stable and gradual price movements.
Ranging markets are a type of market characterized by short-term movement between apparent asset price highs and lows.
Swing trading is a trading strategy that involves holding positions in financial assets, such as stocks or forex, for several days to weeks, aiming to profit from short- to medium-term price swings or "swings" in the market. Swing traders typically use technical and fundamental analysis to identify potential entry and exit points.
A long position in Forex, represents a positive outlook on the future value of a currency pair. When a trader assumes a long position, they are essentially placing a bet that the base currency in the pair will appreciate in value compared to the quote currency.


-
 Afghanistan
-
 Albania
-
 Algeria
-
 Argentina
-
 Armenia
-
 Australia
-
 Austria
-
 Azerbaijan
-
 Bahamas
-
 Bahrain
-
 Bangladesh
-
 Belgium
-
 Botswana
-
 Brazil
-
 Brunei
-
 Bulgaria
-
 Burma
Burma
-
 Cambodia
-
 Cameroon
-
 Canada
-
 Chile
Chile
-
 China
China
-
 Colombia
-
 Costa Rica
-
 Cote d'Ivoire
-
 Croatia
-
 Cyprus
-
 Czech Republic
-
 Denmark
-
 Dominican Republic
-
 Ecuador
-
 Egypt
Egypt
-
 Estonia
-
 Eswatini
-
 Ethiopia
-
 Finland
-
 France
-
 Georgia
-
 Germany
-
 Ghana
Ghana
-
 Greece
-
 Haiti
Haiti
-
 Hong Kong
-
 Hungary
-
 India
India
-
 Indonesia
-
 Iran, Islamic republic
-
 Iraq
Iraq
-
 Ireland
-
 Israel
-
 Italy
Italy
-
 Jamaica
-
 Japan
Japan
-
 Jordan
-
 Kazakhstan
-
 Kenya
Kenya
-
 Korea
Korea
-
 Kuwait
-
 Kyrgyzstan
-
 Laos
Laos
-
 Latvia
-
 Lebanon
-
 Libyan Arab Jamahiriya
-
 Lithuania
-
 Luxembourg
-
 Macedonia
-
 Madagascar
-
 Malaysia
-
 Malta
Malta
-
 Mauritius
-
 Mexico
-
 Moldova
-
 Mongolia
-
 Montenegro
-
 Morocco
-
 Mozambique
-
 Namibia
-
 Nepal
Nepal
-
 Netherlands
-
 Nigeria
-
 Norway
-
 Oman
Oman
-
 Pakistan
-
 Palestine
-
 Papua New Guinea
-
 Peru
Peru
-
 Philippines
-
 Poland
-
 Portugal
-
 Puerto Rico
-
 Qatar
Qatar
-
 Romania
-
 Rwanda
-
 Saudi Arabia
-
 Serbia
-
 Singapore
-
 Slovakia
-
 Slovenia
-
 Somalia
-
 South Africa
-
 Spain
Spain
-
 Sri Lanka
-
 Sweden
-
 Switzerland
-
 Syrian Arab Republic
-
 Taiwan
-
 Tajikistan
-
 Tanzania, United Republic Of
-
 Thailand
-
 Trinidad and Tobago
-
 Tunisia
-
 Turkey
-
 UAE
UAE
-
 Uganda
-
 Ukraine
-
 United Kingdom
-
United States
-
 Uzbekistan
-
 Venezuela
-
 Vietnam
-
 Yemen
Yemen
-
 Zambia
-
 Zimbabwe
- Forex
- Crypto
