How to Identify and Trade a Liquidity Grab?


Editorial Note: While we adhere to strict Editorial Integrity, this post may contain references to products from our partners. Here's an explanation for How We Make Money. None of the data and information on this webpage constitutes investment advice according to our Disclaimer.
Liquidity grab strategies and indicators:
- Liquidity Grabs involve Smart Money creating or attracting counter liquidity.
- Techniques include order book manipulation and fake breakouts.
- ICT SM Trades Indicator on TradingView can signal liquidity grabs.
- Liquidation grabs occur when professional traders buy during mass liquidations.
Liquidity is a cornerstone in Forex trading, yet it often presents a complex challenge, particularly for professional traders dealing with substantial volumes. These market players, often referred to as “Smart Money,” face a unique predicament. Their large-scale trades necessitate equivalent counter liquidity, which isn't readily available, leading to significant hurdles in executing their strategies efficiently.
Risk warning: Forex trading carries high risks, with potential losses including your entire deposit. Market fluctuations, economic instability, and geopolitical factors impact outcomes. Studies show that 70-80% of traders lose money. Consult a financial advisor before trading.
What is the meaning of the liquidity grab?
A liquidity grab is a sophisticated strategy employed by professional traders to navigate the challenges of trading large volumes in markets like Forex and cryptocurrency. This tactic revolves around creating or attracting the necessary counter liquidity -the matching volume of opposing orders - essential for executing large trades without significant market impact.
Smart Money uses two primary methods for a liquidity grab:
Manipulation in order books: This serves to artificially inflate demand. This move is not aimed at actual acquisition but to manipulate the perception of other market participants
Fake breakouts: Here, professional traders keenly observe key support levels. When these levels are broken, it typically triggers a wave of sell orders from smaller traders
These liquidity grab strategies highlight the deep strategic planning and market understanding of professional traders. For regular traders, recognizing these tactics is crucial, not only to avoid potential pitfalls but also to develop a more nuanced understanding of market dynamics.
Trick 1. Manipulation in Order Book (DOM)
A technique often referred to as the Depth of Market (DOM) manipulation, this strategy starts with the placement of a conspicuously large buy order.
This order is not intended for execution but serves a more cunning purpose; to create a false impression of high demand for the asset.
The appearance of this large buy order in the order book can significantly influence market perception. It leads smaller traders, often swayed by the apparent increase in demand, to place their own buy orders. This reaction plays right into the hands of Smart Money.
They use the influx of these smaller buy orders as cover to build up a substantial short position. The rationale is simple yet effective. As smaller traders fill the order book with buy orders, Smart Money quietly accumulates a position that bets on the price falling.
Once the desired short position is established, the original large buy order, which was never meant to be executed, is removed from the book. This sudden removal often leads to a market correction. The price, which was artificially inflated by the perceived demand, starts to fall back to its normal levels.
This fall in price benefits the short positions that Smart Money has accumulated, allowing them to capitalize on the price movement they orchestrated.
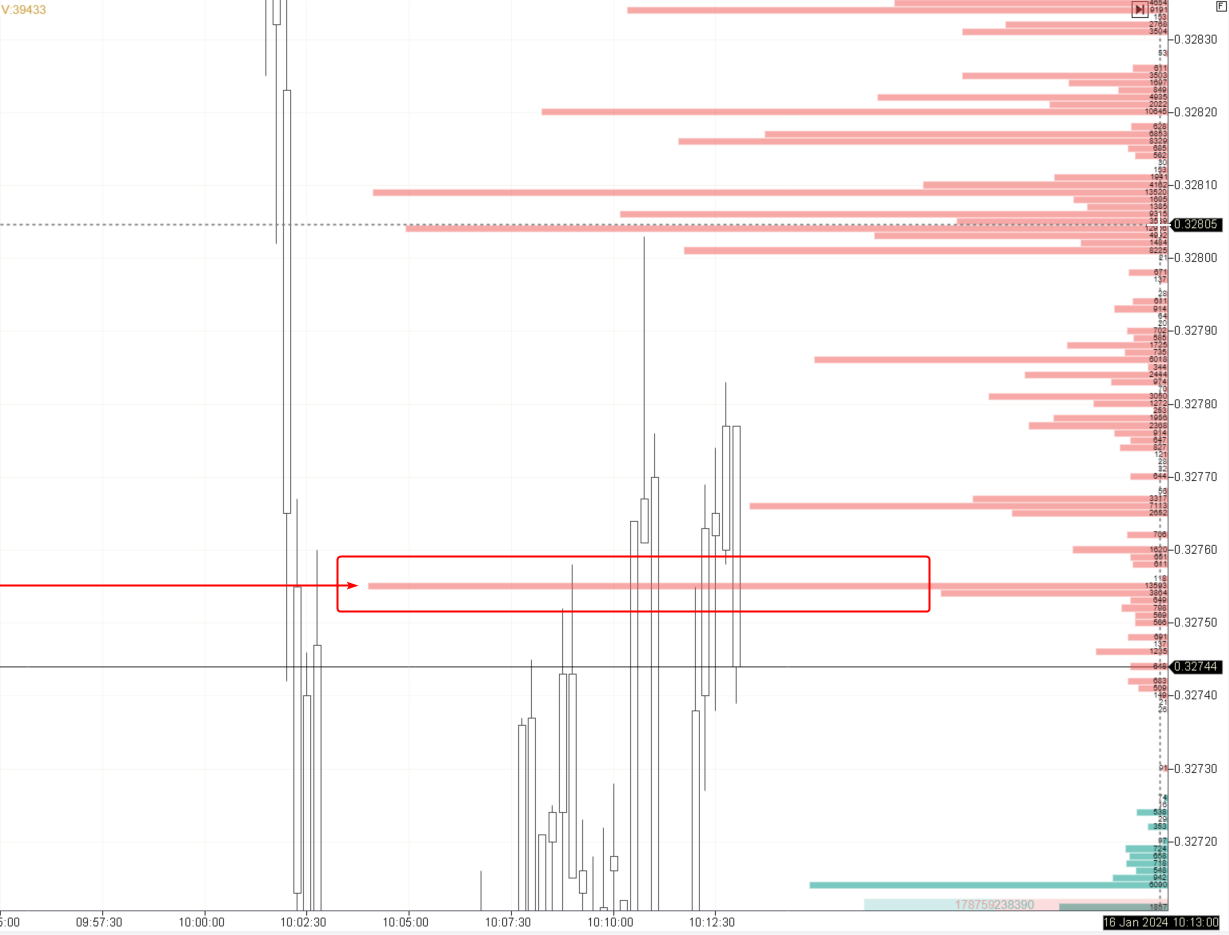 Large sell order near the current price
The example in the picture above (this is a screenshot from the cryptocurrency market) shows a large sell order. Only a professional trader can place a significant volume. In this case, this order can help the professional to motivate other market participants to open short positions and thereby strengthen the current downtrend.
Trick 2. Fake Breakouts
The second trick in the Smart Money playbook is the creation of fake breakouts. This tactic is employed, particularly when Smart Money is bullish on an asset. They closely monitor the asset's price movement, specifically watching for moments when it breaks down through key support levels.
In typical market scenarios, a breakdown of support levels can trigger a flurry of sell orders from smaller traders, as it is often interpreted as a bearish signal. Smart Money utilizes this reaction to their advantage. They position themselves to absorb the sell orders coming in from smaller market participants. This absorption is not random but a calculated move to accumulate long positions at lower prices.
Timing is what makes this strategy particularly effective. The breakdown of support levels creates a momentary panic or a bearish sentiment among less experienced traders. They rush to sell, fearing further price decline. Meanwhile, Smart Money, with a bullish outlook, gathers these sell orders, effectively grabbing the liquidity being shed in the market. This allows them to build their bullish positions discreetly and at more advantageous prices.
Once the market stabilizes or rebounds, which often happens after such temporary breakdowns, the price of the asset starts to climb again. This rise in price benefits the positions accumulated by Smart Money during the fake breakout phase, allowing them to profit from the temporary market turmoil they helped engineer.
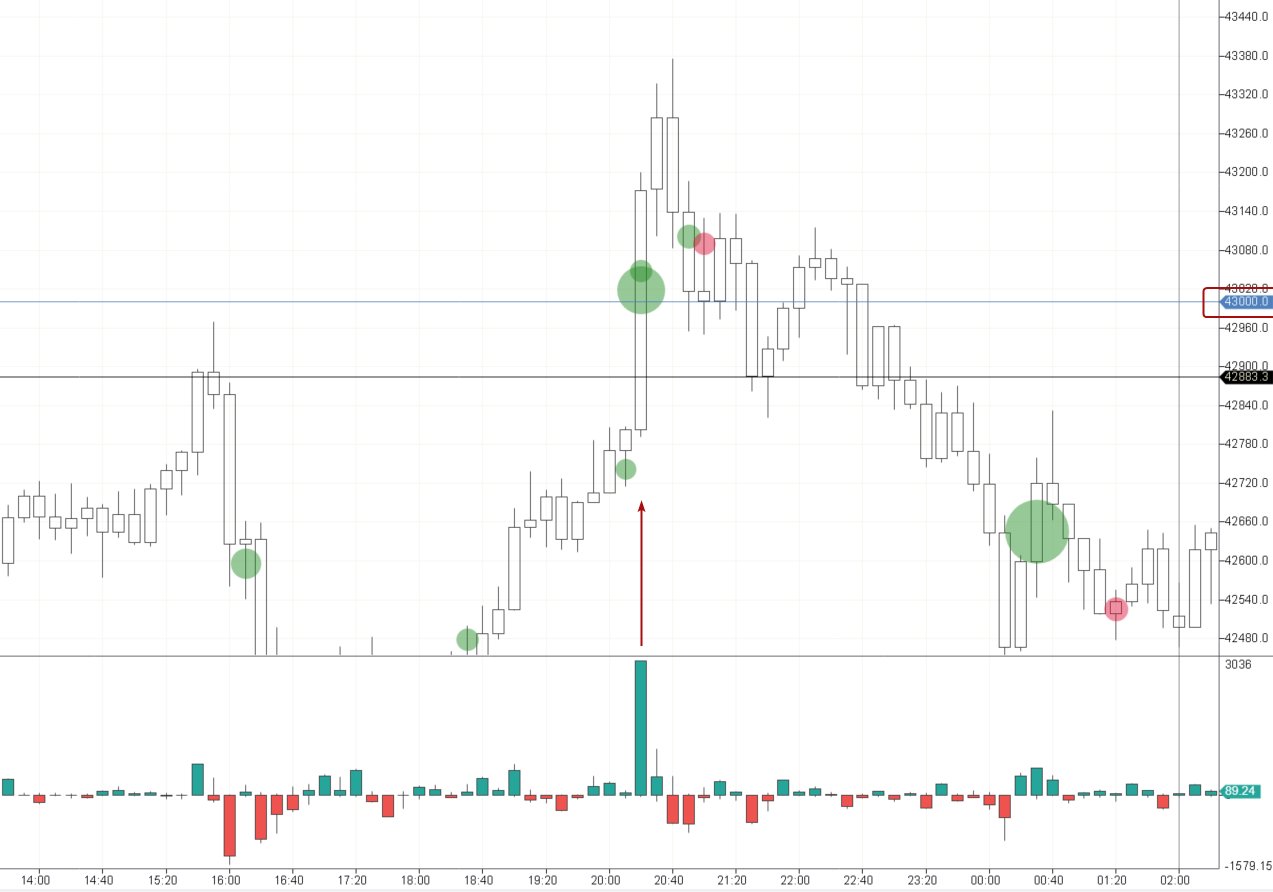 Fake breakout of the resistance
The example above (bitcoin market) shows buying activity on the breakdown of the psychological level of 43 thousand dollars per coin. The smart money can use this activity (and even help it) to fulfill their intentions of forming large short positions.
What is the liquidity grab indicator in Tradingview?
Traders have at their disposal a plethora of tools and indicators to identify market trends and potential trade setups. One of those tools is the liquidity grab indicator, specifically designed to pinpoint the moments when Smart Money executes a liquidity grab.
On Tradingview, a popular charting platform used by traders worldwide, this functionality is encapsulated in an indicator known as the ICT SM Trades Indicator.
The ICT (Inner Circle Trader) SM Trades Indicator is crafted to reveal the subtle movements of Smart Money-those market players who move large volumes and can thus significantly influence price direction. The indicator illuminates areas where these traders are likely entering the market, often at the expense of smaller players.
It is particularly adept at identifying points where liquidity is being 'grabbed', i.e. where large players are likely absorbing the liquidity provided by retail traders' stop-losses or breakout entries.
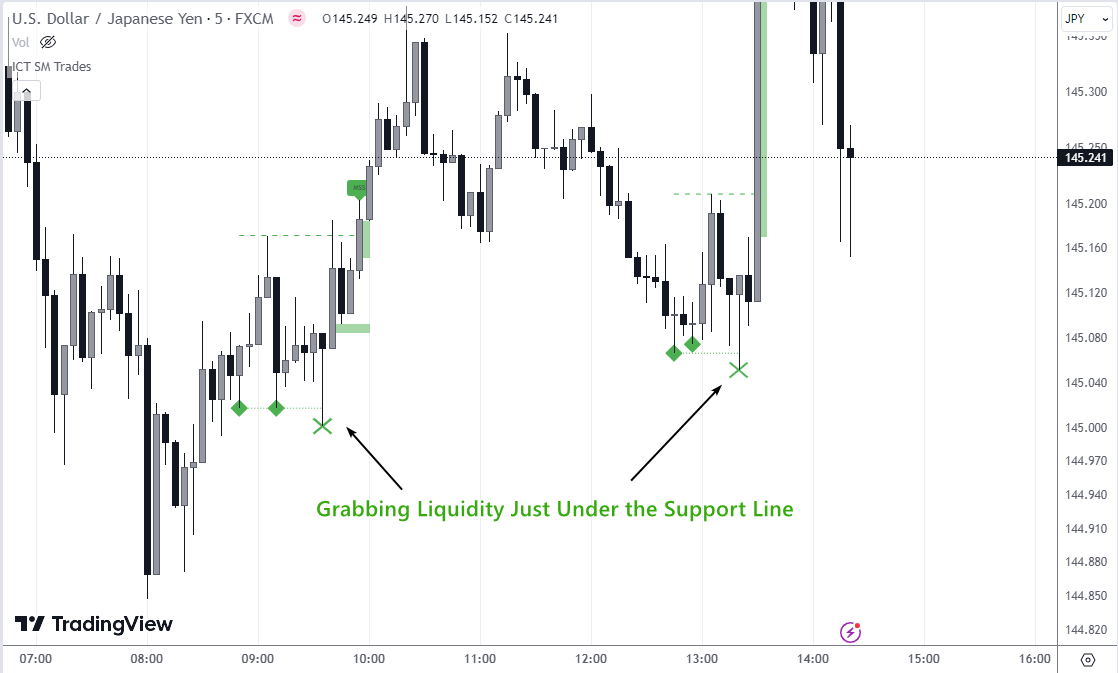 Liquidity grab indicator in Tradingview
The image above showcases the ICT SM Trades Indicator in action on a USD/JPY chart. It highlights specific points with green diamonds where liquidity is suspected to have been grabbed just below a support line. These points are crucial for traders. They often precede a swift reversal as Smart Money has accumulated its desired positions and the market reacts to the sudden shift in supply and demand.
Traders use this indicator to steer clear of being caught in adverse movements initiated by these liquidity grabs and, if skilled enough, to align their trades with the direction of Smart Money.
In fact, TradingView is a very user-friendly platform with many indicators. You can learn more about its useful features in the article: Tradingview Review 2026: Is it Worth Paying for Pro?
Identifying liquidity grabs with indicators like ICT SM Trades is only half the job – executing a responsive trade requires a broker with fast fills, transparent margin rules and the leverage options you plan to use. Below is a compact comparison of reputable brokers that support high-speed execution and high leverage; use it to match your execution needs to a regulated provider.
| Plus500 | OANDA | Trading.com USA | FOREX.com | IG Markets | |
|---|---|---|---|---|---|
|
TradingView |
Yes | Yes | Yes | Yes | Yes |
|
Min. deposit, $ |
100 | No | 50 | 100 | 1 |
|
Max. leverage |
1:300 | 1:200 | 1:50 | 1:50 | 1:200 |
|
Min Spread EUR/USD, pips |
0.5 | 0.1 | 0.9 | 0.7 | 0.6 |
|
Max Spread EUR/USD, pips |
0.9 | 0.5 | No | 1.2 | 1.2 |
|
Open an account |
Go to broker 80% of retail CFD accounts lose money. |
Go to broker Your capital is at risk. |
Go to broker Your capital is at risk. |
Study review | Study review |
What is a liquidation grab?
A liquidation grab is a strategic move in the trading world where professional traders capitalize on the forced closure of positions, commonly seen in leveraged trading environments. This phenomenon occurs when the market price hits a point where leveraged positions, typically those of retail traders, are automatically closed or 'liquidated' due to insufficient margin to support the trade.
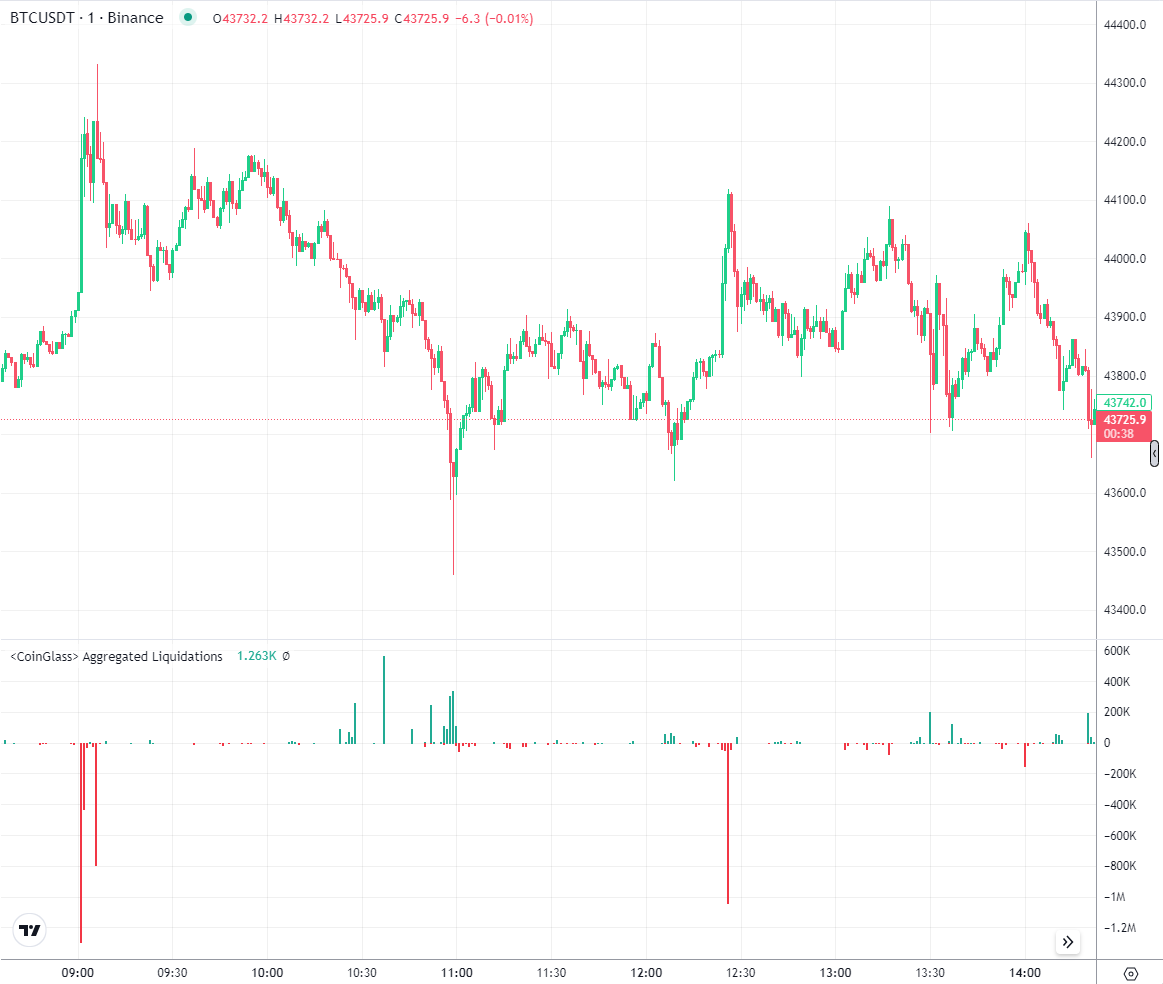 A liquidation grab
The chart demonstrates this concept in the context of Bitcoin trading. It shows a price graph with a sudden downward spike, representing a sharp decline in price, which would trigger a mass liquidation of long positions. Beneath the price chart, a significant spike in the liquidation volume is visible, indicating that a substantial number of buy positions have been forcefully closed.
Smart Money traders wait for these moments of high liquidation. They anticipate that the liquidation of bull positions will push prices down temporarily, allowing them to purchase assets at a lower price.
Once the wave of forced sell-offs subsides, these professional traders, who have increased their long positions through the acquisition of the liquidated assets, stand to gain from the subsequent price recovery. This strategy not only allows them to enhance their long portfolios but also to benefit from the volatility and panic selling caused by the mass liquidations.
Wait for confirmation after a liquidity grab

Based on practical experience, a liquidity grab is not merely a "false breakout", but a deliberate price move into a cluster of stop orders, after which the market often reverses sharply. Such situations typically occur near obvious highs and lows, key support and resistance levels, or ahead of major news releases, when a significant number of pending orders accumulate in the market.
Liquidity grabs can be identified by analyzing market structure. If price impulsively pierces a key level, quickly returns, and consolidates back within the prior range, this often signals that liquidity has been taken. It is important to focus not only on the initial breach but also on the subsequent reaction. The return move and structural confirmation tend to provide a more reliable signal than the breakout itself.
In these setups, it is prudent to avoid entering during the initial impulse and instead wait for confirmation of a reversal or a shift in short-term structure. Strict risk management remains essential, as not every level breach represents a deliberate liquidity grab. At times, the market continues in the direction of the breakout. The ability to distinguish manipulation from a genuine breakout develops through experience and careful contextual analysis.
Conclusion
Understanding liquidity grab strategies in Forex is essential for traders aiming to navigate market volatility with confidence. By recognizing how Smart Money operates—often triggering stop-losses to amass liquidity—investors can position themselves ahead of these calculated moves rather than falling victim. For instance, sudden price wicks that hunt stop orders, or false breakouts, typically signal such institutional tactics. The key is not to react emotionally to these maneuvers but to anticipate and use them to one's advantage. Ultimately, mastering the art of identifying liquidity grabs transforms market traps into profitable opportunities.
FAQs
What are the key warning signals that a liquidity grab may be developing in the Forex market?
How do order book manipulations facilitate liquidity grab strategies in Forex trading?
What is the impact of liquidity grabs on retail traders' positions?
How can technical indicators help identify potential liquidity grabs in Forex trading?
Editors' Top Picks and Insights

U.S. Bitcoin reserve: Trump’s unrealized crypto promise

Aiming for leadership: Payment giants prepare a new stablecoin

Proof of Reserves: the new standard for cryptocurrency exchanges

Three trends that could reshape the crypto market over the next decade

Trump financial disclosure: How the president's crypto income became a U.S. ethics issue
Code red: What's behind Bitcoin’s sharp selloff?
Related Articles
Team that worked on the article
Vuk stands at the forefront of financial journalism, blending over six years of crypto investing experience with profound insights gained from navigating two bull/bear cycles. A dedicated content writer, Vuk has contributed to a myriad of publications and projects.
Dr. BJ Johnson is a PhD in English Language and an editor with over 15 years of experience. He earned his degree in English Language in the U.S and the UK.
Tobi Opeyemi Amure is an editor and expert writer with over 7 years of experience. In 2023, Tobi joined the Traders Union team as an editor and fact checker, making sure to deliver trustworthy and reliable content.
Bitcoin is a decentralized digital cryptocurrency that was created in 2009 by an anonymous individual or group using the pseudonym Satoshi Nakamoto. It operates on a technology called blockchain, which is a distributed ledger that records all transactions across a network of computers.
Volatility refers to the degree of variation or fluctuation in the price or value of a financial asset, such as stocks, bonds, or cryptocurrencies, over a period of time. Higher volatility indicates that an asset's price is experiencing more significant and rapid price swings, while lower volatility suggests relatively stable and gradual price movements.
Forex leverage is a tool enabling traders to control larger positions with a relatively small amount of capital, amplifying potential profits and losses based on the chosen leverage ratio.
Scalping in trading is a strategy where traders aim to make quick, small profits by executing numerous short-term trades within seconds or minutes, capitalizing on minor price fluctuations.
In the Forex market, a “trend” is the label used to describe the general direction that the prices of currency pairs are moving in, over a specific period of time. Trends are basically the pattern that a currency pair appears to be following and can help traders determine when to enter and exit a trade.

-
 Afghanistan
-
 Albania
-
 Algeria
-
 Angola
-
 Argentina
-
 Armenia
-
 Australia
-
 Austria
-
 Azerbaijan
-
 Bahamas
-
 Bahrain
-
 Bangladesh
-
 Belarus
-
 Belgium
-
 Bolivia
-
 Botswana
-
 Brazil
-
 Brunei
-
 Bulgaria
-
 Cambodia
-
 Cameroon
-
 Canada
-
 Chile
Chile
-
 China
China
-
 Colombia
-
 Congo
Congo
-
 Costa Rica
-
 Cote d'Ivoire
-
 Croatia
-
 Cuba
Cuba
-
 Cyprus
-
 Czechia
-
 DR Congo
-
 Denmark
-
 Dominican Republic
-
 Ecuador
-
 Egypt
Egypt
-
 El Salvador
-
 Estonia
-
 Eswatini
-
 Ethiopia
-
 Finland
-
 France
-
 Georgia
-
 Germany
-
 Ghana
Ghana
-
 Greece
-
 Haiti
Haiti
-
 Hong Kong
-
 Hungary
-
 India
India
-
 Indonesia
-
 Iran, Islamic republic
-
 Iraq
Iraq
-
 Ireland
-
 Israel
-
 Italy
Italy
-
 Jamaica
-
 Japan
Japan
-
 Jordan
-
 Kazakhstan
-
 Kenya
Kenya
-
 Korea
Korea
-
 Kuwait
-
 Kyrgyzstan
-
 Laos
Laos
-
 Latvia
-
 Lebanon
-
 Lesotho
-
 Libya
Libya
-
 Lithuania
-
 Luxembourg
-
 Madagascar
-
 Malaysia
-
 Malta
Malta
-
 Mauritius
-
 Mexico
-
 Moldova
-
 Mongolia
-
 Montenegro
-
 Morocco
-
 Mozambique
-
 Myanmar
-
 Namibia
-
 Nepal
Nepal
-
 Netherlands
-
 New Zealand
-
 Nigeria
-
 North Macedonia
-
 Norway
-
 Oman
Oman
-
 Pakistan
-
 Palestine
-
 Panama
-
 Papua New Guinea
-
 Paraguay
-
 Peru
Peru
-
 Philippines
-
 Poland
-
 Portugal
-
 Puerto Rico
-
 Qatar
Qatar
-
 Reunion
-
 Romania
-
 Rwanda
-
 Saudi Arabia
-
 Serbia
-
 Singapore
-
 Slovakia
-
 Slovenia
-
 Somalia
-
 South Africa
-
 Spain
Spain
-
 Sri Lanka
-
 Sweden
-
 Switzerland
-
 Syria
Syria
-
 Taiwan
-
 Tajikistan
-
 Tanzania
-
 Thailand
-
 Trinidad and Tobago
-
 Tunisia
-
 Turkey
-
 UAE
UAE
-
 Uganda
-
 Ukraine
-
 United Kingdom
-
United States
-
 Uruguay
-
 Uzbekistan
-
 Venezuela
-
 Vietnam
-
 Yemen
Yemen
-
 Zambia
-
 Zimbabwe
- Forex
- Crypto
