Best Order Flow Trading Strategies And Indicators


Editorial Note: While we adhere to strict Editorial Integrity, this post may contain references to products from our partners. Here's an explanation for How We Make Money. None of the data and information on this webpage constitutes investment advice according to our Disclaimer.
The best order flow trading strategies and indicators are:
Order flow trading revolves around understanding the dynamics of market transactions. Instead of relying solely on traditional technical indicators or fundamental analysis, this approach dives into real-time market data, focusing on the flow of buy and sell orders. By analyzing these order flows, traders aim to anticipate price movements and make more precise trading decisions. Let’s take a look at the top order flow trading strategies and indicators.
Best order flow trading strategies and indicators
Footprint charts
Footprint charts provide detailed insights into trading activity by showing the executed buy and sell orders at each price level. These charts help in identifying market sentiment and pinpointing areas of high activity.
The simplicity of footprint charts makes them powerful. They focus on executed orders, highlighting critical price levels where significant buying or selling occurs. These areas can serve as important indicators of market sentiment, showing where buyers and sellers are most active.
Types of footprint charts:
Footprint charts are available in several formats, each catering to different trading needs:
Bid/Ask Footprint
Displays the number of market orders executed on the bid and ask sides at each price level.Footprint Profile
A vertical histogram that illustrates traded volume at various price levels, highlighting areas of liquidity.Delta Footprint
Shows the net difference between buy and sell orders at each price level, helping confirm market trends.Volume Footprint
Breaks down traded volume by both price and time, providing insights into market turning points.

Volume-weighted moving average (VWMA)
The VWMA is a technical indicator that calculates the moving average of a price weighted by trading volume. Unlike simple moving averages, the VWMA gives more importance to price levels with higher volume.
Example: If a stock trades:
At $100 with 2,000 shares traded.
At $101 with 1,000 shares traded.
The VWMA will assign more importance to $100 because it has double the trading volume. This makes the VWMA a better reflection of the price levels where real interest lies.
Why use it?
Filters out noise from low-volume movements, focusing on meaningful trends.
Helps identify true price trends influenced by active market participants.

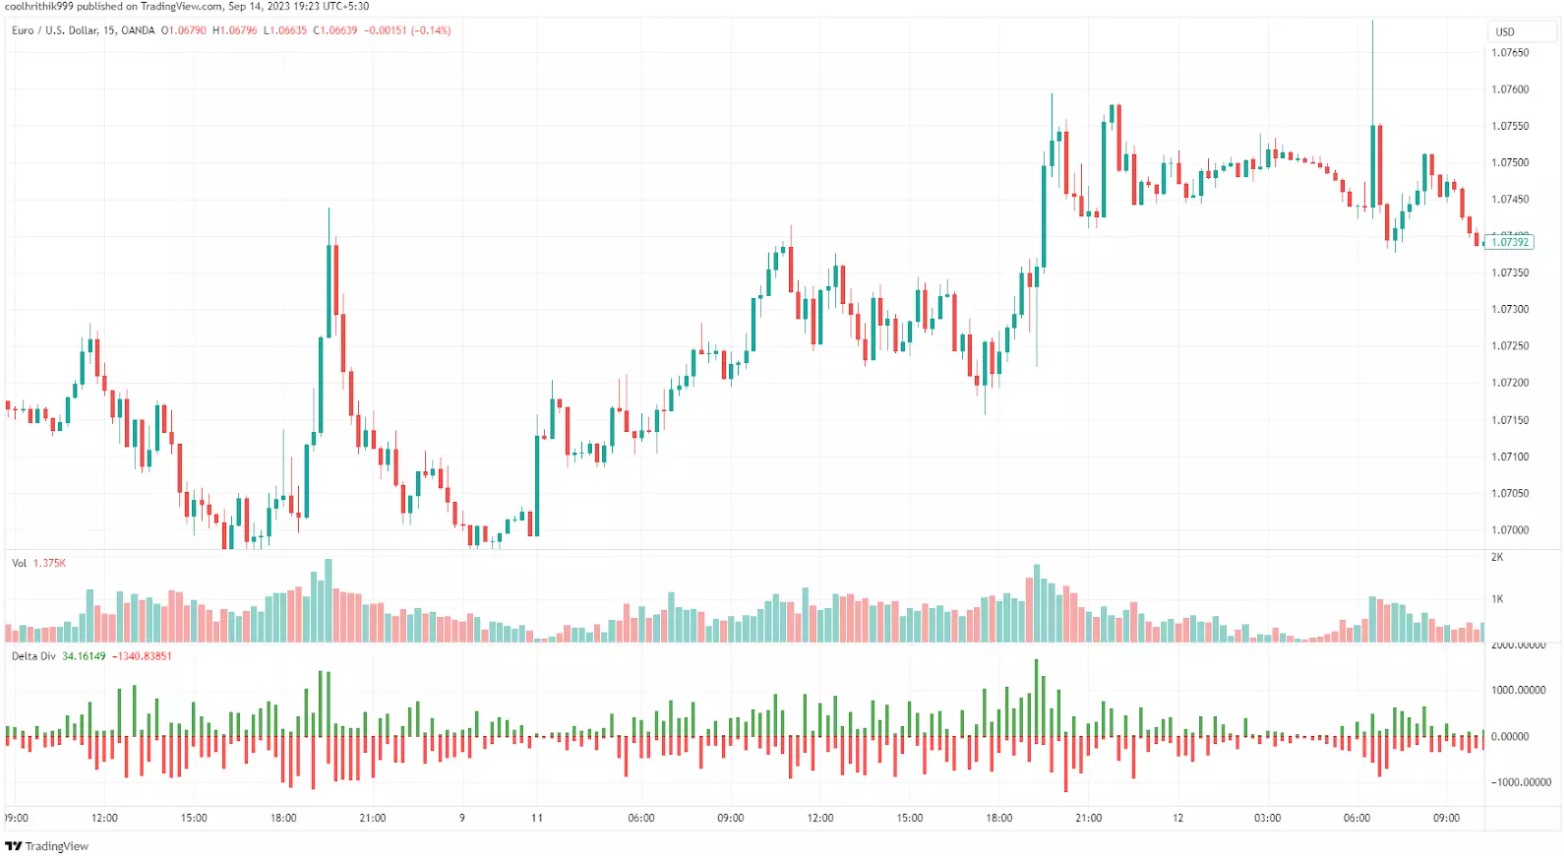
Volume delta
Volume Delta quantifies the net difference between buying and selling activity. It is calculated for each candle on the chart, with values varying based on the selected timeframe.
Positive delta. Indicates buying pressure exceeds selling pressure.
Negative delta. Indicates selling pressure dominates buying pressure.
Near zero delta. Suggests equilibrium, where buying and selling are balanced.
How to use Volume delta in trading:
Spotting potential reversals
By analyzing divergences between price movements and delta values, traders can anticipate changes in direction and adjust their positions accordingly.
Example: If price rises but delta turns negative, it may signal weakening buying pressure, suggesting a potential reversal.Confirming trend continuation
Divergences between price and delta values can also signal the strength of a prevailing trend. A consistent delta movement in the same direction as the price trend indicates robust momentum.
Example: During a price uptrend, if delta remains strongly positive, it confirms buyers’ intent to sustain the trend.
Depth of market (DOM)
DOM, also known as the order book, displays the number of buy and sell orders at various price levels. It helps traders assess market liquidity and potential price movements.
Example:
A DOM shows 1,000 buy orders at $50.00 and 800 sell orders at $51.00. This imbalance suggests upward price pressure as buyers dominate.
Practical use:
Scalpers use DOM to identify short-term trading opportunities, while swing traders use it to detect key support and resistance levels.

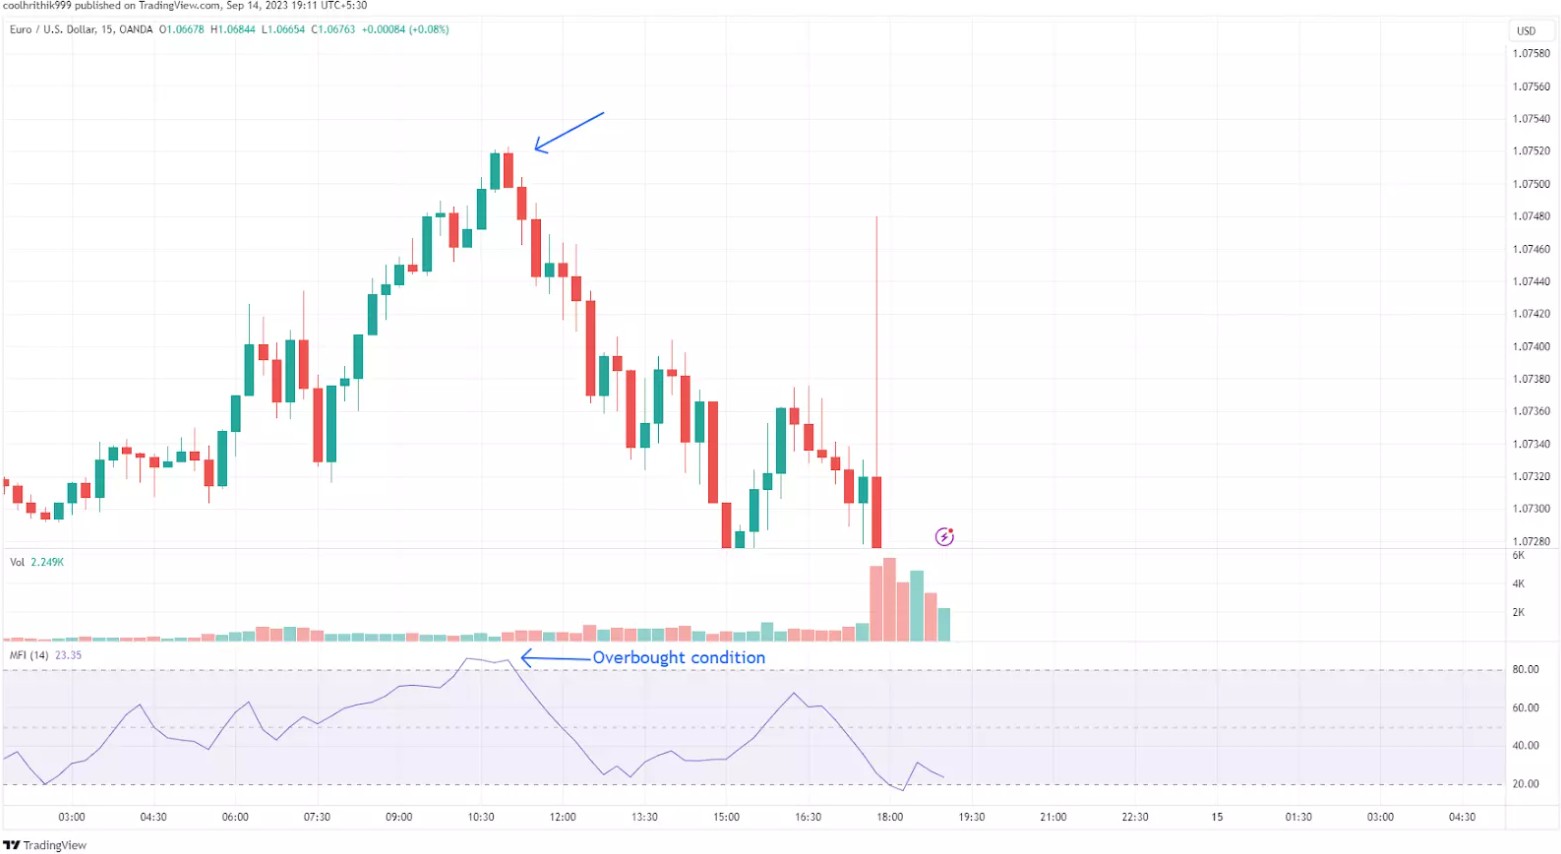
Money flow index (MFI)
The MFI is a volume-weighted oscillator that measures the inflow and outflow of money in an asset. It ranges from 0 to 100, with readings above 80 indicating overbought conditions and below 20 signaling oversold levels.
Example:
If the MFI rises above 80, it suggests the asset is overbought, potentially signaling a price correction.
Practical use:
Traders use the MFI to confirm trends or identify divergence. For example, if the MFI decreases while the price increases, it may indicate weakening momentum.
Volume-Weighted Average Price (VWAP)
VWAP calculates the average price of an asset over a specific period, weighted by volume. It acts as a benchmark for assessing whether the price is trading at a premium or discount.
Example:
If a stock’s VWAP is $100 and the current price is $102, it indicates the stock is trading above its average value, suggesting overvaluation.
Practical use:
Day traders often use VWAP as a guide for entry and exit points. For instance, buying when the price is below VWAP and selling above it can align with bullish setups.

Key elements of order flow trading
To effectively implement order flow trading, it’s crucial to understand its foundational components:
Order books. An order book provides a snapshot of all pending buy and sell orders in the market. By analyzing this data, traders can identify potential support and resistance zones based on clusters of large orders.
Order flow charts. These charts display executed buy and sell orders at different price levels, offering a detailed view of market activity. They allow traders to pinpoint where significant buying or selling pressure exists.
Supply and demand imbalances. Order flow trading thrives on detecting discrepancies between buying and selling volumes. Such imbalances often hint at upcoming price trends or reversals.
How to get started with order flow trading
To start using order flow trading, follow these steps:
Choose a reliable platform. Select a trading platform that provides comprehensive order flow tools like DOM, footprint charts, and volume analysis.
| Daily volume, $ bn | Demo | Min. deposit, $ | Min Spread EUR/USD, pips | Max Spread EUR/USD, pips | Max. Regulation Level | Open an account | |
|---|---|---|---|---|---|---|---|
| No | Yes | 100 | 0,5 | 0,9 | Tier-1 | Open an account Your capital is at risk. |
|
| 8,04 | Yes | No | 0,5 | 1,5 | Tier-1 | Open an account Your capital is at risk.
|
|
| 12,84 | Yes | No | 0,1 | 0,5 | Tier-1 | Open an account Your capital is at risk. |
|
| 18,6 | Yes | 100 | 0,7 | 1,2 | Tier-1 | Study review | |
| 4,3 | Yes | No | 0,2 | 0,8 | Tier-1 | Open an account Your capital is at risk. |
Learn the basics. Understand the key concepts, such as supply and demand dynamics, order books, and how to interpret volume data.
Practice with a demo account. Before trading with real money, use a demo account to familiarize yourself with order flow tools and refine your strategy.
Develop a trading plan. Define your goals, risk tolerance, and specific conditions for entering or exiting trades based on order flow data.
Stay informed. Continuously monitor market news and updates that could impact order flows and price movements.
Pros and cons of order flow analysis
- Pros:
- Cons:
Real-time insights. Provides immediate access to current market activity, enabling quick decision-making.
Enhanced precision. Allows traders to identify potential reversals or breakout points based on actual market orders.
Transparency. Offers a clear picture of market dynamics, such as supply and demand imbalances.
Scalability. Works for various markets, including Forex, stocks, and cryptocurrencies.
Institutional edge. Helps traders understand the behavior of large players in the market.
Customizable tools. Many platforms offer tailored indicators to meet the needs of different trading styles.
Complexity. Requires an in-depth understanding of market microstructure and order data.
High costs. Advanced order flow tools and platforms can be expensive, limiting access for small traders.
Time-intensive. Demands constant monitoring of the market for effective results.
Steep learning curve. Beginners may find it challenging to interpret the data accurately.
Limited data on some markets. Certain markets, like smaller cryptocurrencies, may lack reliable order flow data.
Risks and warnings
Market manipulation. Order flow data can be misleading due to spoofing or fake orders placed to influence market perception.
Over-reliance on tools. Solely relying on order flow without considering broader market trends or fundamentals can result in poor decisions.
High volatility. Rapid price changes can make it difficult to act on order flow data in time, especially during news events.
Platform dependence. Some platforms may not provide accurate or comprehensive data, leading to incorrect analysis.
Never rely on a single indicator

As a trader, always prioritize consistency and discipline over chasing quick profits. Focus on mastering one strategy that aligns with your risk tolerance, and don’t overlook the importance of a demo account to refine your skills in a risk-free environment.
Use tools like Volume delta and footprint charts to understand market sentiment, but never rely on a single indicator — combine it with price action analysis for more accurate decisions. Most importantly, keep a trading journal to track your progress and learn from both successes and mistakes.
Conclusion
Order flow trading provides a unique approach to understanding market behavior by focusing on the interactions between buyers and sellers. With the right tools and knowledge, this strategy can offer traders a significant edge in predicting price movements and making informed decisions. However, it requires dedication, practice, and access to quality data to master.
FAQs
Can I use order flow trading without expensive platforms?
Yes, some platforms offer basic order flow tools for free or at a low cost, but advanced features may require a subscription.
How do I identify fake or spoof orders in the order book?
Watch for large orders that frequently appear and disappear without being filled; this behavior often indicates spoofing.
Can I combine order flow trading with other strategies?
Yes, many traders use order flow analysis alongside technical or fundamental strategies to strengthen their decisions.
Is order flow trading suitable for beginners?
It can be challenging for beginners due to its complexity, but with practice and education, it’s possible to master.
Related Articles
Team that worked on the article
Mikhail Vnuchkov joined Traders Union as an author in 2020. He began his professional career as a journalist-observer at a small online financial publication, where he covered global economic events and discussed their impact on the segment of financial investment, including investor income. With five years of experience in finance, Mikhail joined Traders Union team, where he is in charge of forming the pool of latest news for traders, who trade stocks, cryptocurrencies, Forex instruments and fixed income.
Chinmay Soni is a financial analyst with more than 5 years of experience in working with stocks, Forex, derivatives, and other assets. As a founder of a boutique research firm and an active researcher, he covers various industries and fields, providing insights backed by statistical data. He is also an educator in the field of finance and technology.
As an author for Traders Union, he contributes his deep analytical insights on various topics, taking into account various aspects.
Mirjan Hipolito is a journalist and news editor at Traders Union. She is an expert crypto writer with five years of experience in the financial markets. Her specialties are daily market news, price predictions, and Initial Coin Offerings (ICO).
Index in trading is the measure of the performance of a group of stocks, which can include the assets and securities in it.
Fundamental analysis is a method or tool that investors use that seeks to determine the intrinsic value of a security by examining economic and financial factors. It considers macroeconomic factors such as the state of the economy and industry conditions.
A day trader is an individual who engages in buying and selling financial assets within the same trading day, seeking to profit from short-term price movements.
An investor is an individual, who invests money in an asset with the expectation that its value would appreciate in the future. The asset can be anything, including a bond, debenture, mutual fund, equity, gold, silver, exchange-traded funds (ETFs), and real-estate property.
Algorithmic trading is an advanced method that relies on advanced coding and formulas based on a mathematical model. However, compared to traditional trading methods, the process differs by being automated.

-
 Afghanistan
-
 Albania
-
 Algeria
-
 Argentina
-
 Armenia
-
 Australia
-
 Austria
-
 Azerbaijan
-
 Bahamas
-
 Bahrain
-
 Bangladesh
-
 Belgium
-
 Botswana
-
 Brazil
-
 Brunei
-
 Bulgaria
-
 Burma
Burma
-
 Cambodia
-
 Cameroon
-
 Canada
-
 Chile
Chile
-
 China
China
-
 Colombia
-
 Costa Rica
-
 Cote d'Ivoire
-
 Croatia
-
 Cyprus
-
 Czech Republic
-
 Denmark
-
 Dominican Republic
-
 Ecuador
-
 Egypt
Egypt
-
 Estonia
-
 Eswatini
-
 Ethiopia
-
 Finland
-
 France
-
 Georgia
-
 Germany
-
 Ghana
Ghana
-
 Greece
-
 Haiti
Haiti
-
 Hong Kong
-
 Hungary
-
 India
India
-
 Indonesia
-
 Iran, Islamic republic
-
 Iraq
Iraq
-
 Ireland
-
 Israel
-
 Italy
Italy
-
 Jamaica
-
 Japan
Japan
-
 Jordan
-
 Kazakhstan
-
 Kenya
Kenya
-
 Korea
Korea
-
 Kuwait
-
 Kyrgyzstan
-
 Laos
Laos
-
 Latvia
-
 Lebanon
-
 Libyan Arab Jamahiriya
-
 Lithuania
-
 Luxembourg
-
 Macedonia
-
 Madagascar
-
 Malaysia
-
 Malta
Malta
-
 Mauritius
-
 Mexico
-
 Moldova
-
 Mongolia
-
 Montenegro
-
 Morocco
-
 Mozambique
-
 Namibia
-
 Nepal
Nepal
-
 Netherlands
-
 Nigeria
-
 Norway
-
 Oman
Oman
-
 Pakistan
-
 Palestine
-
 Papua New Guinea
-
 Peru
Peru
-
 Philippines
-
 Poland
-
 Portugal
-
 Puerto Rico
-
 Qatar
Qatar
-
 Romania
-
 Rwanda
-
 Saudi Arabia
-
 Serbia
-
 Singapore
-
 Slovakia
-
 Slovenia
-
 Somalia
-
 South Africa
-
 Spain
Spain
-
 Sri Lanka
-
 Sweden
-
 Switzerland
-
 Syrian Arab Republic
-
 Taiwan
-
 Tajikistan
-
 Tanzania, United Republic Of
-
 Thailand
-
 Trinidad and Tobago
-
 Tunisia
-
 Turkey
-
 UAE
UAE
-
 Uganda
-
 Ukraine
-
 United Kingdom
-
United States
-
 Uzbekistan
-
 Venezuela
-
 Vietnam
-
 Yemen
Yemen
-
 Zambia
-
 Zimbabwe
- Forex
- Crypto

