Free Finviz vs. Finviz Elite: Which One Fits Your Needs?


Editorial Note: While we adhere to strict Editorial Integrity, this post may contain references to products from our partners. Here's an explanation for How We Make Money. None of the data and information on this webpage constitutes investment advice according to our Disclaimer.
Finviz is a popular stock screening and analysis tool. The free version offers basic features like screeners and news, while the Elite plan ($39.50/month) provides real-time data, advanced charts, and backtesting. The choice between Free Finviz and Finviz Elite depends on your trading needs.
Stock screeners and advanced charting softwares are some essential tools that traders and investors need alike. On similar lines, Finviz is a popular stock screener platform that offers both free and premium options in this domain. In this article, we will explore the benefits that Finviz offers to traders, and will explore if buying Finviz’s Elite plan is worth it or not.
What is Finviz?
Founded in 2007 by Juraj Duris in Slovakia, Finviz was created to simplify financial data and make investing more accessible for everyday traders.
Finviz, short for Financial Visualizations, is a popular stock analysis platform designed for US market investors and traders. It helps users explore market trends with features like stock screening, financial news, portfolio tracking, and chart analysis. The platform makes financial data easier to understand by offering clear visuals and easy-to-use tools, helping traders make well-informed decisions. Its user-friendly layout allows quick access to key market information, making it simpler to track and respond to stock movements.
While stock screening is Finviz’s standout feature, it also provides historical data analysis, market heatmaps, and instant notifications, making it a helpful tool for both day traders and long-term investors. With plenty of filtering options, users can focus on stocks based on technical indicators, company details, and financial performance.
| Feature | Finviz Free | Finviz Elite |
|---|---|---|
| Access to stock screener | Yes, with delayed data | Yes, with real-time data |
| Charting capabilities | Basic static charts | Advanced interactive charts |
| Market heatmaps | Yes | Yes, with additional filters |
| News aggregation | Yes | Yes |
| Data updates | Delayed data (15-20 minutes) | Real-time data |
| Custom alerts | Not available | Yes |
| Backtesting | Not available | Yes |
| Ad-free experience | No (contains advertisements) | Yes |
| Export data | Not available | Yes (CSV and Excel formats) |
| Price | Free | $39.50/month or $299.50/year |
Who should use Finviz Free?
Beginner investors exploring stock screening tools.
Those who are comfortable with delayed data and basic analysis.
Casual traders looking for free access to financial news and heatmaps.
Who should use Finviz Elite?
Active traders needing real-time data and advanced charting tools.
Investors seeking custom alerts and historical backtesting for strategy development.
Professionals who prefer ad-free access and the ability to export data.
Who uses Finviz?
Finviz caters to a diverse and wide range of users thanks to its comprehensive collection of tools that encompass both fundamental insights and technical indicators. This range of features makes it accessible to a wide audience, both novice and experienced.
For instance, long-term traders can use its screening tool to identify stocks that fit a specific criterion. Seasoned traders can also leverage this function to spot businesses that are primed for technical shifts. An example is the use of the Relative Strength Index (RSI) to search for oversold stocks.
Swing traders can also use Finviz to identify potential trading opportunities with the platform’s heatmap and news feed features. Through this, they can stay aware of significant market trends and other economic events that may influence their trading decisions.
Key features of Finviz
Experts have reviewed the key features of Finviz for your better understanding.
Stock screening
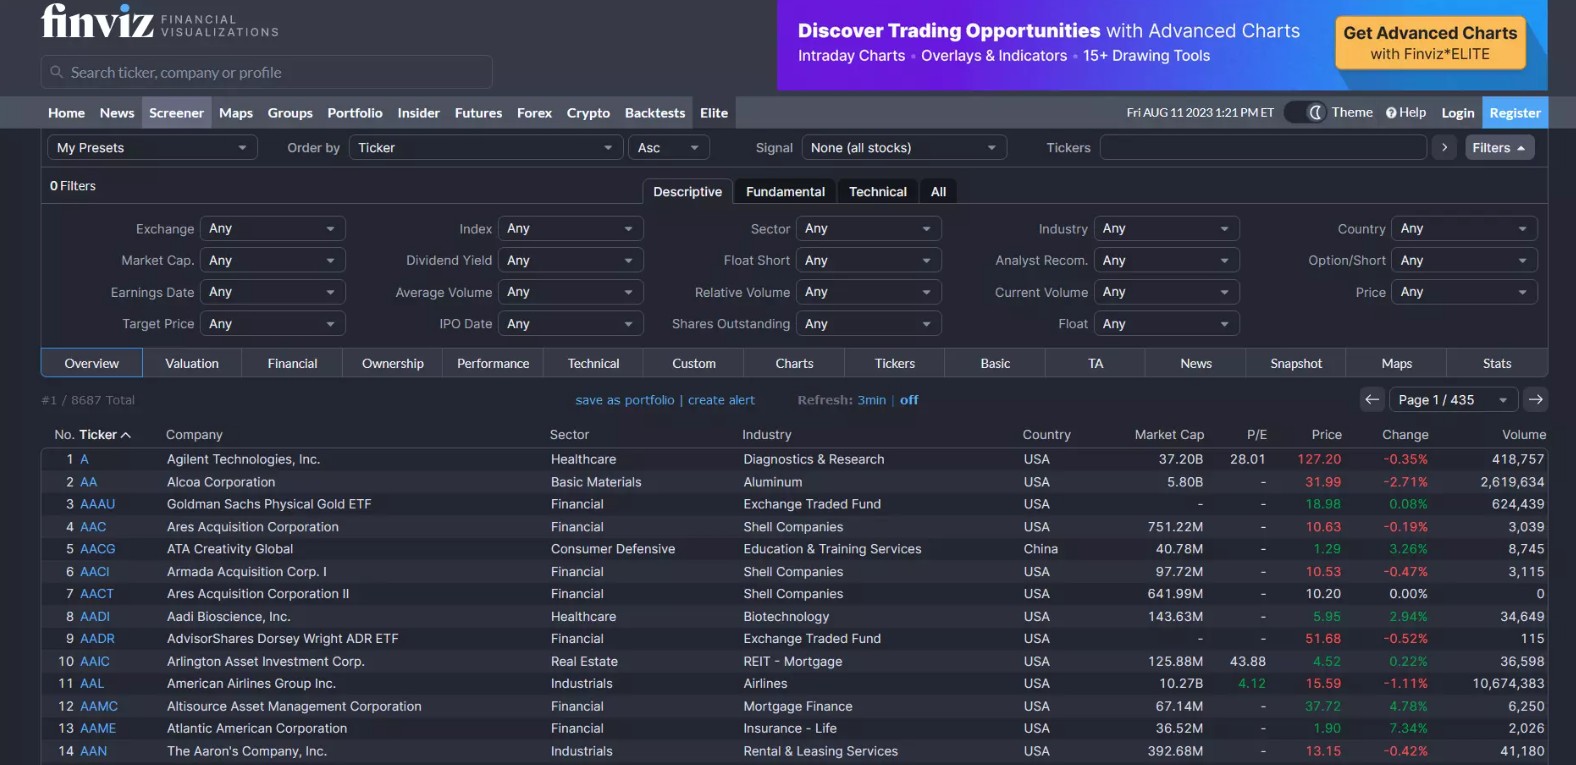
The Finviz stock screener focuses on around 8,500 stocks and ETFs, a substantial selection that captures many major assets. While it may not encompass the entire market, this tool proves highly valuable for most users. With 67 criteria available, both fundamental and technical, refining your search is straightforward. Additionally, the screener offers 30 charting signals, including insider transactions and chart patterns, assisting in identifying potential investments.
Visualizing with heatmaps
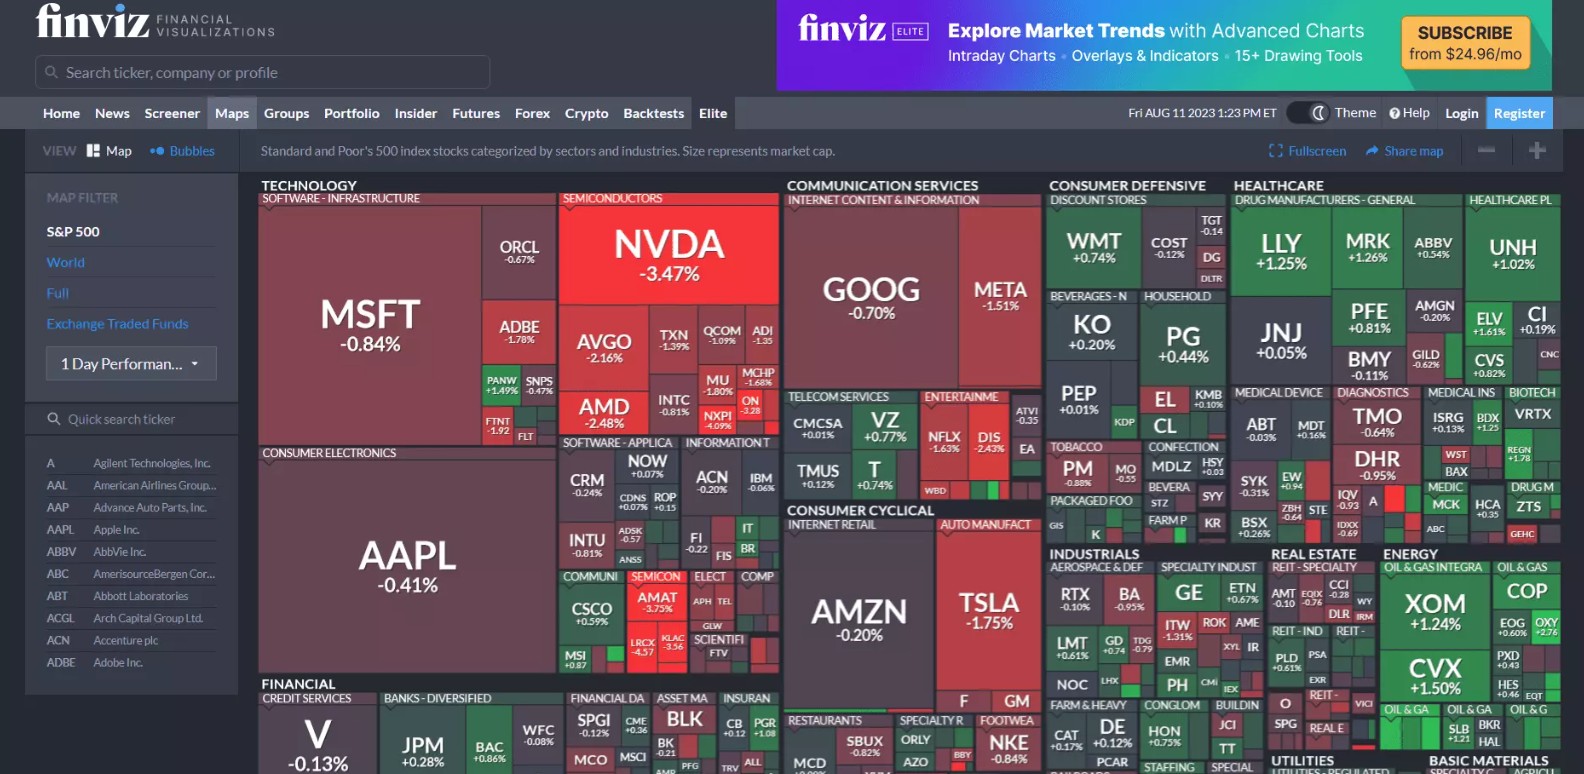
Heatmaps present a clear visualization of industries and sectors in the market. These color-coded representations reflect performance and provide the current performance percentage. By clicking on an asset, you can access more details. Similarly, the "Groups" feature offers the same data, presented as bar charts.
Portfolio organization
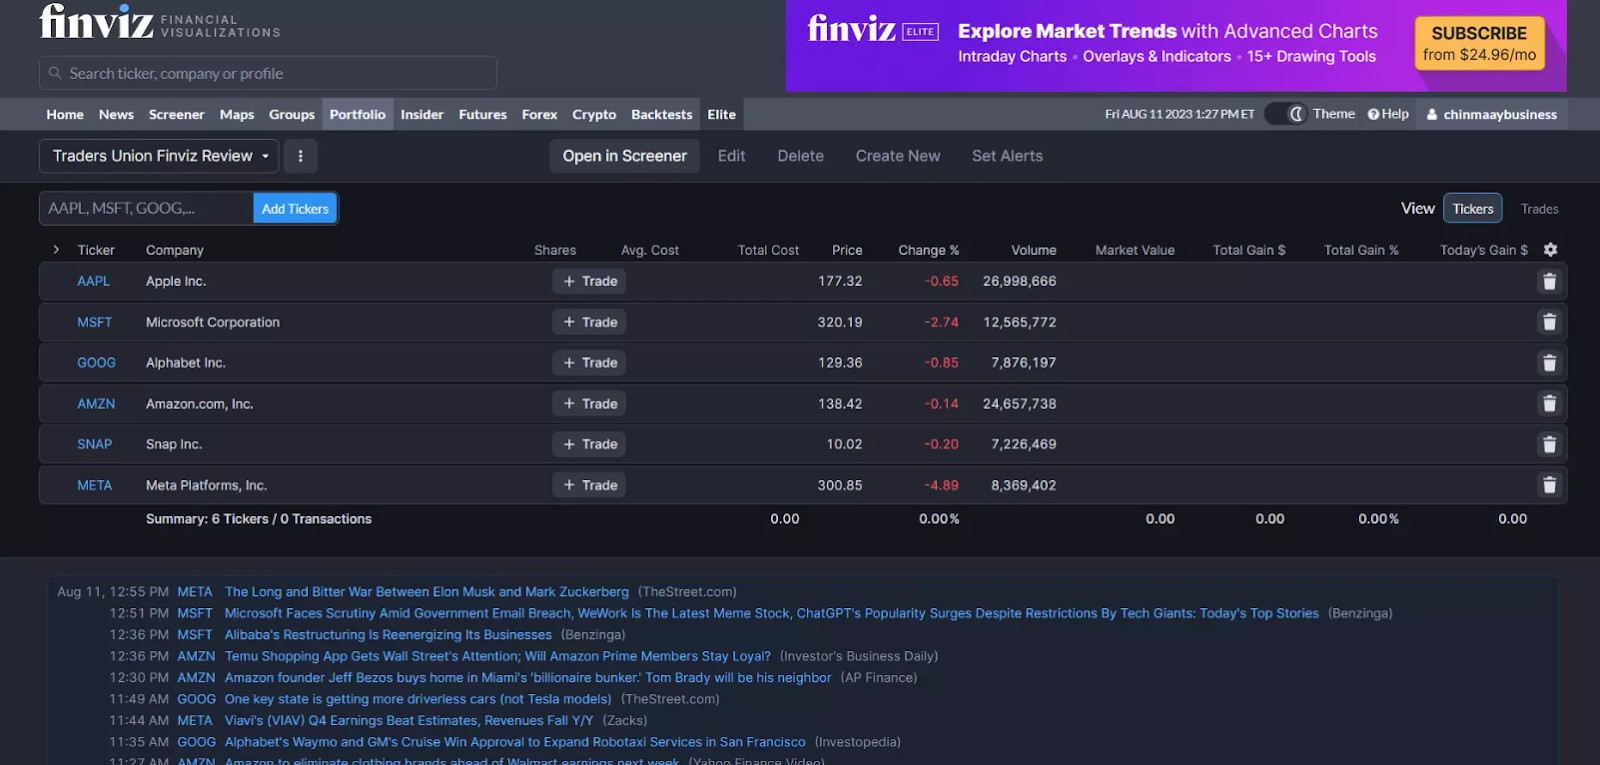
Finviz simplifies tracking with customizable portfolios or watchlists. The platform calculates performance metrics and dollar gains or losses for each portfolio, streamlining monitoring efforts. Additionally, portfolio management tools allow for the creation of segmented watchlists, facilitating focused trading strategies. Through this feature, users are empowered to create up to 50 unique portfolios with a limit of 50 tickers each (upgradable to 100 with a premium membership). Premium members can activate portfolio alerts, a benefit not offered to free users.
Visual tools and metrics
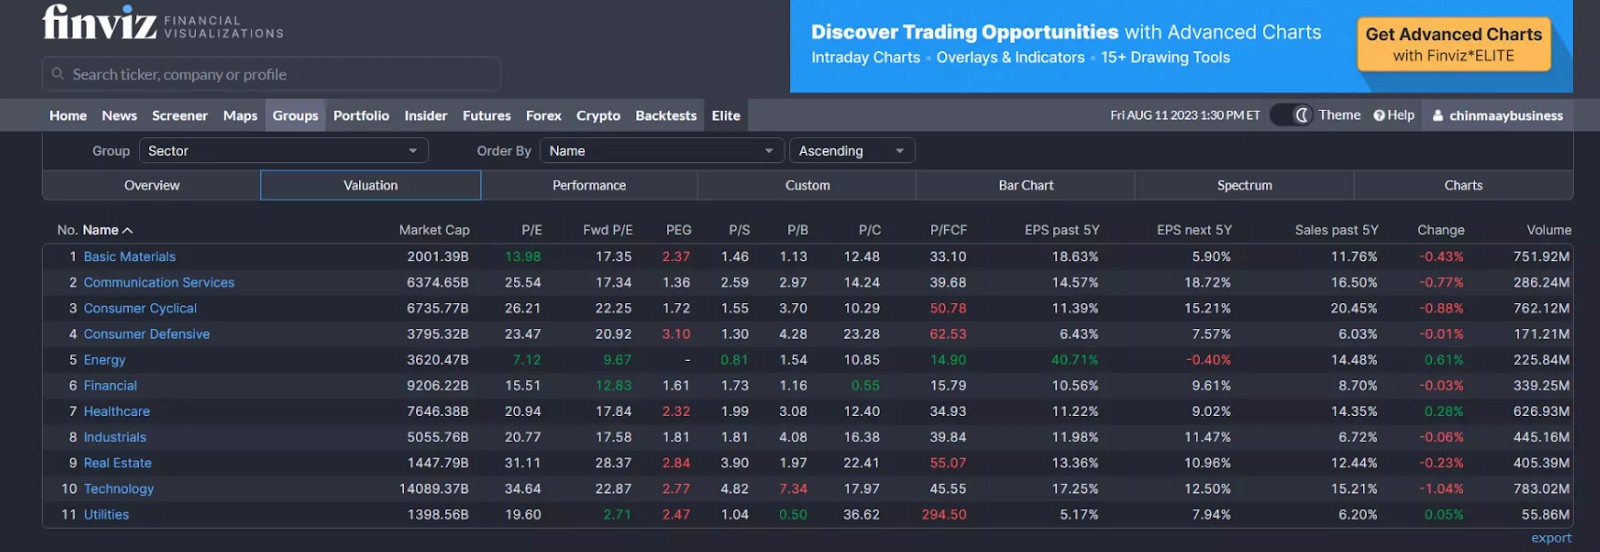
Under the "Groups" section, visual tools assist in examining sector performance across sectors, industries, and themes. Metrics like P/E, market cap, and EPS aid in uncovering promising stocks within each segment.
Futures insight
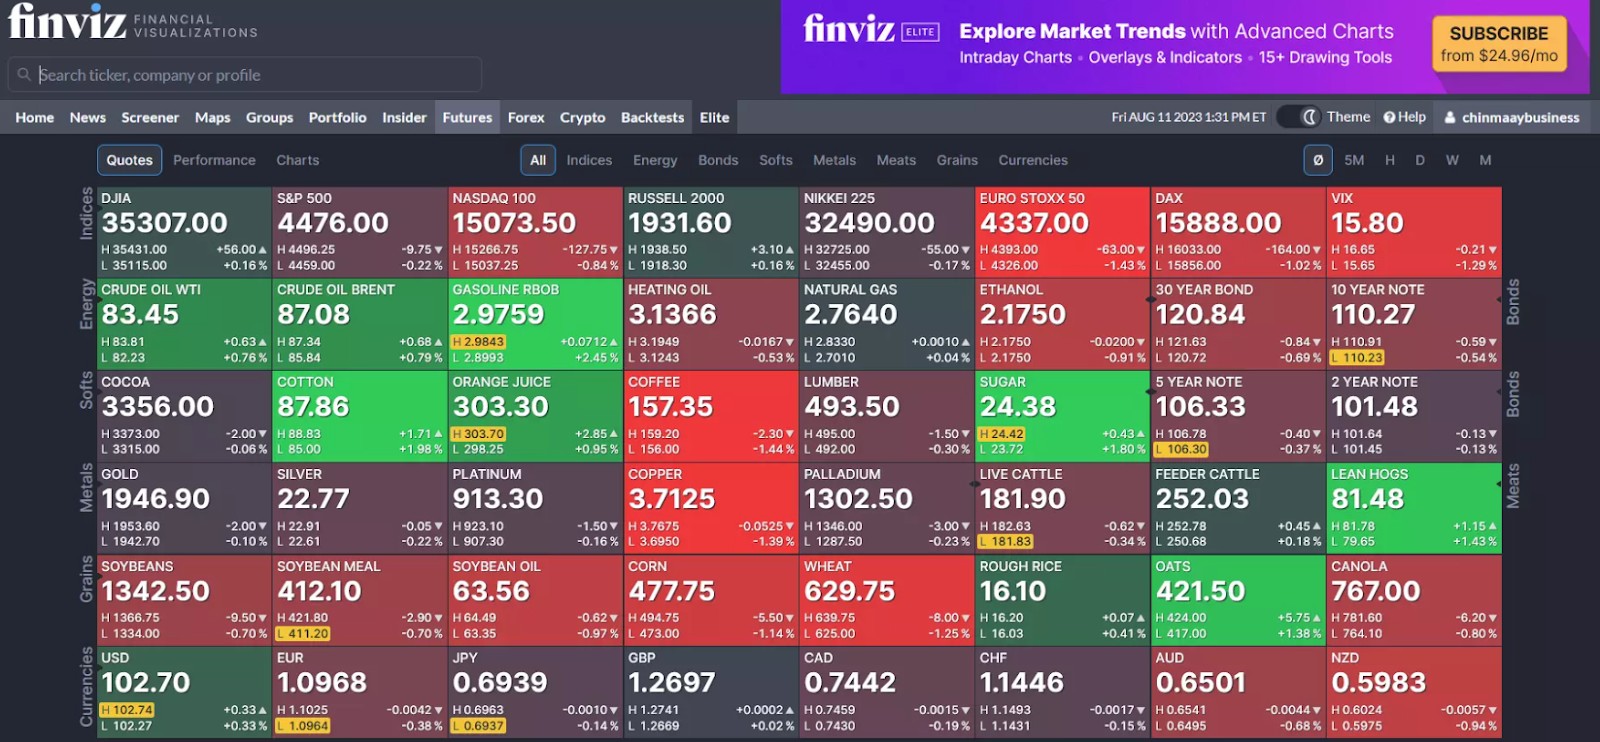
Finviz's futures charts provide heat maps for equity, commodity, and currency futures. This feature offers a quick overview of the futures market and helps identify correlations between contracts, offering insights into global markets, commodities, currencies, and more.
In-Depth charting (Elite-only feature)
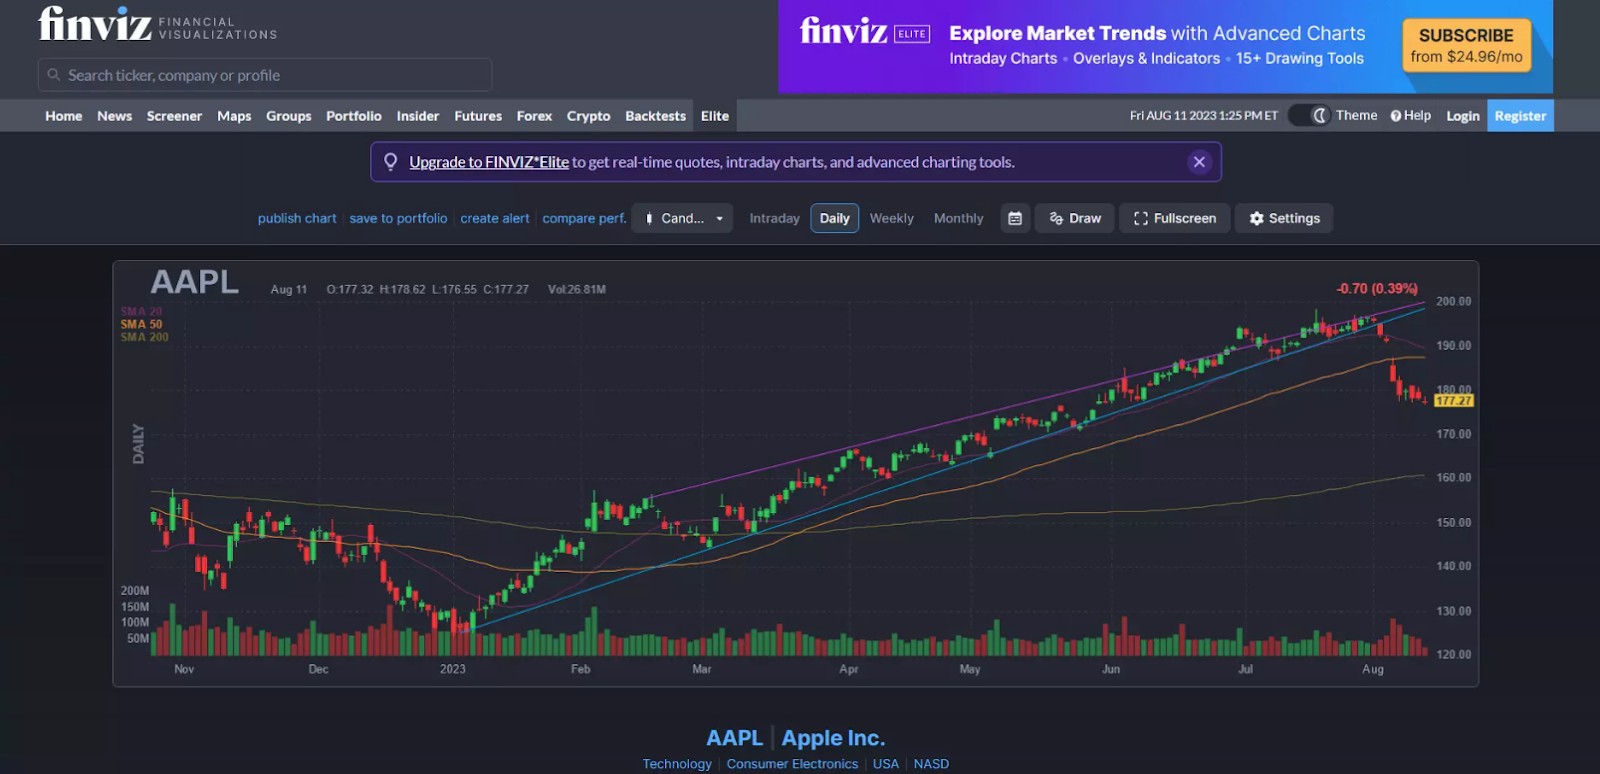
Charting stands out as a robust Finviz feature, offering five distinct chart types, including candle and line charts. Moreover, advanced and interactive options are accessible to subscribers. Time frames include monthly, weekly, daily, and intraday, with intraday available to paying members. Charts also offer supplementary data, like market cap and earnings, followed by comprehensive financial information below.
Strategy testing via backtesting (Elite-only feature)
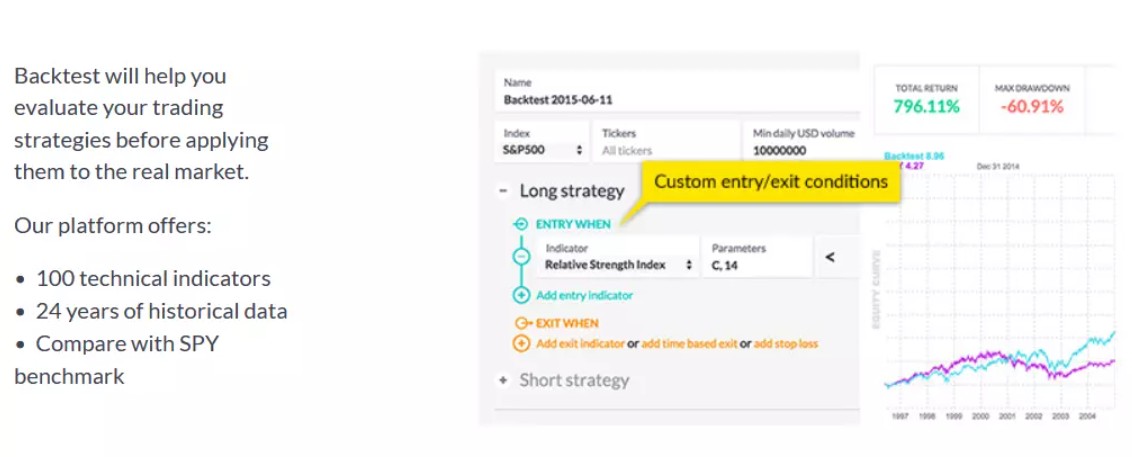
Reserved for Finviz Elite subscribers, the Backtesting feature delivers over two decades of data and more than 100 indicators. Investors can evaluate strategies over extended time frames. However, it's important to note that this feature provides a broad view and lacks detailed insights like trades and ratios.
Pros and cons of Finviz
- Pros
- Cons
Simplified market visualization. Finviz excels in presenting complex market data in a visual format. This makes it easier for traders and investors, regardless of experience, to grasp trends and patterns swiftly.
Real-time intraday data. The availability of real-time intraday data is a boon for traders who require up-to-the-minute insights. This feature enables quick responses to market shifts, enhancing the precision of trading decisions.
Long-term strategy testing. Finviz's 24-year backtesting capability provides users with the ability to evaluate strategies over extended historical periods. This feature aids in assessing the performance of various approaches in different market conditions.
Tailored portfolio tracking. The platform offers the convenience of tracking portfolios according to individual preferences. Users can monitor and manage their investments efficiently, promoting a more organized and informed trading approach.
Insights through heat maps. Finviz enhances decision-making by offering heat maps that visually represent sector and industry performance.
User-defined filters needed for customized screening. Unlike certain platforms that provide pre-constructed screeners, Finviz requires users to create their own filters. This demands more effort and time, particularly for those seeking quicker screening processes.
Limited chart overlays and indicators. While Finviz offers charting tools, it comes with limitations on the variety of overlays and indicators that users can apply. This might constrain advanced technical analysis and visualization capabilities.
Lack of auto-saving functionality. The absence of an auto-saving feature can be an inconvenience. Users need to remember to manually save their work, posing a risk of data loss in case of unforeseen interruptions.
Use real-time data and backtesting in Finviz Elite

If you're an active trader, Finviz Elite can be a game-changer. Unlike the free version's delayed quotes, Finviz Elite gives you real-time data, so you can react quickly to market changes. Its interactive charts, loaded with various technical indicators and drawing tools, make analyzing trends and planning your trades much more straightforward.
One of the coolest features is the backtesting tool, which lets you test your trading ideas against historical data going back up to 24 years. This means you can see how your strategies might have performed in the past before risking real money. Plus, Finviz Elite allows you to set up alerts for price changes, news, and updates to your portfolio, keeping you in the loop with what's happening in the market.
Conclusion
Choosing between Free Finviz and Finviz Elite depends on your trading style, goals, and budget. The free version is excellent for beginners and casual investors, while Finviz Elite is a powerful tool for active traders needing real-time data and advanced analytics. Recent updates to both versions ensure that Finviz remains a top choice for stock and options traders alike.
FAQ
Is Finviz a reliable source?
Yes, Finviz is generally considered a reliable source for financial data and market insights.
Which is better: Finviz or TradingView?
The choice between Finviz and TradingView depends on individual preferences and needs. Both platforms offer unique features; it's best to explore and see which aligns better with your requirements.
Is Finviz the best stock screener?
Finviz is among the popular stock screeners, but whether it's the best depends on your specific criteria and preferences.
Do you have to pay for Finviz?
Finviz offers a range of plans, including free options and paid plans with advanced features. You can choose a plan based on your needs and budget.
Related Articles
Team that worked on the article
Parshwa is a content expert and finance professional possessing deep knowledge of stock and options trading, technical and fundamental analysis, and equity research. As a Chartered Accountant Finalist, Parshwa also has expertise in Forex, crypto trading, and personal taxation. His experience is showcased by a prolific body of over 100 articles on Forex, crypto, equity, and personal finance, alongside personalized advisory roles in tax consultation.
Chinmay Soni is a financial analyst with more than 5 years of experience in working with stocks, Forex, derivatives, and other assets. As a founder of a boutique research firm and an active researcher, he covers various industries and fields, providing insights backed by statistical data. He is also an educator in the field of finance and technology.
As an author for Traders Union, he contributes his deep analytical insights on various topics, taking into account various aspects.
Mirjan Hipolito is a journalist and news editor at Traders Union. She is an expert crypto writer with five years of experience in the financial markets. Her specialties are daily market news, price predictions, and Initial Coin Offerings (ICO).
A day trader is an individual who engages in buying and selling financial assets within the same trading day, seeking to profit from short-term price movements.
Backtesting is the process of testing a trading strategy on historical data. It allows you to evaluate the strategy's performance in the past and identify its potential risks and benefits.
Fundamental analysis is a method or tool that investors use that seeks to determine the intrinsic value of a security by examining economic and financial factors. It considers macroeconomic factors such as the state of the economy and industry conditions.
Crypto trading involves the buying and selling of cryptocurrencies, such as Bitcoin, Ethereum, or other digital assets, with the aim of making a profit from price fluctuations.
Yield refers to the earnings or income derived from an investment. It mirrors the returns generated by owning assets such as stocks, bonds, or other financial instruments.


-
 Afghanistan
-
 Albania
-
 Algeria
-
 Argentina
-
 Armenia
-
 Australia
-
 Austria
-
 Azerbaijan
-
 Bahamas
-
 Bahrain
-
 Bangladesh
-
 Belgium
-
 Botswana
-
 Brazil
-
 Brunei
-
 Bulgaria
-
 Burma
Burma
-
 Cambodia
-
 Cameroon
-
 Canada
-
 Chile
Chile
-
 China
China
-
 Colombia
-
 Costa Rica
-
 Cote d'Ivoire
-
 Croatia
-
 Cyprus
-
 Czech Republic
-
 Denmark
-
 Dominican Republic
-
 Ecuador
-
 Egypt
Egypt
-
 Estonia
-
 Eswatini
-
 Ethiopia
-
 Finland
-
 France
-
 Georgia
-
 Germany
-
 Ghana
Ghana
-
 Greece
-
 Haiti
Haiti
-
 Hong Kong
-
 Hungary
-
 India
India
-
 Indonesia
-
 Iran, Islamic republic
-
 Iraq
Iraq
-
 Ireland
-
 Israel
-
 Italy
Italy
-
 Jamaica
-
 Japan
Japan
-
 Jordan
-
 Kazakhstan
-
 Kenya
Kenya
-
 Korea
Korea
-
 Kuwait
-
 Kyrgyzstan
-
 Laos
Laos
-
 Latvia
-
 Lebanon
-
 Libyan Arab Jamahiriya
-
 Lithuania
-
 Luxembourg
-
 Macedonia
-
 Madagascar
-
 Malaysia
-
 Malta
Malta
-
 Mauritius
-
 Mexico
-
 Moldova
-
 Mongolia
-
 Montenegro
-
 Morocco
-
 Mozambique
-
 Namibia
-
 Nepal
Nepal
-
 Netherlands
-
 Nigeria
-
 Norway
-
 Oman
Oman
-
 Pakistan
-
 Palestine
-
 Papua New Guinea
-
 Peru
Peru
-
 Philippines
-
 Poland
-
 Portugal
-
 Puerto Rico
-
 Qatar
Qatar
-
 Romania
-
 Rwanda
-
 Saudi Arabia
-
 Serbia
-
 Singapore
-
 Slovakia
-
 Slovenia
-
 Somalia
-
 South Africa
-
 Spain
Spain
-
 Sri Lanka
-
 Sweden
-
 Switzerland
-
 Syrian Arab Republic
-
 Taiwan
-
 Tajikistan
-
 Tanzania, United Republic Of
-
 Thailand
-
 Trinidad and Tobago
-
 Tunisia
-
 Turkey
-
 UAE
UAE
-
 Uganda
-
 Ukraine
-
 United Kingdom
-
United States
-
 Uzbekistan
-
 Venezuela
-
 Vietnam
-
 Yemen
Yemen
-
 Zambia
-
 Zimbabwe
- Forex
- Crypto
