Forex Market Trend Definition and Examples


Editorial Note: While we adhere to strict Editorial Integrity, this post may contain references to products from our partners. Here's an explanation for How We Make Money. None of the data and information on this webpage constitutes investment advice according to our Disclaimer.
Forex market trend is defined as the sustained movement of currency prices in one direction. Trends can be classified into three types: uptrend, downtrend, and sideways trend. An uptrend is characterized by rising prices, a downtrend by falling prices, and a sideways trend by stable prices.
In this article, we'll explore how to identify and analyze Forex market trends, including uptrends, downtrends, and sideways trends. We'll cover essential tools like Moving Averages and Trend Lines, and discuss strategies to help traders make informed decisions and maximize profits.
What is a Forex market trend and how to identify it?
A Forex market trend is the general direction in which the value of a currency pair moves over a certain period. Trends can be classified into three types.
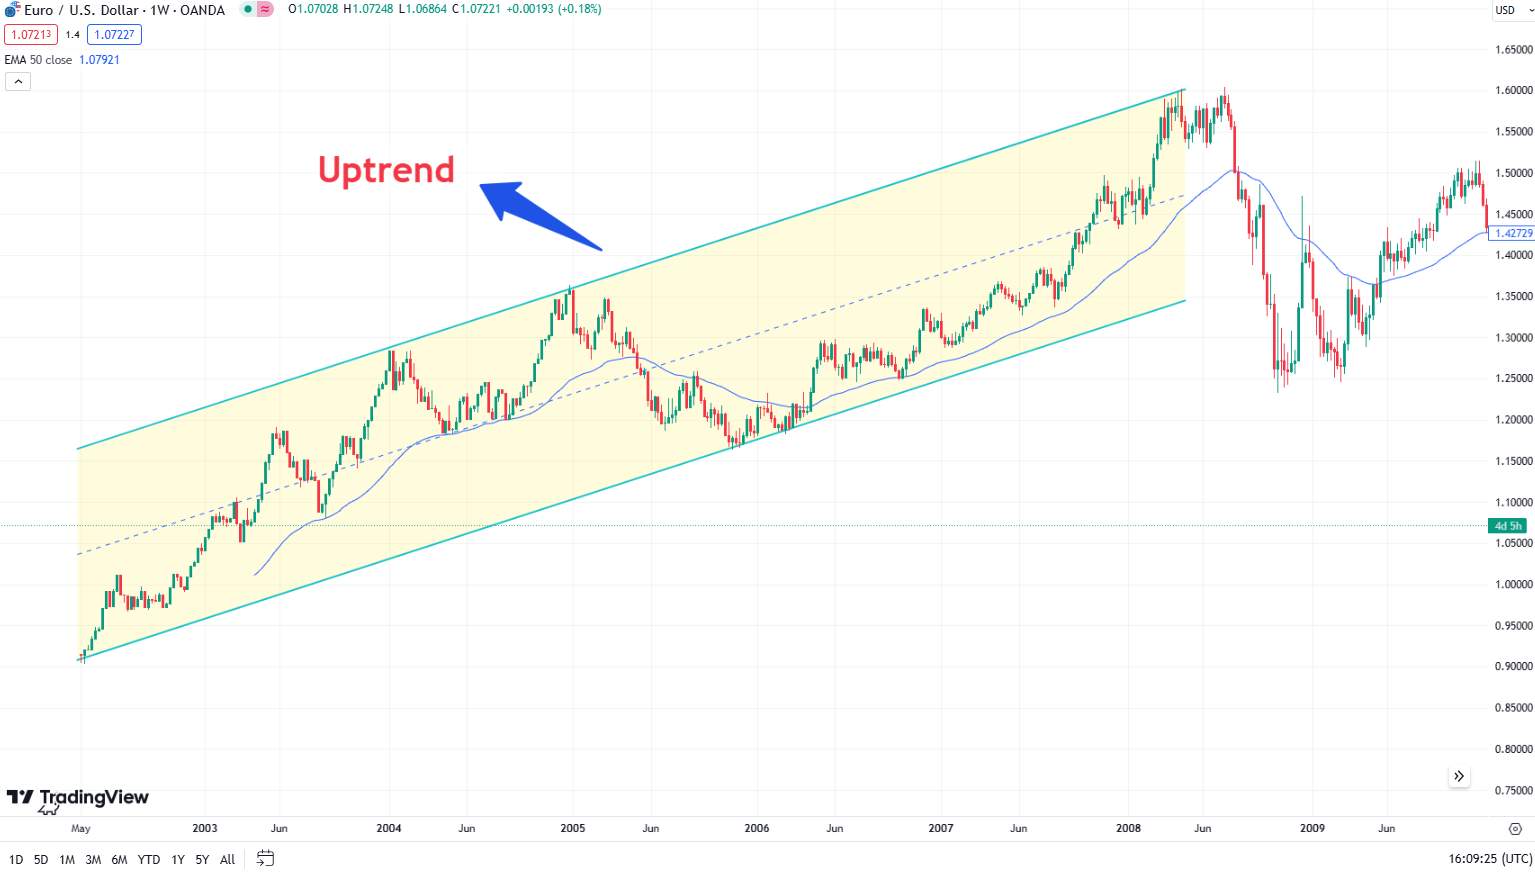
Uptrend: Characterized by higher highs and higher lows, indicating that the currency pair is increasing in value over time.
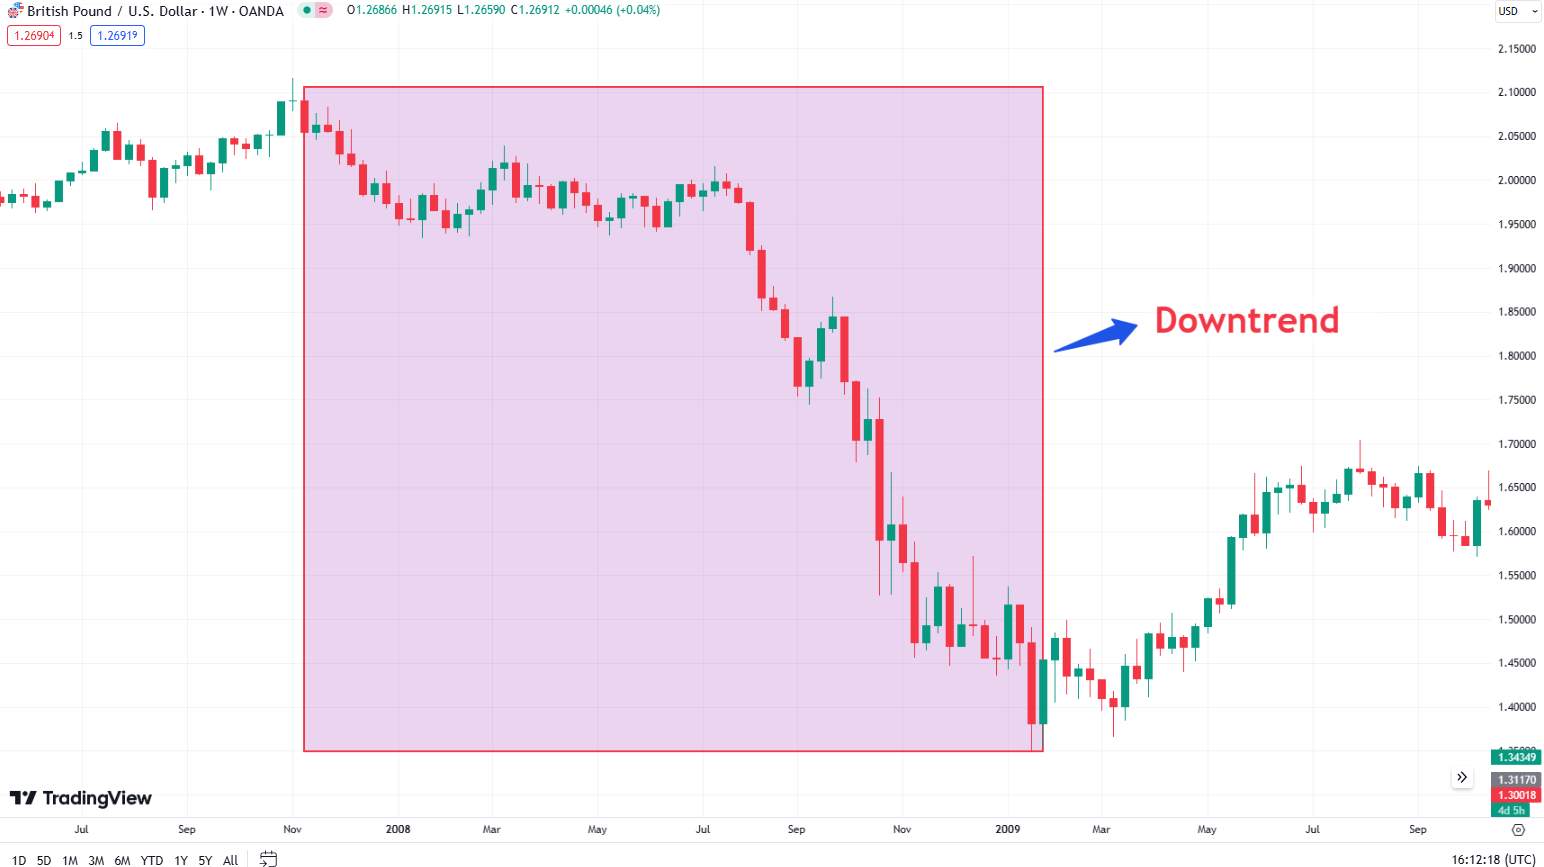
Downtrend: Marked by lower highs and lower lows, showing that the currency pair is decreasing in value over time.
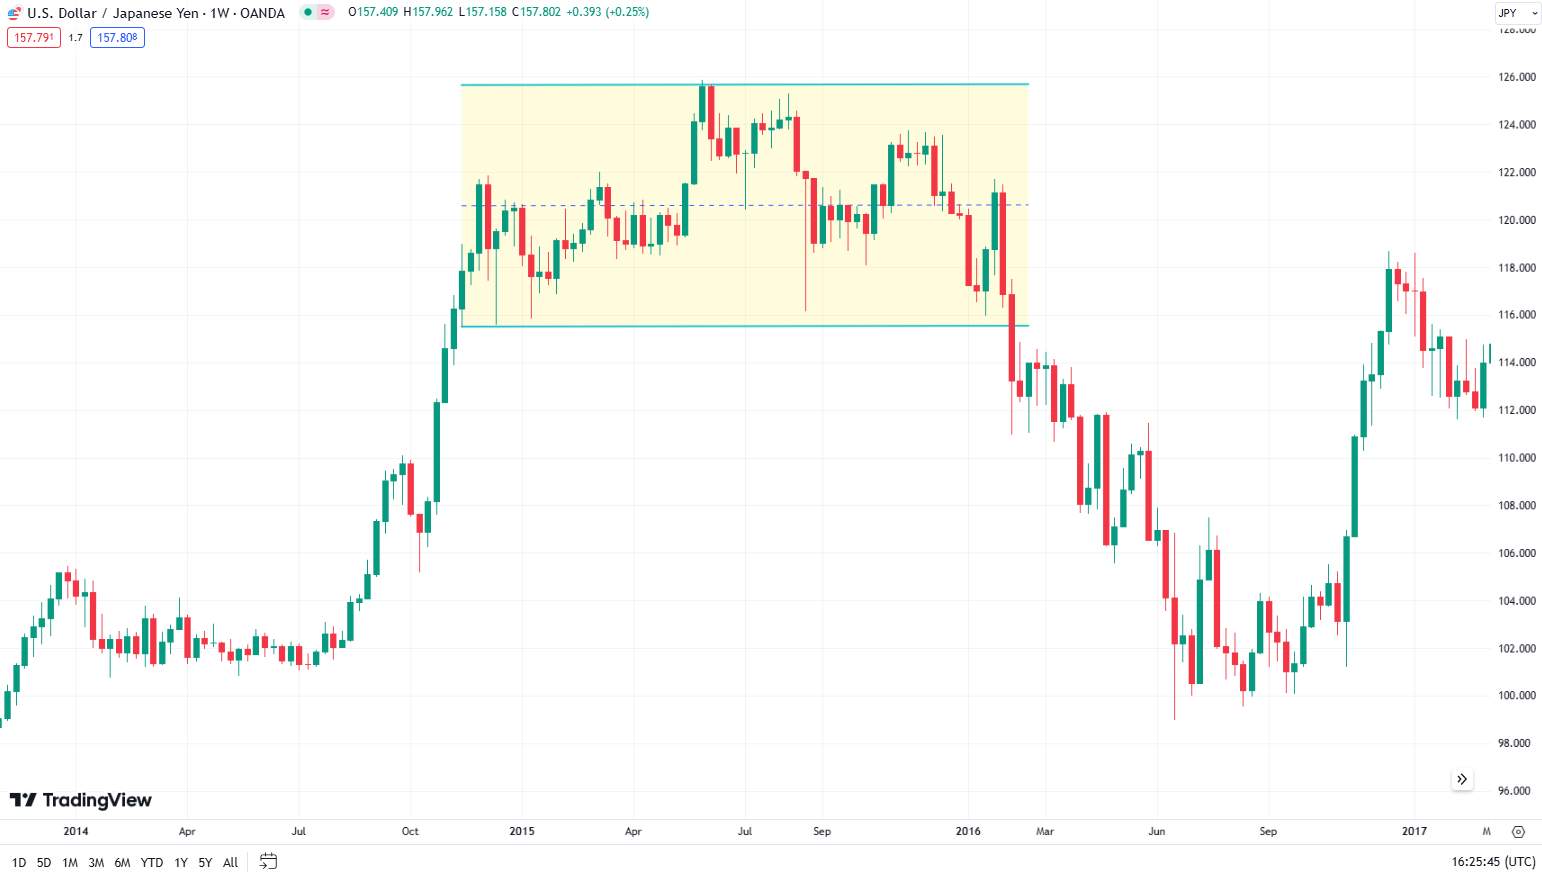
Sideways trend: Occurs when the currency pair moves within a horizontal range, indicating little to no net movement in value over time.
To identify market trends, traders use essential indicators and tools like Moving Averages and Trend Lines. These methods smooth out price data and highlight significant points to reveal the market's overall direction. Here's a detailed step-by-step guide to effectively identifying Forex market trends.
Step 1: Understand the basics of market trends
Understanding these different types of trends is crucial for traders, as it helps in identifying potential trading opportunities and developing appropriate strategies for each market condition.
Uptrend
Prices move higher over time, characterized by higher highs and higher lows. For example the EUR/USD pair experienced a significant uptrend from March 2002 to July 2008. During this period, the euro appreciated against the dollar due to strong economic growth in the Eurozone and relative weakness in the US economy. This uptrend was visible on the charts as a series of higher highs and higher lows, with the EUR/USD moving from around 0.87 to over 1.60.
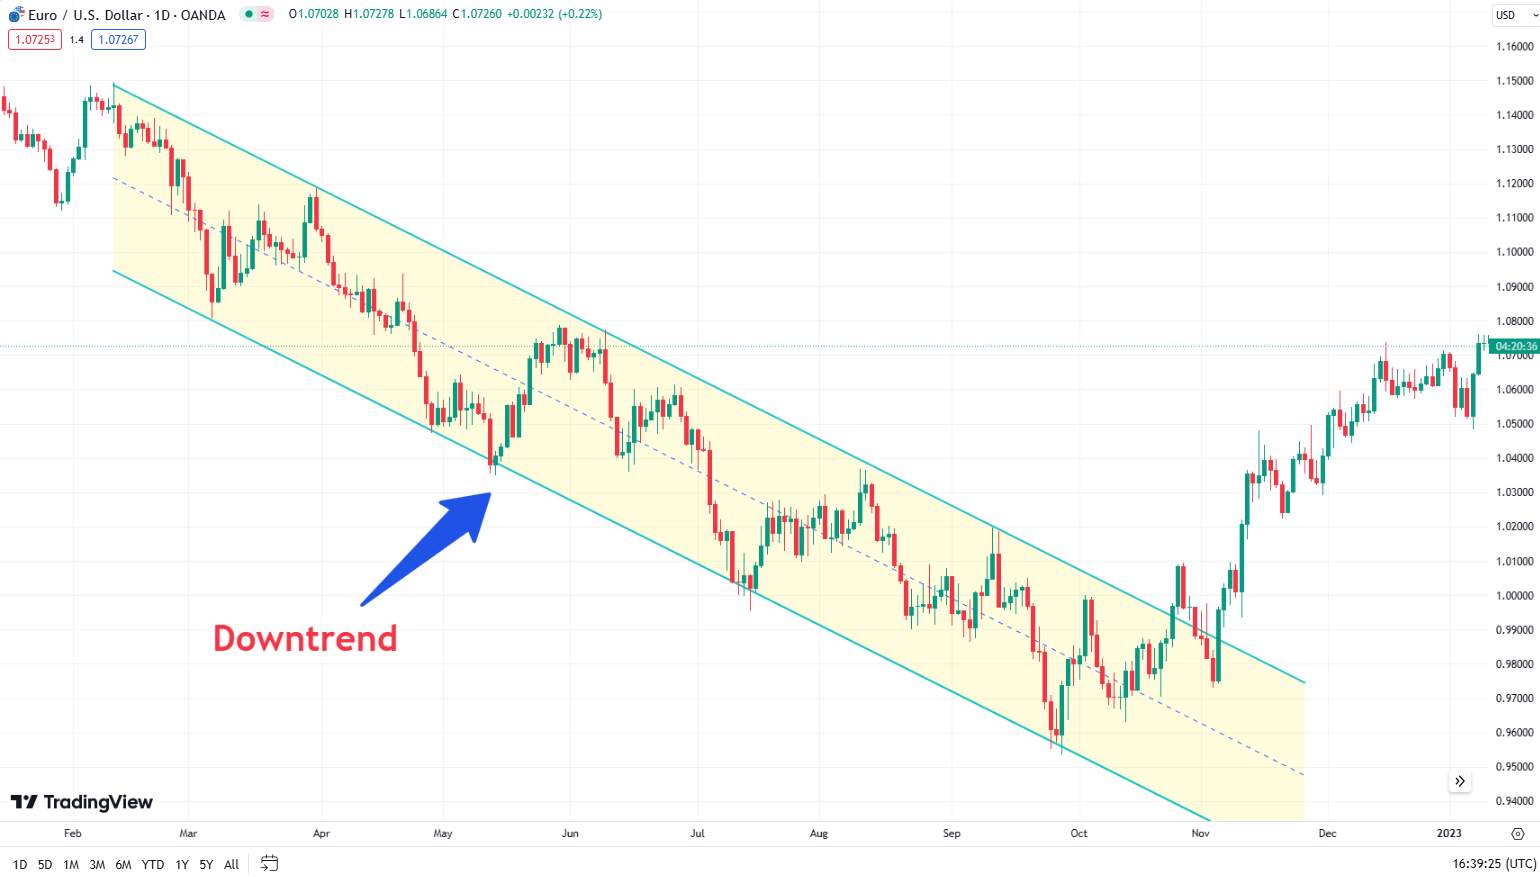
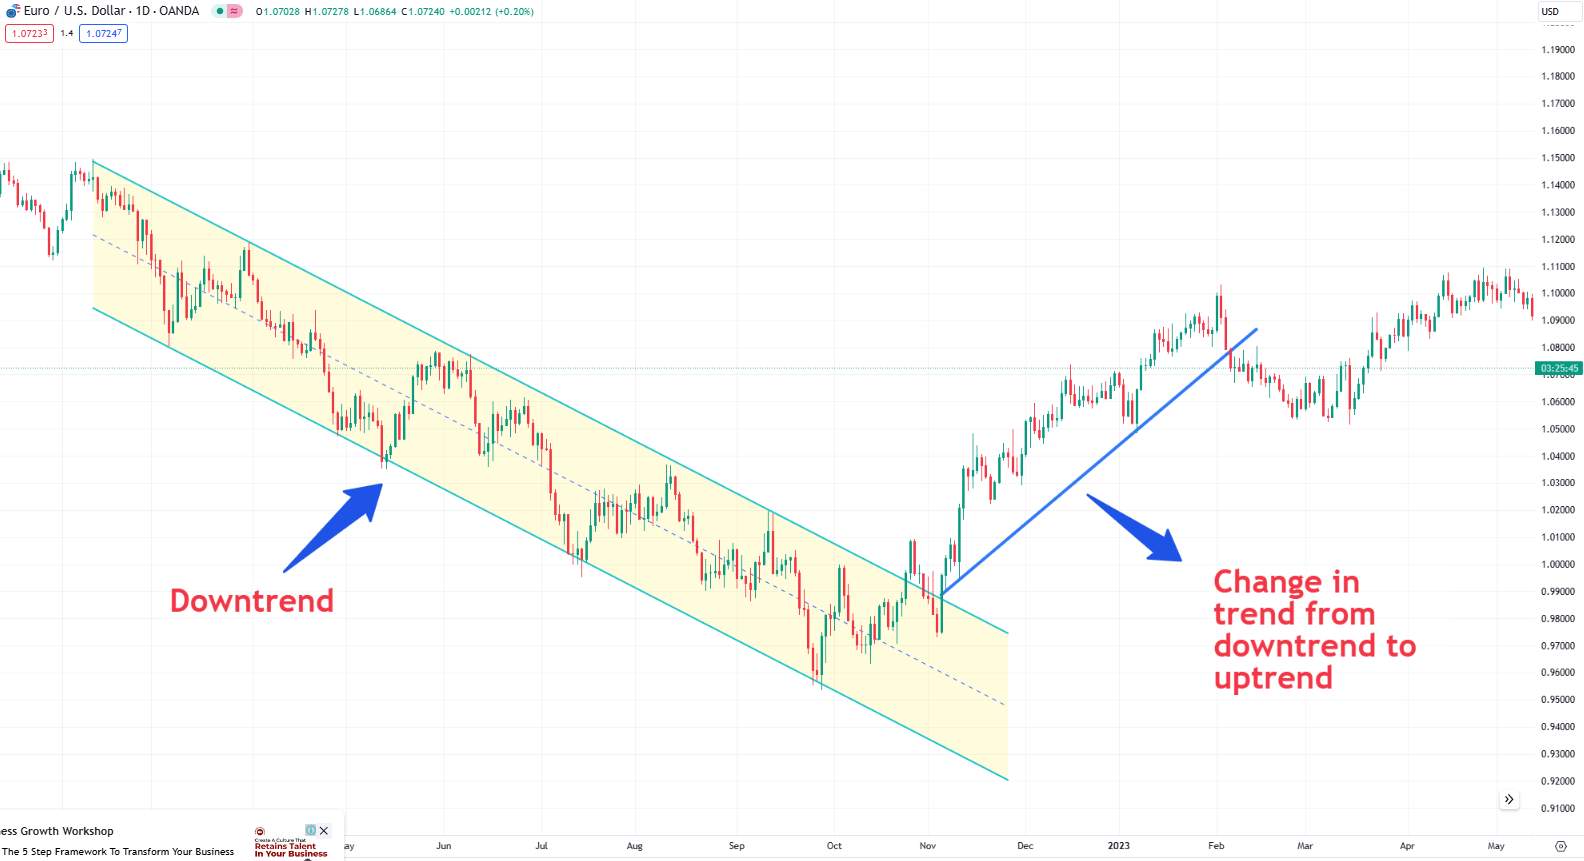
Downtrend
Prices move lower over time, characterized by lower highs and lower lows. For example: the GBP/USD pair saw a pronounced downtrend during the 2008 financial crisis. From November 2007 to January 2009, the British pound fell sharply against the US dollar as investors sought safe-haven assets amidst the global economic turmoil. The downtrend was marked by lower highs and lower lows, with the GBP/USD dropping from approximately 2.11 to around 1.35.
Sideways trend
Prices move within a range, without a clear upward or downward direction. For example: The USD/JPY pair exhibited a sideways trend from December 2014 to June2016. During this period, the pair fluctuated between 115 and 125, with no clear direction. This range-bound movement reflected uncertainty in the market, with neither buyers or sellers able to gain the upper hand. The sideways trend was characterized by the price bouncing between the support and resistance levels, forming a horizontal channel.
Step 2: Gather historical price data
Collect historical price data of the currency pair you want to analyze. This data can be obtained from various financial websites or trading platforms. Ensure you have enough data to analyze both short-term and long-term trends.
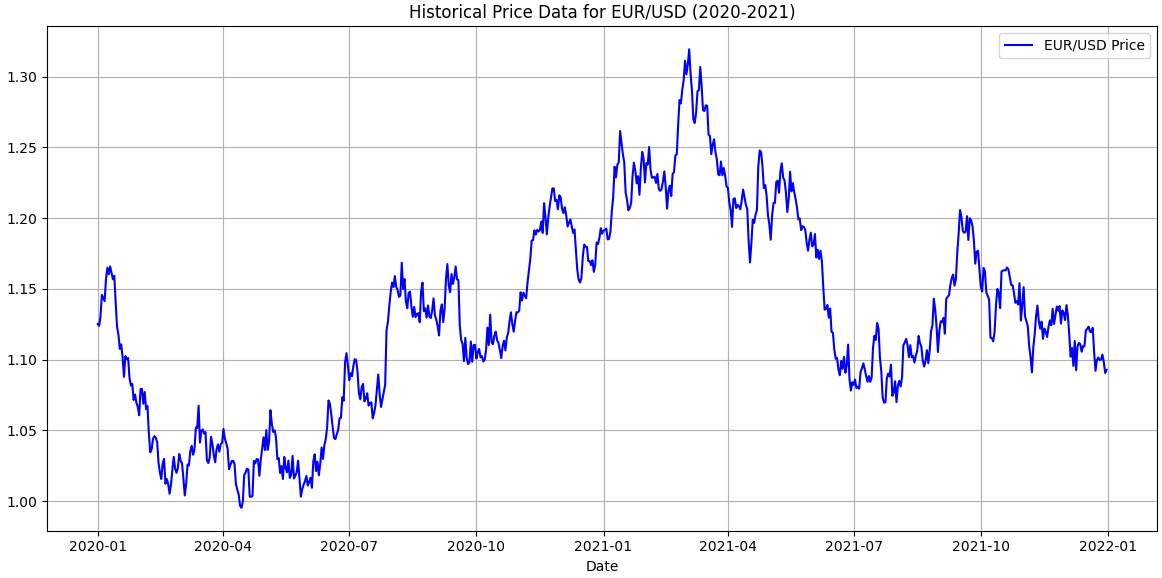
Note: a trend should be analyzed consistently, moving from a global period to a smaller one.
Step 3: Apply Moving Averages
Moving Averages (MA) forms a constantly updated average price and helps to identify the main direction of price fluctuations.There are about 20 different variations of this indicator, but two classic versions are most often used:
Simple Moving Average (SMA): Calculates the average of a selected range of prices, usually closing prices, by the number of periods in that range.
Exponential Moving Average (EMA): Similar to SMA, but gives more weight to recent prices, making it more responsive to new information.
Steps to Apply Moving Averages:
Choose the type of MA: Decide whether to use SMA or EMA based on your trading style and the level of responsiveness you need.
Select the period: Common periods are 20, 50, and 200. Shorter periods react quickly to price changes, while longer periods smooth out more fluctuations.
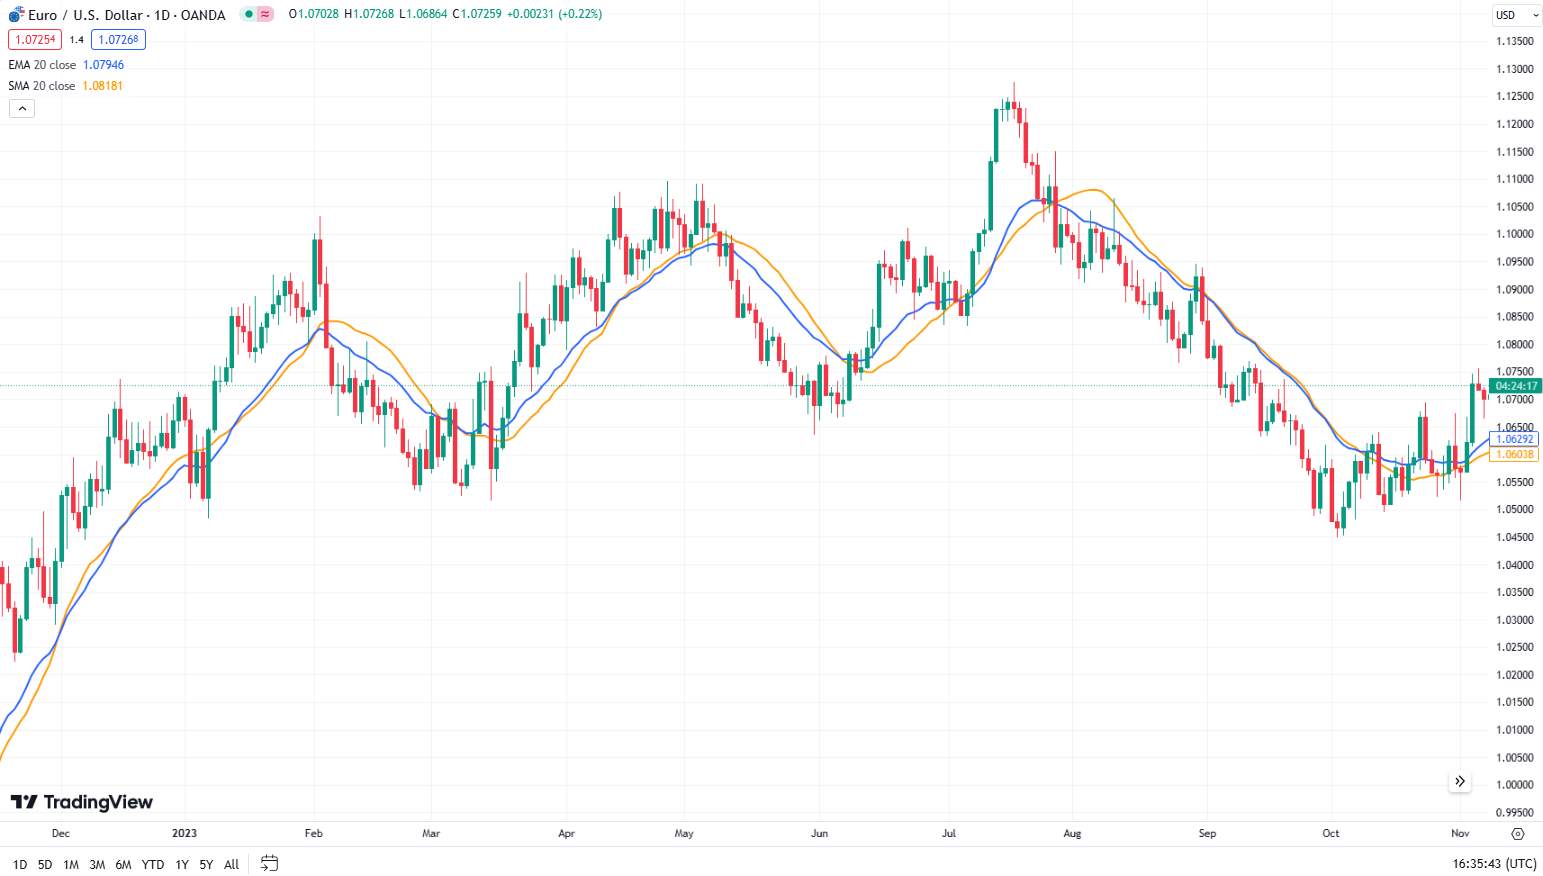
Apply the MA to your chart: Most trading platforms allow you to add MAs to your chart.
Look at how the price interacts with the MA:
If the price is consistently above the MA, it indicates an uptrend.
If the price is consistently below the MA, it indicates a downtrend.
Step 4: Draw trend lines
Trend Lines are straight lines drawn on a chart that connect two or more price points and extend into the future to act as support or resistance.
Steps to draw trend lines:
Identify significant lows and highs:
Uptrend. Connect at least two significant lows. The trend line should slope upwards.
Downtrend. Connect at least two significant highs. The trend line should slope downwards.
Draw the line. Use your charting tool to draw the line connecting these points. Extend the line into the future.
Validate the line. A valid trend line should be touched at least three times by the price action without breaking.
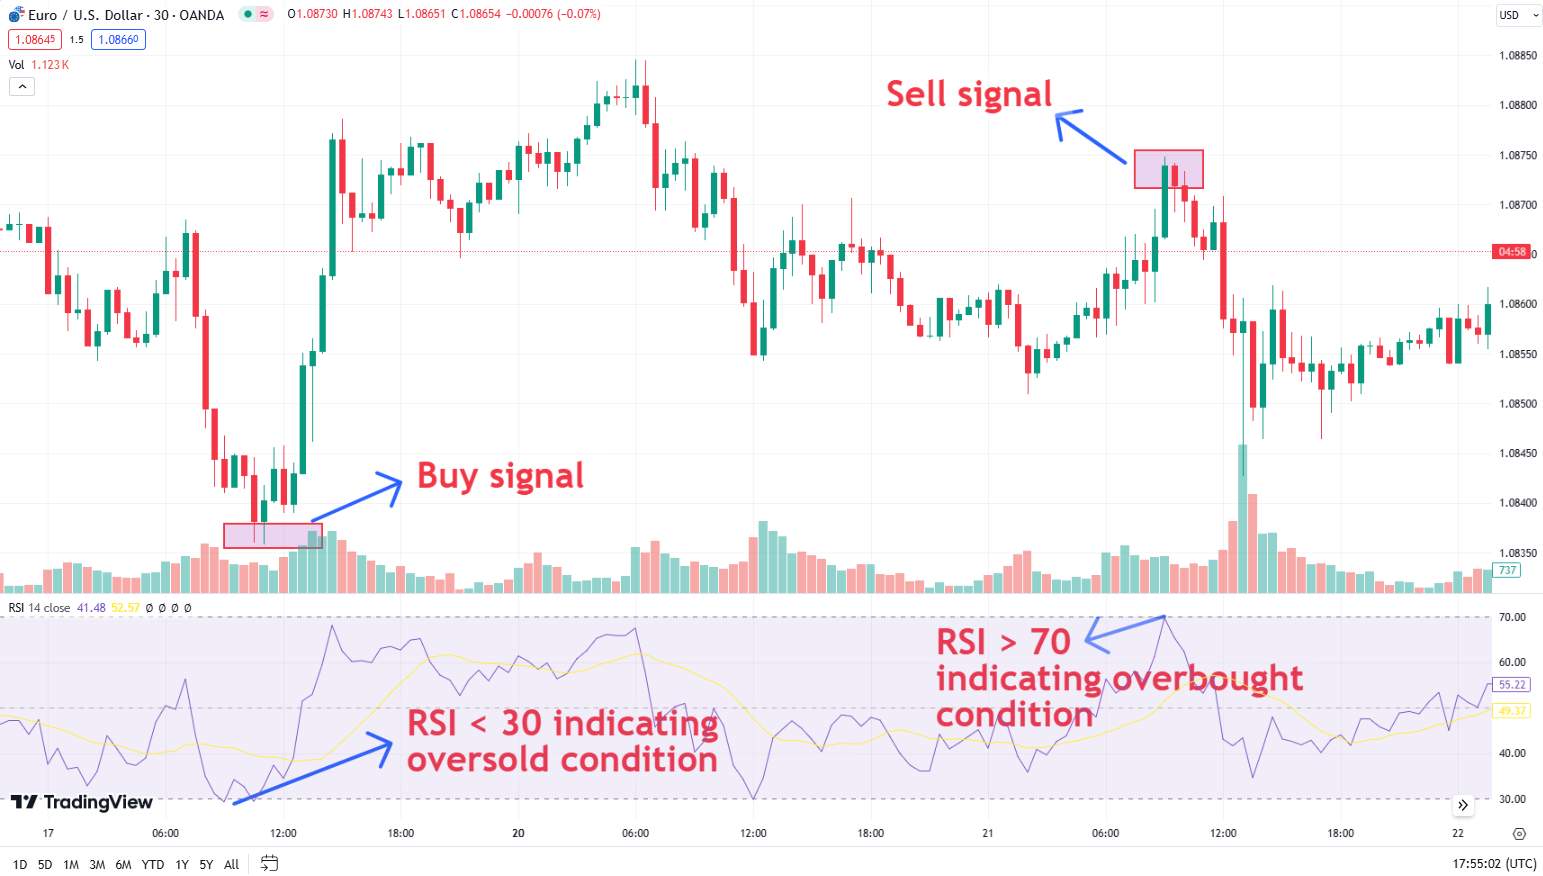
Step 5: Confirm the trend with additional indicators
To avoid false signals, it’s important to confirm the trend using additional indicators:
Relative Strength Index (RSI): Measures the speed and change of price movements. An RSI above 70 indicates overbought conditions (potential reversal from uptrend), while below 30 indicates oversold conditions (potential reversal from downtrend).
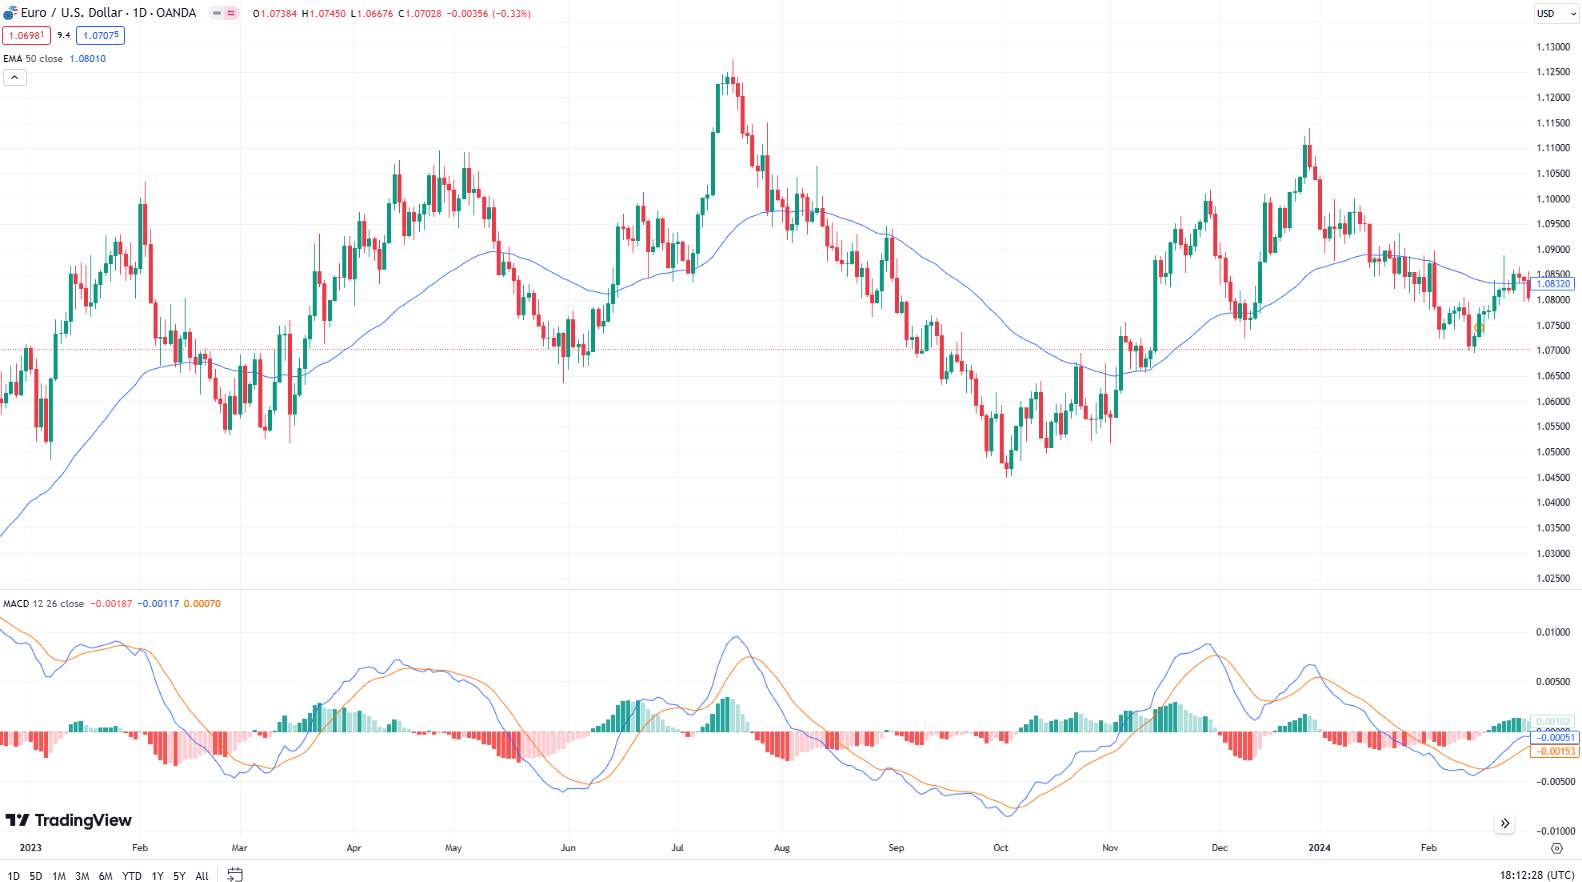
Moving Average Convergence Divergence (MACD): Shows the relationship between two moving averages of a security’s price. Look for the MACD line crossing above the signal line for a bullish signal and below for a bearish signal.
Step 6: Analyze multiple timeframes
Analyzing multiple timeframes provides a broader perspective on market trends:
Long-term trends: Use weekly or monthly charts to identify overall market direction and major trends.
Medium-term trends: Use daily charts to spot patterns developing over weeks to months, refining your analysis.
Short-term trends: Use hourly or minute charts to detect immediate price movements and volatility for precise entry and exit points.
Steps for multi-timeframe analysis:
Start with higher time frames: Identify the overall trend direction on a weekly or monthly chart.
Move to lower time frames: Look for trend confirmation and possible entry points on daily and hourly charts.
Align trends: Ensure the trend direction aligns across different timeframes for stronger signals.
Step 7: Monitor and adjust
Trends can change, so it’s important to monitor your charts regularly and adjust your trend lines and moving averages as needed:
Re-draw trend lines: If the price action breaks a trend line, it might indicate a trend reversal or a shift in market dynamics.
Update moving averages: Adjust the periods of your MAs if they no longer align with the price action.
Stages of a market trend
Market trends go through several stages: accumulation, markup, distribution, and markdown:
Accumulation phase
The accumulation phase occurs after a prolonged downtrend when the market starts to stabilize. During this phase, institutional investors and savvy traders begin to buy assets at lower prices, believing that the market has bottomed out. This phase is typically characterized by low volatility and sideways price movement, indicating a period of consolidation.
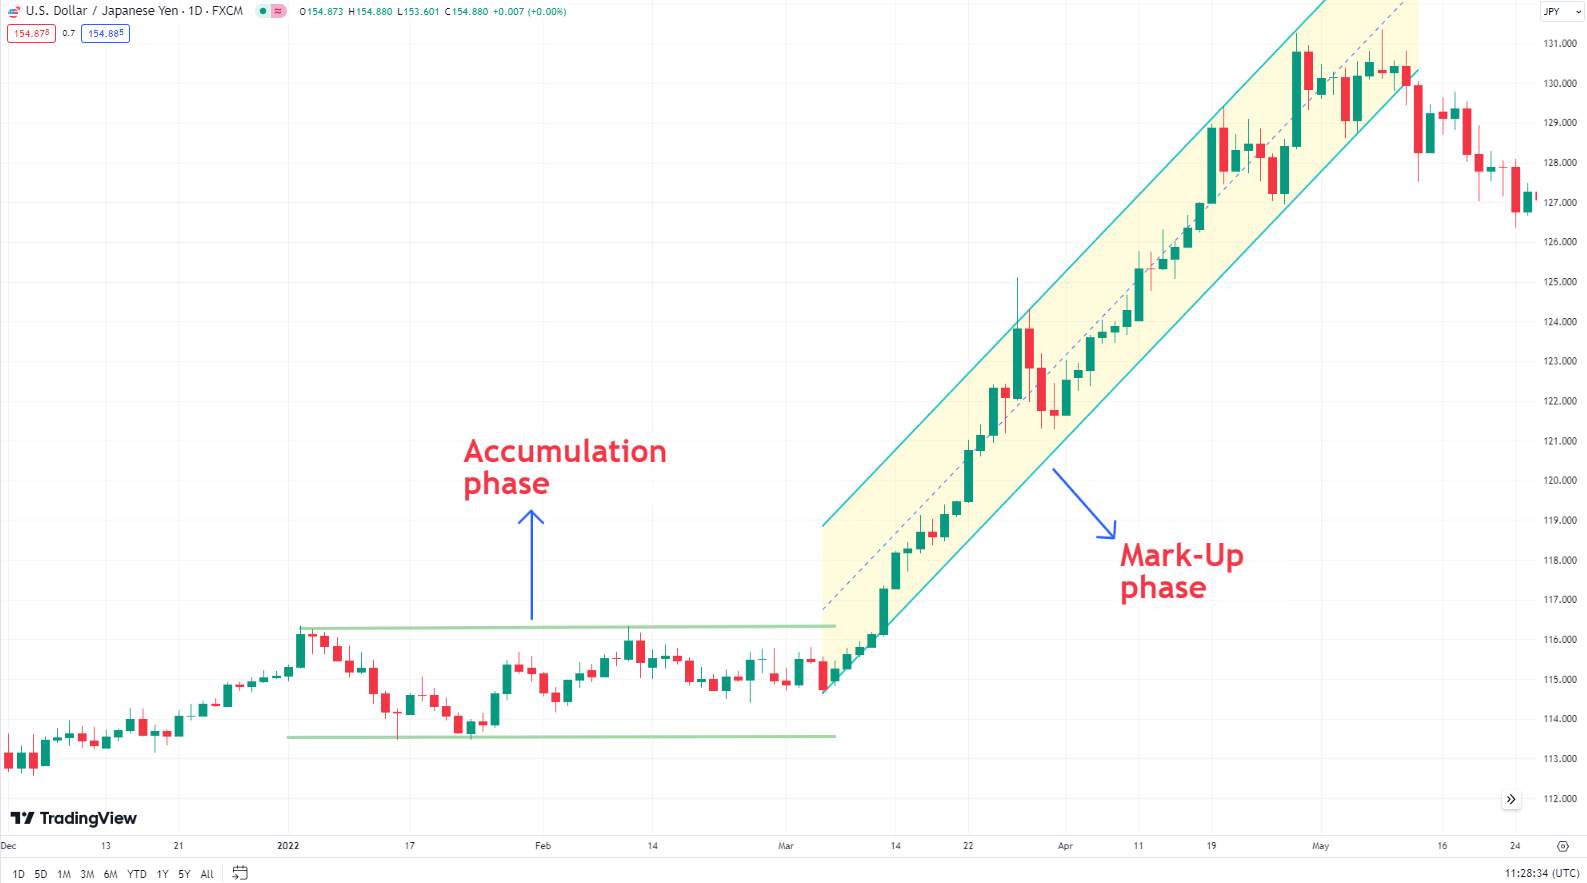
Markup phase
Following the accumulation phase, the markup phase is marked by a steady increase in prices. More investors begin to recognize the trend reversal, leading to increased buying pressure. This phase is characterized by higher highs and higher lows, signaling a strong uptrend.
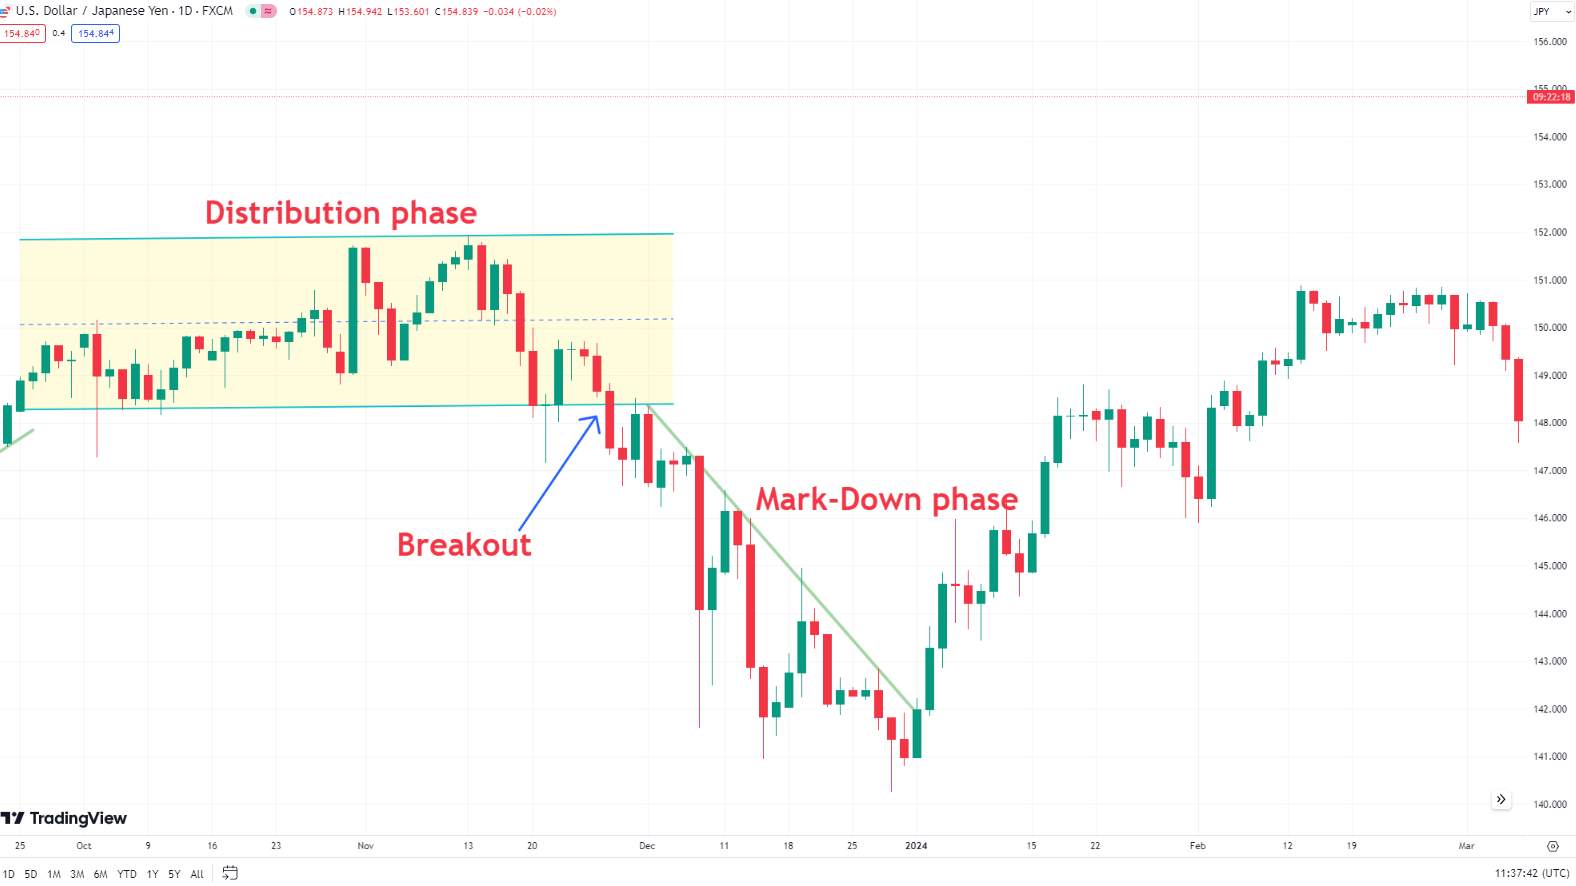
Distribution phase
After a prolonged uptrend, the market enters the distribution phase. Here, institutional investors begin to sell their holdings, believing that the market has reached its peak. This phase is often characterized by high volatility and sideways movement, as buying and selling pressures are relatively balanced.
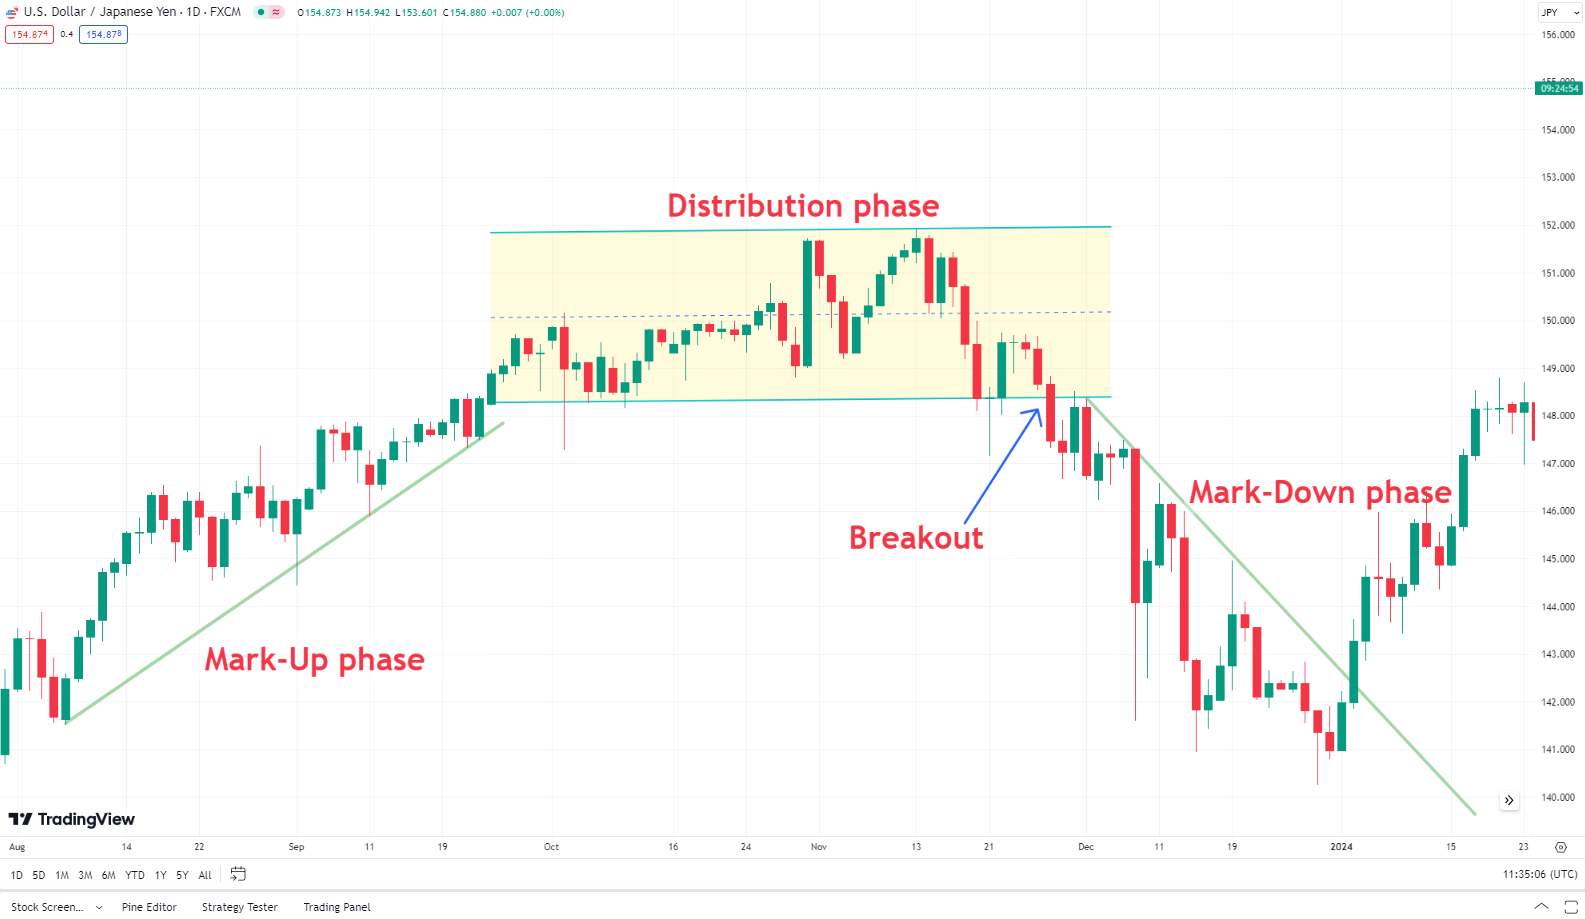
Markdown phase
The markdown phase follows the distribution phase and is characterized by a steady decline in prices. As more investors recognize the trend reversal, selling pressure increases. This phase is marked by lower highs and lower lows, indicating a strong downtrend.
Trading strategies based on market trends
| Strategy | Entry/Exit | Risk Management | Example |
|---|---|---|---|
Moving Averages Crossover, Breakout of Trendlines | Stop-Loss Orders | Enter long on EUR/USD when 20 EMA crosses 50 EMA, stop-loss below swing low. | |
RSI, MACD, Chart Patterns | Trailing Stop-Loss Orders | Long GBP/USD when RSI < 30, exit at RSI > 70, or use trailing stop-loss. | |
Fundamental Analysis, Technical Confirmation | Wider Stop-Loss Orders | Long USD/JPY on strong growth, confirm with 200-day MA, stop-loss below 200-day MA. |
We've presented some brokers below where you can apply these strategies and start trading with confidence. Explore these options to find the best platform that suits your trading style and needs.
| Demo | Min. deposit, $ | Max. leverage | Min Spread EUR/USD, pips | Max Spread EUR/USD, pips | Investor protection | Open account | |
|---|---|---|---|---|---|---|---|
| Yes | 100 | 1:300 | 0,5 | 0,9 | €20,000 £85,000 SGD 75,000 | Open an account Your capital is at risk. |
|
| Yes | No | 1:500 | 0,5 | 1,5 | £85,000 €20,000 €100,000 (DE) | Open an account Your capital is at risk.
|
|
| Yes | No | 1:200 | 0,1 | 0,5 | £85,000 SGD 75,000 $500,000 | Open an account Your capital is at risk. |
|
| Yes | 100 | 1:50 | 0,7 | 1,2 | £85,000 | Study review | |
| Yes | No | 1:30 | 0,2 | 0,8 | $500,000 £85,000 | Open an account Your capital is at risk. |
Understanding market trends is the key crucial aspects of successful trading

Since I started trading, I've learned that understanding market trends is one of the most crucial aspects of successful trading. When you grasp the concept of trends, you're not just predicting the market's future movements; you're interpreting the market's story. Trends tell you where the market has been and where it might be going.
First and foremost, patience is key. Markets do not move in a straight line, and trends take time to develop. It's essential to wait for confirmation of a trend before making significant trading decisions. Jumping in too early can lead to unnecessary losses.
Risk management cannot be overstated. Even the most promising trends can reverse unexpectedly due to unforeseen events. Always set stop-loss orders to protect your capital. It’s better to exit a trade with a small loss than to risk your entire trading account on a single position.
Conclusion
Understanding Forex market trends is crucial for successful trading. By applying the strategies and tools discussed in this article, traders can make more informed decisions and improve their trading performance. Whether you are a beginner or an advanced trader, grasping the dynamics of market trends will enhance your ability to navigate the Forex market effectively. Keep learning, stay informed about global events, and continuously refine your trading strategies to achieve better outcomes in the ever-evolving Forex market.
FAQs
What are the best indicators for analyzing Forex market trends?
Some of the best indicators for analyzing Forex market trends include Moving Averages (both Simple and Exponential), MACD (Moving Average Convergence Divergence), and RSI (Relative Strength Index).
How can beginners start trend trading in Forex?
You can start trend trading in Forex by first learning the basics of trend identification and using simple tools like Moving Averages and Trend Lines. Practicing on a demo account can help beginners gain confidence without risking real money. It’s also crucial to develop a trading plan and implement risk management strategies.
What are the risks involved in Forex trend trading?
The risks involved in Forex trend trading include market volatility, unexpected trend reversals, and potential losses. Traders should be aware of regulatory risks, technological disruptions, and general investment risks such as liquidity risk and tracking errors.
Can trend trading be applied to other markets besides Forex?
Yes, trend trading can be applied to other markets such as stocks, commodities, and cryptocurrencies. The principles of trend identification and using technical indicators remain the same, although each market may have unique characteristics that traders need to consider.
Related Articles
Team that worked on the article
Andrey Mastykin is an experienced author, editor, and content strategist who has been with Traders Union since 2020. As an editor, he is meticulous about fact-checking and ensuring the accuracy of all information published on the Traders Union platform. Andrey focuses on educating readers about the potential rewards and risks involved in trading financial markets.
He firmly believes that passive investing is a more suitable strategy for most individuals. Andrey's conservative approach and focus on risk management resonate with many readers, making him a trusted source of financial information.
Also, Andrey is a member of the National Union of Journalists of Ukraine (membership card No. 4574, international certificate UKR4492).
Chinmay Soni is a financial analyst with more than 5 years of experience in working with stocks, Forex, derivatives, and other assets. As a founder of a boutique research firm and an active researcher, he covers various industries and fields, providing insights backed by statistical data. He is also an educator in the field of finance and technology.
As an author for Traders Union, he contributes his deep analytical insights on various topics, taking into account various aspects.
Mirjan Hipolito is a journalist and news editor at Traders Union. She is an expert crypto writer with five years of experience in the financial markets. Her specialties are daily market news, price predictions, and Initial Coin Offerings (ICO).
Fundamental analysis is a method or tool that investors use that seeks to determine the intrinsic value of a security by examining economic and financial factors. It considers macroeconomic factors such as the state of the economy and industry conditions.
Swing trading is a trading strategy that involves holding positions in financial assets, such as stocks or forex, for several days to weeks, aiming to profit from short- to medium-term price swings or "swings" in the market. Swing traders typically use technical and fundamental analysis to identify potential entry and exit points.
In the Forex market, a “trend” is the label used to describe the general direction that the prices of currency pairs are moving in, over a specific period of time. Trends are basically the pattern that a currency pair appears to be following and can help traders determine when to enter and exit a trade.
Risk management is a risk management model that involves controlling potential losses while maximizing profits. The main risk management tools are stop loss, take profit, calculation of position volume taking into account leverage and pip value.
Forex trading, short for foreign exchange trading, is the practice of buying and selling currencies in the global foreign exchange market with the aim of profiting from fluctuations in exchange rates. Traders speculate on whether one currency will rise or fall in value relative to another currency and make trading decisions accordingly. However, beware that trading carries risks, and you can lose your whole capital.

-
 Afghanistan
-
 Albania
-
 Algeria
-
 Argentina
-
 Armenia
-
 Australia
-
 Austria
-
 Azerbaijan
-
 Bahamas
-
 Bahrain
-
 Bangladesh
-
 Belgium
-
 Botswana
-
 Brazil
-
 Brunei
-
 Bulgaria
-
 Burma
Burma
-
 Cambodia
-
 Cameroon
-
 Canada
-
 Chile
Chile
-
 China
China
-
 Colombia
-
 Costa Rica
-
 Cote d'Ivoire
-
 Croatia
-
 Cyprus
-
 Czech Republic
-
 Denmark
-
 Dominican Republic
-
 Ecuador
-
 Egypt
Egypt
-
 Estonia
-
 Eswatini
-
 Ethiopia
-
 Finland
-
 France
-
 Georgia
-
 Germany
-
 Ghana
Ghana
-
 Greece
-
 Haiti
Haiti
-
 Hong Kong
-
 Hungary
-
 India
India
-
 Indonesia
-
 Iran, Islamic republic
-
 Iraq
Iraq
-
 Ireland
-
 Israel
-
 Italy
Italy
-
 Jamaica
-
 Japan
Japan
-
 Jordan
-
 Kazakhstan
-
 Kenya
Kenya
-
 Korea
Korea
-
 Kuwait
-
 Kyrgyzstan
-
 Laos
Laos
-
 Latvia
-
 Lebanon
-
 Libyan Arab Jamahiriya
-
 Lithuania
-
 Luxembourg
-
 Macedonia
-
 Madagascar
-
 Malaysia
-
 Malta
Malta
-
 Mauritius
-
 Mexico
-
 Moldova
-
 Mongolia
-
 Montenegro
-
 Morocco
-
 Mozambique
-
 Namibia
-
 Nepal
Nepal
-
 Netherlands
-
 Nigeria
-
 Norway
-
 Oman
Oman
-
 Pakistan
-
 Palestine
-
 Papua New Guinea
-
 Peru
Peru
-
 Philippines
-
 Poland
-
 Portugal
-
 Puerto Rico
-
 Qatar
Qatar
-
 Romania
-
 Rwanda
-
 Saudi Arabia
-
 Serbia
-
 Singapore
-
 Slovakia
-
 Slovenia
-
 Somalia
-
 South Africa
-
 Spain
Spain
-
 Sri Lanka
-
 Sweden
-
 Switzerland
-
 Syrian Arab Republic
-
 Taiwan
-
 Tajikistan
-
 Tanzania, United Republic Of
-
 Thailand
-
 Trinidad and Tobago
-
 Tunisia
-
 Turkey
-
 UAE
UAE
-
 Uganda
-
 Ukraine
-
 United Kingdom
-
United States
-
 Uzbekistan
-
 Venezuela
-
 Vietnam
-
 Yemen
Yemen
-
 Zambia
-
 Zimbabwe
- Forex
- Crypto

