Best Indicator For Quotex


Editorial Note: While we adhere to strict Editorial Integrity, this post may contain references to products from our partners. Here's an explanation for How We Make Money. None of the data and information on this webpage constitutes investment advice according to our Disclaimer.
The best indicator for Quotex trading in 2026 is the Alligator Indicator, widely used for identifying trend phases and filtering out market noise. When combined with RSI and MACD, it forms a highly effective strategy for scalping, swing, and trend trading across different timeframes.
Indicators are essential tools in Forex trading that help traders analyze market trends, identify opportunities, and improve decision-making. These tools use historical price data to generate signals that indicate potential price movements. In Quotex trading, indicators are integrated into the platform, allowing traders to apply them seamlessly to their trading strategies. The best indicators in Quotex help traders optimize their entries and exits for better accuracy and profits. This article explores how to use the Alligator, MACD, and RSI indicators on Quotex, including setup methods, strategy combinations, and risk-management techniques to improve your trading accuracy and consistency.
Best Indicator for Quotex – top choices


Selecting the best indicator for Quotex depends on the trader’s strategy and market conditions. While several tools stand out on the platform, one that consistently ranks high in trader preference is the Alligator Indicator in Quotex.
Alligator Indicator in Quotex
The Alligator Indicator Quotex strategy was introduced by Bill Williams and remains a popular choice among traders for identifying the beginning and end of market trends. As part of a broader Quotex indicators strategy, it is particularly helpful in filtering out sideways movements and providing clarity on trend phases.
This tool is made up of three distinct moving averages, each visually representing different parts of an alligator’s mouth. When applied correctly on the Quotex chart, this indicator helps traders pinpoint when to enter or exit trades based on market structure and momentum.
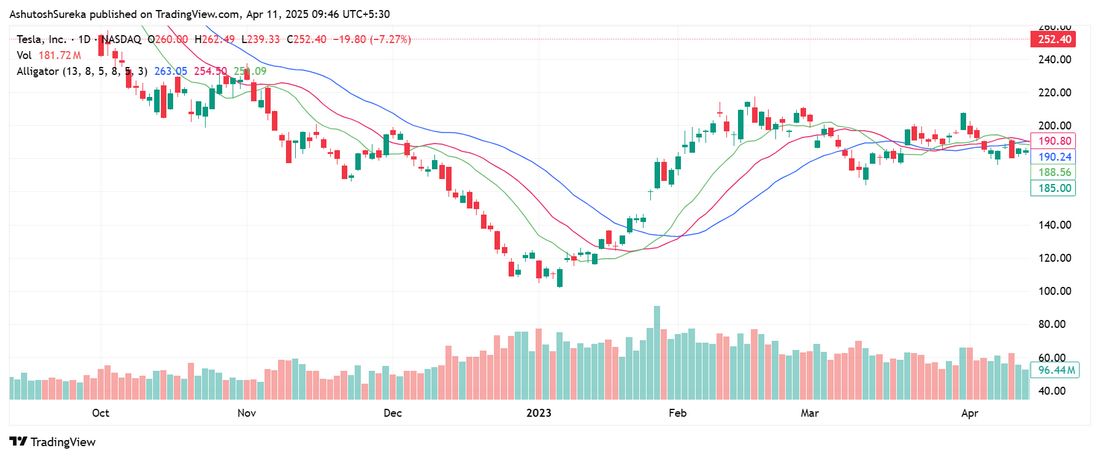
Understanding the Alligator indicator components
The indicator includes three moving averages, each with its own purpose:
Jaw (blue line). A 13-period smoothed moving average projected 8 bars forward, representing the broader market trend.
Teeth (red line). An 8-period smoothed moving average moved 5 bars ahead, indicating intermediate price direction.
Lips (green line). A 5-period smoothed moving average set 3 bars forward, capturing short-term price fluctuations.
When the lines are overlapping, it signals market consolidation. When they begin to spread apart, it suggests a developing trend. Traders using this indicator on Quotex can gain an edge by timing entries during the trend's early phase and avoiding trades when the market lacks clear direction.
Alligator indicator trading strategies for Quotex
The Alligator Indicator in Quotex becomes significantly more powerful when used alongside other tools. These combined strategies help refine entries, confirm trends, and boost overall accuracy for traders using Quotex indicators.
1. Alligator + MACD Strategy
This combination merges trend structure with momentum confirmation. A bullish MACD crossover along with an Alligator awakening, where the green line crosses above the red and blue, suggests a strong upward move. A bearish MACD crossover combined with the green line crossing below the others (known as Alligator feeding) indicates a potential downtrend. Many traders consider this one of the most reliable setups within a Quotex indicators strategy.
2. Alligator + RSI for Trend Confirmation
When used together, the RSI and Alligator indicator provide a clearer view of trend strength. If RSI moves above 70 while the Alligator shows upward alignment, it confirms strong bullish momentum. If RSI drops below 30 during a feeding phase, it suggests sustained bearish pressure. RSI values between 40 and 60 often reflect consolidation, which may be a signal to wait before acting. This combination enhances precision when trading Quotex with indicators.
3. Alligator + Bollinger Bands for Breakout Trading
Bollinger Bands help spot low-volatility periods. A squeeze pattern, followed by the Alligator lines beginning to separate, signals that a breakout may be forming. Traders typically wait for a breakout candle in the direction of the Alligator’s movement before entering. This setup works well with structured Quotex indicators settings and is often used for anticipating sharp price movements.
4. Scalping Strategy with Alligator
Scalpers using the Alligator indicator in Quotex often apply it on shorter timeframes such as the 5-minute chart. A fast crossover of the Lips (green line) over the red and blue lines, combined with momentum, provides quick entry signals. This strategy works best during periods of high volatility and is commonly used with Quotex scalping trading indicators for fast-paced execution.
How to add and configure the Alligator indicator in Quotex
To apply the Alligator indicator in Quotex, follow these steps. This setup is essential for traders looking to implement one of the best indicators in Quotex for trend identification.
Log into Quotex and open your preferred trading chart.
Select the asset you want to trade.
Click on the Indicators tab at the top of the interface.
Type “Alligator” into the search bar and select it from the list.
Use the default Quotex indicator settings (13, 8, 5), or adjust them to suit your strategy.
Apply the indicator and monitor the chart for trading signals before executing a trade.
This process ensures a seamless setup and aligns with most common Quotex indicators strategy models.
Best timeframes for the Alligator Indicator in Quotex
The Alligator indicator Quotex strategy can be used across different timeframes depending on your trading goals. Here is how to select the right timeframe for maximum effectiveness.
1-minute to 5-minute charts. Best suited for scalping and short-term momentum trades.
15-minute to 1-hour charts. Ideal for intraday and swing trading setups.
4-hour to daily charts. Recommended for long-term trend-following strategies.
Choosing the correct timeframe is crucial when applying the Alligator indicator on Quotex, especially for traders aiming to optimize performance using multi-timeframe analysis.
MACD Indicator in Quotex
The MACD indicator in Quotex (Moving Average Convergence Divergence) is a powerful momentum and trend-following tool used to assess market direction and strength. Developed by Gerald Appel, it is one of the most commonly applied Quotex indicators, helping traders identify potential reversals, entries, and exits across various market conditions.

This indicator stands out for its versatility, making it a favorite among those seeking a balanced approach to both short-term and long-term trading strategies.
Understanding the MACD indicator components
The MACD indicator consists of three essential components that provide insights into price action and momentum shifts:
MACD line. The difference between the 12-period and 26-period exponential moving averages (EMA). This line tracks the short-term momentum of price movements.
Signal line. A 9-period EMA of the MACD line. It smooths the data and helps confirm trading signals.
Histogram. A visual bar chart that shows the gap between the MACD line and the signal line. It represents the strength and direction of momentum.
By analyzing these components, traders can better interpret the market’s underlying strength and time their trades more effectively using the MACD indicator in Quotex.
How to use the MACD Indicator in Quotex
The MACD Indicator in Quotex is commonly used for identifying bullish and bearish trends, as well as potential entry and exit points.
1. MACD crossovers
Bullish crossover. Occurs when the MACD line crosses above the signal line. This is interpreted as a buy signal.
Bearish crossover. Happens when the MACD line crosses below the signal line. This is considered a sell signal.
2. Histogram analysis
Expanding bars. An increasing histogram suggests rising momentum in the current trend direction.
Shrinking bars. A narrowing histogram indicates fading momentum and could point to a reversal.
3. Zero line crossovers
MACD above zero. Signals that the market may be entering bullish territory.
MACD below zero. Suggests that bearish pressure is increasing.
MACD trading strategies in Quotex
To enhance accuracy and filter out noise, many traders combine the MACD indicator in Quotex with complementary tools like RSI and Bollinger Bands. This combination helps confirm market direction, momentum strength, and entry timing.
1. MACD + RSI (Relative Strength Index) strategy
Pairing MACD with the Relative Strength Index (RSI) improves signal strength:
When MACD shows a bullish crossover and RSI is above 50, it reinforces a buy setup.
When MACD turns bearish and RSI drops below 50, it confirms a short-selling opportunity.
This strategy is ideal for traders seeking reliable confirmation from momentum-based Quotex indicators.
2. MACD + Bollinger Bands strategy
This method works well for detecting breakouts using pattern and volatility alignment:
A buy signal forms when the MACD line crosses above the signal line and the price breaks above the upper Bollinger Band.
A sell signal occurs when the MACD line crosses below the signal line and the price drops below the lower band.
Together, MACD and Bollinger Bands help traders capture strong directional moves with added precision.
3. MACD Histogram scalping strategy
Scalpers often rely on the MACD histogram as one of the most responsive Quotex scalping trading indicators:
Entry. A buy entry is triggered when the histogram turns positive after a red phase.
Exit. Close the position when the histogram starts to shrink, signaling momentum weakening.
This strategy is especially effective on shorter timeframes like the 1-minute or 5-minute chart, where timing is critical.
4. MACD divergence strategy
Divergences between price action and the MACD line often predict market reversals:
Bullish divergence. Price forms lower lows while MACD forms higher lows, suggesting an upcoming upward reversal.
Bearish divergence. Price forms higher highs while MACD prints lower highs, hinting at a trend reversal to the downside.
This setup is widely used in both trend-following and countertrend strategies, making it a core part of many Quotex indicators strategy systems.
How to add and configure the MACD Indicator in Quotex
To apply the MACD Indicator in Quotex, follow these steps:
Log into Quotex and open your preferred trading account.
Select an asset you want to trade.
Click on the Indicators tab.
Search for and select MACD Indicator from the list.
Adjust the Quotex indicators settings by setting:
Fast EMA = 12
Slow EMA = 26
Signal Line = 9
Apply the indicator to your chart and begin analyzing trends.
Best timeframes for MACD in Quotex
1-Minute to 5-Minute Charts → Best for scalping strategies.
15-Minute to 1-Hour Charts → Ideal for day trading and swing trading.
4-Hour to Daily Charts → Works well for long-term trend-following strategies.
RSI Indicator in Quotex
The RSI (Relative Strength Index) Indicator in Quotex is a momentum oscillator that helps traders measure the strength of price movements and identify overbought or oversold conditions in the market. Developed by J. Welles Wilder, RSI is widely used in Quotex trading for spotting potential trend reversals and confirming trend strength.
Understanding the RSI indicator components
The RSI Indicator moves between 0 and 100, and its values help traders gauge whether an asset is overbought or oversold.
RSI Above 70 → The asset is overbought, and a price decline or correction is likely.
RSI Below 30 → The asset is oversold, and a price increase or bounce is likely.
RSI Between 40-60 → The market is in a neutral phase, meaning no strong trend is present.
RSI is commonly used to confirm trends, identify reversal signals, and detect divergences.
How to use the RSI Indicator in Quotex
1. Identifying overbought and oversold levels
When RSI crosses above 70, traders look for potential sell signals.
When RSI drops below 30, traders look for potential buy signals.
2. RSI trend confirmation
Beyond extremes, RSI also acts as a trend filter. In trending markets:
During an uptrend, RSI often holds above the 40–50 range, confirming sustained bullish momentum.
During a downtrend, RSI typically remains below the 50–60 zone, supporting continued bearish pressure.
A breakout above 70 in an uptrend signals strong buying momentum, while a breakdown below 30 in a downtrend confirms aggressive selling pressure.
3. RSI divergence strategy
Divergence between RSI and price action is a powerful signal for trend exhaustion.
Bullish divergence occurs when the RSI forms higher lows while the price prints lower lows. This setup hints at a potential reversal to the upside.
Bearish divergence occurs when RSI forms lower highs while the price registers higher highs, indicating weakening momentum and a possible downside shift.
This RSI divergence strategy is highly valued by experienced traders looking to anticipate turning points before they fully materialize.
RSI trading strategies in Quotex
1. RSI + Moving Averages strategy
Buy signal. When RSI is below 30, and the price crosses above a 50-period moving average, it confirms a trend reversal to the upside.
Sell signal. When RSI is above 70, and the price crosses below a 50-period moving average, it confirms a trend reversal to the downside.
2. RSI + MACD strategy
When RSI signals overbought conditions and MACD shows a bearish crossover, it confirms a strong sell signal.
When RSI signals oversold conditions and MACD shows a bullish crossover, it confirms a strong buy signal.
Combining RSI and MACD reduces false signals and improves trade accuracy.
3. RSI scalping strategy for Quotex
Quotex scalping trading indicators include RSI for short-term trades.
Best timeframes. 1-minute or 5-minute charts.
Buy trade. When RSI crosses above 30 in a strong uptrend.
Sell trade. When RSI crosses below 70 in a strong downtrend.
4. RSI + Bollinger Bands for volatility trading
When RSI is overbought and the price touches the upper Bollinger Band, it signals a potential sell trade.
When RSI is oversold and the price touches the lower Bollinger Band, it signals a potential buy trade.
How to add and configure the RSI indicator in Quotex
To apply the RSI Indicator in Quotex, follow these steps:
Log into Quotex and open your trading account.
Select an asset to trade.
Click on the Indicators tab.
Search for and select RSI Indicator.
Adjust the Quotex indicators settings:
Period: 14 (default, but can be adjusted for different strategies).
Overbought level: 70 and Oversold Level: 30.
Apply the indicator to the chart and start analyzing trends.
Best timeframes for RSI in Quotex
1-Minute to 5-Minute Charts → Ideal for scalping.
15-Minute to 1-Hour Charts → Best for day trading.
4-Hour to Daily Charts → Suitable for long-term trend analysis.
Combine indicators with context. Precision matters more than prediction

Many traders mistakenly assume that success with Quotex indicators comes from finding one perfect tool. In reality, the edge lies in understanding how indicators behave together in live conditions. MACD may signal a trend, but if RSI diverges, that could be your early warning to hold back. The Alligator helps confirm clean setups by filtering out noise. Successful Quotex traders know it’s about precision, not prediction.
Additionally, always treat indicators as assistants and not decision-makers. Indicators reflect market psychology, but without context and timing, they can mislead. A sharp trader uses tools like Bollinger Bands or histogram spikes for micro-adjustments, not overconfidence. If you seek real profits from Quotex strategies, combine discipline, pattern reading, and multi-indicator confluence instead of depending on a single magic setup.
Conclusion
Choosing the best indicator for Quotex depends on your strategy and market timing. Whether you trade short-term or follow longer trends, combining tools like MACD, RSI, and the Alligator Indicator in Quotex boosts your execution efficiency. Consistency comes from refining your indicator setup, monitoring momentum signals, and applying disciplined risk management. For traders aiming to improve results on Quotex, the right indicator strategy can mean the difference between randomness and real profits. Stay informed, test in demo mode, and continuously adapt to market behavior for optimal results.
FAQs
What is the best indicator for Quotex?
There is no single best indicator. MACD, RSI, Bollinger Bands, and Alligator are among the most effective tools, depending on market conditions and strategy.
Does Quotex offer a demo account?
Yes, Quotex provides a demo account with $10,000 in virtual funds, allowing traders to practice risk-free before using a real trading account.
Is Quotex a regulated broker?
Quotex operates under Quotex Global Limited and is regulated by IFMRRC with the number TSRF RU 0395 AA V0161.
What payment methods does Quotex support?
Quotex supports various deposit methods, including bank wire, credit and debit cards, local Indian bank accounts, and e-wallets.
Related Articles
Team that worked on the article
Mikhail Vnuchkov joined Traders Union as an author in 2020. He began his professional career as a journalist-observer at a small online financial publication, where he covered global economic events and discussed their impact on the segment of financial investment, including investor income.
Dan Blystone began his trading career in 1998 as an arbitrage clerk on the floor of the Chicago Mercantile Exchange (CME). He later traded bond and Eurex futures at proprietary firms such as Altea Trading, gaining valuable experience in high-frequency trading and risk management.
Chinmay Soni is a financial analyst with more than 5 years of experience in working with stocks, Forex, derivatives, and other assets. As a founder of a boutique research firm and an active researcher, he covers various industries and fields, providing insights backed by statistical data.
-
 Afghanistan
-
 Albania
-
 Algeria
-
 Angola
-
 Argentina
-
 Armenia
-
 Australia
-
 Austria
-
 Azerbaijan
-
 Bahamas
-
 Bahrain
-
 Bangladesh
-
 Belarus
-
 Belgium
-
 Bolivia
-
 Botswana
-
 Brazil
-
 Brunei
-
 Bulgaria
-
 Cambodia
-
 Cameroon
-
 Canada
-
 Chile
Chile
-
 China
China
-
 Colombia
-
 Congo
Congo
-
 Costa Rica
-
 Cote d'Ivoire
-
 Croatia
-
 Cuba
Cuba
-
 Cyprus
-
 Czechia
-
 DR Congo
-
 Denmark
-
 Dominican Republic
-
 Ecuador
-
 Egypt
Egypt
-
 El Salvador
-
 Estonia
-
 Eswatini
-
 Ethiopia
-
 Finland
-
 France
-
 Georgia
-
 Germany
-
 Ghana
Ghana
-
 Greece
-
 Haiti
Haiti
-
 Hong Kong
-
 Hungary
-
 India
India
-
 Indonesia
-
 Iran, Islamic republic
-
 Iraq
Iraq
-
 Ireland
-
 Israel
-
 Italy
Italy
-
 Jamaica
-
 Japan
Japan
-
 Jordan
-
 Kazakhstan
-
 Kenya
Kenya
-
 Korea
Korea
-
 Kuwait
-
 Kyrgyzstan
-
 Laos
Laos
-
 Latvia
-
 Lebanon
-
 Lesotho
-
 Libya
Libya
-
 Lithuania
-
 Luxembourg
-
 Madagascar
-
 Malaysia
-
 Malta
Malta
-
 Mauritius
-
 Mexico
-
 Moldova
-
 Mongolia
-
 Montenegro
-
 Morocco
-
 Mozambique
-
 Myanmar
-
 Namibia
-
 Nepal
Nepal
-
 Netherlands
-
 New Zealand
-
 Nigeria
-
 North Macedonia
-
 Norway
-
 Oman
Oman
-
 Pakistan
-
 Palestine
-
 Panama
-
 Papua New Guinea
-
 Paraguay
-
 Peru
Peru
-
 Philippines
-
 Poland
-
 Portugal
-
 Puerto Rico
-
 Qatar
Qatar
-
 Reunion
-
 Romania
-
 Rwanda
-
 Saudi Arabia
-
 Serbia
-
 Singapore
-
 Slovakia
-
 Slovenia
-
 Somalia
-
 South Africa
-
 Spain
Spain
-
 Sri Lanka
-
 Sweden
-
 Switzerland
-
 Syria
Syria
-
 Taiwan
-
 Tajikistan
-
 Tanzania
-
 Thailand
-
 Trinidad and Tobago
-
 Tunisia
-
 Turkey
-
 UAE
UAE
-
 Uganda
-
 Ukraine
-
 United Kingdom
-
United States
-
 Uruguay
-
 Uzbekistan
-
 Venezuela
-
 Vietnam
-
 Yemen
Yemen
-
 Zambia
-
 Zimbabwe
- Forex
- Crypto
