Quotex Trading Charts: Analysis, Patterns And Strategies


Editorial Note: While we adhere to strict Editorial Integrity, this post may contain references to products from our partners. Here's an explanation for How We Make Money. None of the data and information on this webpage constitutes investment advice according to our Disclaimer.
A trading chart on Quotex helps traders study price movements, patterns, and trends. By reading live data and using indicators, traders can find entry and exit points with more confidence. Different charts on Quotex support various trading styles, including candle charts, OTC charts, and TradingView charts. Understanding how these charts work improves strategy and risk control.
Trading charts on Quotex give traders a clear view of market behavior through price data, trend movement, and technical indicators. Whether you use a chart for live trading, pattern analysis, or strategy development, understanding its structure supports better decision making. These charts help traders read signals, predict changes, and build stronger trading plans across different market conditions.
Understanding Quotex trading charts


A trading chart on Quotex shows how an asset’s price changes over time. It gives traders real market data, including highs, lows, and price direction, which helps them understand where the market may move next. These charts support different timeframes, from one minute to daily views, so both fast and slow trading styles are possible.
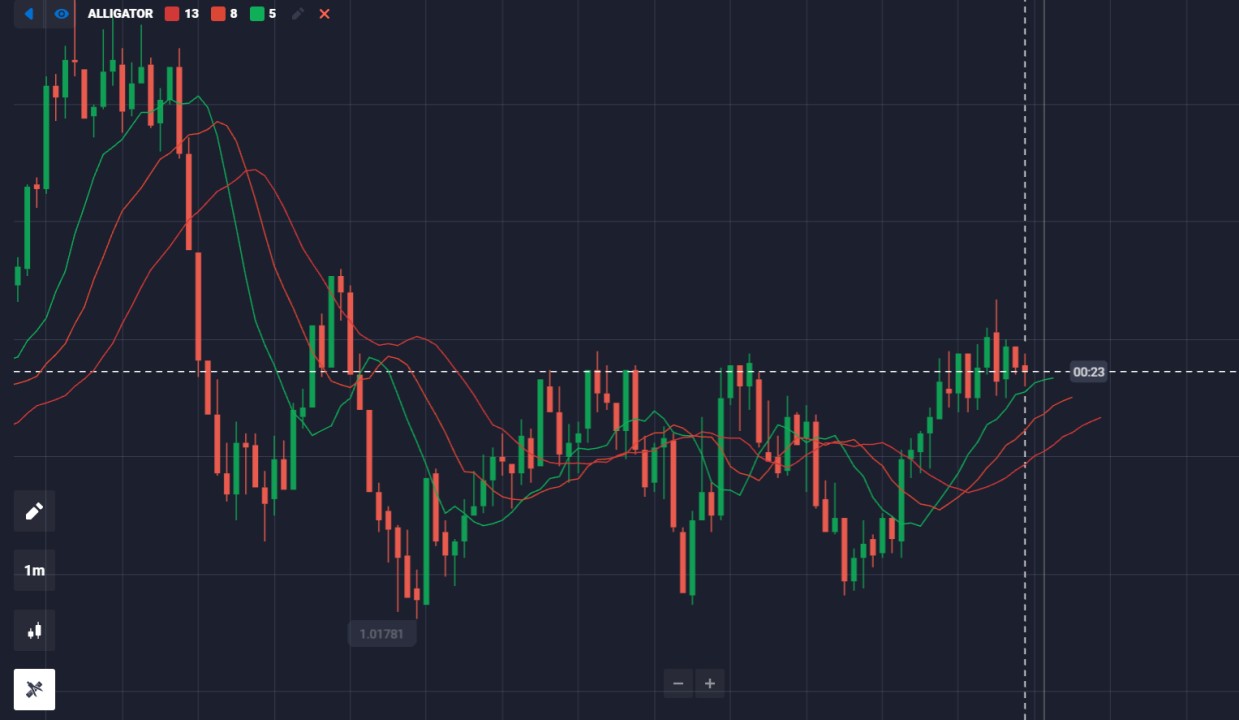
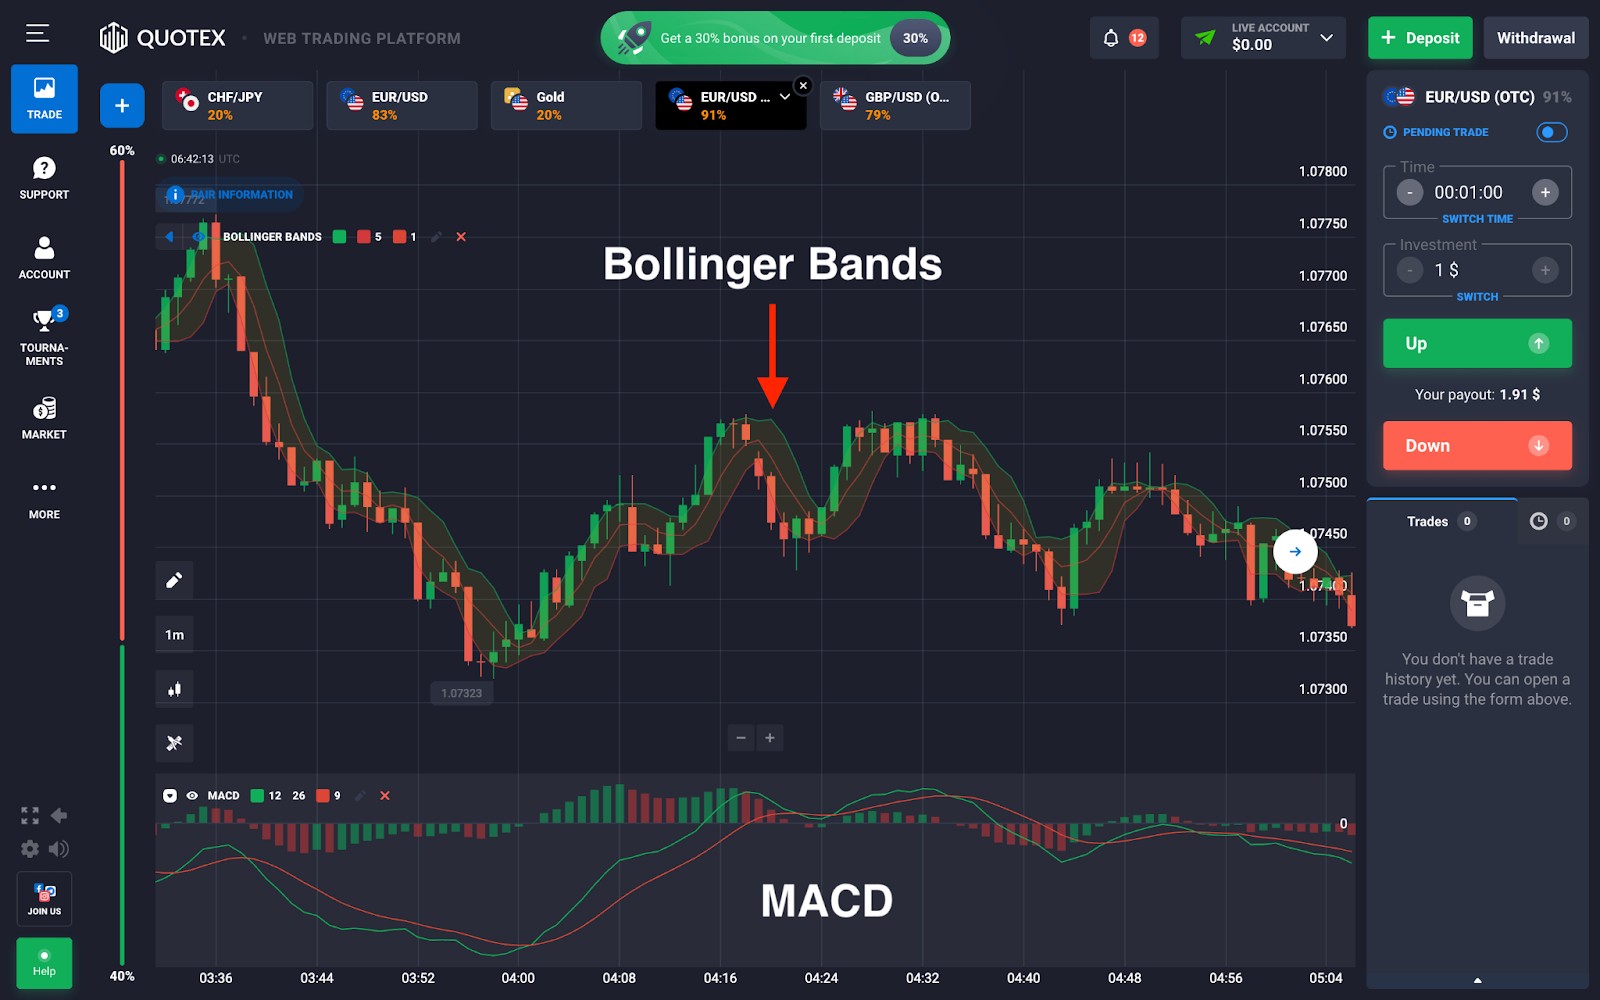
Reading these movements helps traders judge trend strength, possible reversals, and important price zones. Indicators like moving averages, RSI, and Bollinger Bands make chart analysis on Quotex more accurate by confirming signals and showing momentum. With consistent practice, traders learn to interpret charts more confidently and refine their strategies.
Quotex live chart: how to read market data?
A live chart on Quotex shows real time price movement and helps traders understand how the market reacts at each moment. It displays candles or line graphs that show how price changes within the selected timeframe.
When reading a trading chart on Quotex, start by checking the overall trend. An uptrend forms when price makes higher highs and higher lows, while a downtrend forms when price makes lower highs and lower lows. Support and resistance levels also show where price often bounces or breaks through.
Indicators such as RSI, MACD, and Bollinger Bands add more detail. RSI reflects momentum, MACD highlights changes in direction, and Bollinger Bands show volatility. Using these tools together helps traders make better timed trading decisions.
Quotex demo chart: practice without risks
A demo chart on Quotex lets traders practice without using real money. This feature simulates real market conditions, allowing users to test strategies and refine their skills.
Beginners benefit from using a demo chart on Quotex because it helps them understand different chart types, apply indicators, and experiment with various strategies before transitioning to live trading.
Types of Quotex charts: which one is best for trading?

Different charts on Quotex suit different trading needs. Some provide simple price views, while others show deeper technical structures. Choosing the right chart depends on the trader’s style, timeframe, and strategy.
Short term traders often prefer fast moving formats with clear candle data. Long term traders may use broader views to study trend strength and market behavior. Understanding how each chart works helps traders improve accuracy and find better entry points across changing conditions.
Quotex candle chart: the most popular chart type
A candle chart on Quotex displays price movements using candlestick formations. Each candle represents a set timeframe, showing the open, close, high, and low prices within that period.
Candlestick patterns like Doji, Hammer, and Engulfing help traders predict market trends. Mastering these patterns enhances chart analysis on Quotex and improves trade execution.
Quotex OTC chart: understanding off-market trading
An OTC chart on Quotex represents off-market trading that occurs outside standard trading hours. These charts are commonly used for weekend trading or in less liquid markets.
Since OTC trading involves lower liquidity and higher volatility, traders need to adjust their strategies accordingly. Risk management is essential when using an OTC chart to avoid unexpected market movements. In the Quotex OTC market, price movements on these charts are generated by an internal algorithm rather than real exchange liquidity, which makes understanding synthetic behavior and timing especially important for effective off-market trading.
Quotex TradingView chart: advanced market analysis
A TradingView chart on Quotex gives traders access to advanced tools for deeper technical analysis. By using TradingView features, traders can add multiple indicators, draw trendlines, compare assets, and study long term patterns with greater detail. This setup is useful for traders who want more precision than basic chart tools can offer.
Working with a TradingView chart helps traders refine forecasts, test strategies, and understand complex movements. The broader view and added functions support stronger decisions, especially for those who rely on technical setups.
Chart patterns and analysis on Quotex
Chart patterns help traders understand price behavior and forecast market direction. These formations show when price may break out, reverse, or continue trending. When combined with indicators, patterns create reliable signals that support more accurate trading choices.
Studying charts on Quotex teaches traders how to recognize these structures and apply them in real trading. With practice, patterns become easier to spot, allowing traders to react early and improve timing across different market conditions.
Quotex chart patterns: how to spot trading signals?
Spotting signals on a chart on Quotex requires understanding common formations such as Head and Shoulders, Double Bottom, and Triangle patterns. These structures show when prices may reverse or continue in the same direction. A Head and Shoulders pattern often signals a shift from an uptrend to a downtrend, while a Double Bottom suggests a possible rise after two strong lows. Triangle patterns show consolidation before a breakout.
To improve accuracy on Quotex, traders often study a chart pattern book and combine pattern reading with indicators like RSI or MACD. This makes timing easier and helps traders enter the market before major moves occur.
Quotex candle chart patterns: candlestick strategy guide
Candlestick formations on a chart give traders clear signals about market momentum. Patterns like Bullish Engulfing, Morning Star, or Evening Star help identify moments when the market may shift direction. These patterns highlight buyer strength, seller pressure, or indecision.
By pairing candle patterns with indicators such as moving averages or trendlines, chart analysis on Quotex becomes more reliable. This approach helps traders confirm signals, reduce risk, and make better entry and exit decisions.
Quotex chart analysis: tools and indicators
Successful trading requires the use of technical tools. Trading charts on Quotex offer a variety of indicators that help traders make data-driven decisions.
The platform offers trend indicators such as Moving Averages and MACD, momentum tools like RSI and Stochastic, and volatility measures including Bollinger Bands and ATR. Quotex also includes drawing tools such as support and resistance lines, trendlines, and Fibonacci levels for manual chart analysis.
By combining different tools, traders can gain deeper market insights and improve their accuracy. Selecting the right indicators is key to enhancing your trading strategy.
Quotex chart in trading strategy: best approaches
Any trading chart being used as a part of a trading strategy should support clear planning and risk control. Trendlines help traders see market direction, Fibonacci retracements mark possible reversal areas, and moving averages smooth price activity for easier reading. These tools guide traders on when to enter or exit the market.
Using structured analysis improves timing and reduces emotional decisions. When indicators, patterns, and chart tools work together, traders gain stronger confidence and clearer signals. This approach helps turn market data into a practical and reliable strategy.
Quotex money management chart: risk control techniques
A money management chart on Quotex helps traders control exposure and protect their balance. It guides users on setting stop loss levels, deciding position sizes, and managing risk during volatile moments. Using this structured approach prevents large losses and supports long term stability.
Good money management keeps traders active in the market for longer. By limiting risk per trade and following a consistent plan, traders can handle volatility more effectively and improve overall performance.
As traders grow more comfortable reading charts and testing strategies, many also look at suggestions of the top binary options brokers to see where similar chart analysis can be applied. Comparing brokers helps place chart skills into a wider trading context beyond a single platform. This step supports better decisions before committing real funds to live trading.
| CloseOption | Capitalcore | Nadex | Pocket Option | QUOTEX | |
|---|---|---|---|---|---|
|
Foundation year |
2013 | 2019 | 2009 | 2017 | 2019 |
|
Min. deposit |
5 | 10 | 250 | 5 | 10 |
|
Min. trade size |
1 | 1 | 1 | 1 | 1 |
|
Min. Payout (%) |
17 | 60 | No | 50 | 20 |
|
Max. Payout (%) |
95 | 90 | 100 | 128 | 98 |
|
Demo |
Yes | Yes | Yes | Yes | Yes |
|
Copy trading |
No | No | No | Yes | No |
|
Open an account |
Go to broker Your capital is at risk. |
Go to broker Your capital is at risk.
|
Study review | Go to broker Your capital is at risk. |
Go to broker Your capital is at risk. |
Stay patient, practice first, and follow your plan

I have learned that a clear mindset often matters more than any indicator on the chart. When I study a trading chart on Quotex, I remind myself to stay patient and avoid reacting to every small move. Many traders lose money because they enter trades too quickly or change their plan out of fear or excitement. I try to keep my strategy simple and follow it with discipline.
I always suggest starting with a demo account. It helped me understand how price moves and how different patterns behave during quiet and volatile periods. Even when I switched to live trading, I used small positions so I could stay calm and make clearer decisions. I also track my trades in a journal. Writing down why I entered and how the trade ended has improved my performance more than any single tool.
Conclusion
Understanding different chart types is essential for improving trading results. Whether you use a trading chart, a candle chart, or an OTC chart on Quotex, each option helps you read price movement and plan trades with more confidence. Chart analysis on Quotex helps in recognizing patterns, and using the right indicators, traders can build stronger strategies and reduce unnecessary risks.
A consistent routine makes a big difference. Practicing on a demo chart on Quotex, studying patterns, and following a structured plan support long term growth in the market. With patience and discipline, traders can use chart analysis to improve timing, understand trends, and make more informed decisions across changing market conditions.
FAQs
What is the best chart type for beginners on Quotex?
Many beginners find the candle chart on Quotex easiest to read because it clearly shows price movement, momentum, and turning points. It helps new traders learn patterns and understand market direction.
How can I practice chart analysis without risking money?
You can use a demo chart on Quotex, which lets you test strategies and study price behavior in real market conditions without any financial risk.
Can TradingView tools improve my analysis on Quotex?
Yes. Working with a TradingView chart on Quotex gives you access to more indicators and drawing tools, helping you perform deeper technical analysis and refine your strategy.
How do I manage risk when using Quotex charts?
A money management chart on Quotex helps you plan position sizes and stop loss levels. Using this structure reduces emotional decisions and protects your balance during volatile periods.
Related Articles
Team that worked on the article
Alamin Morshed is a contributor at Traders Union. He specializes in writing articles for businesses that want to improve their Google search rankings to compete with their competition.
Dan Blystone began his trading career in 1998 as an arbitrage clerk on the floor of the Chicago Mercantile Exchange (CME). He later traded bond and Eurex futures at proprietary firms such as Altea Trading, gaining valuable experience in high-frequency trading and risk management.
Chinmay Soni is a financial analyst with more than 5 years of experience in working with stocks, Forex, derivatives, and other assets. As a founder of a boutique research firm and an active researcher, he covers various industries and fields, providing insights backed by statistical data.
-
 Afghanistan
-
 Albania
-
 Algeria
-
 Angola
-
 Argentina
-
 Armenia
-
 Australia
-
 Austria
-
 Azerbaijan
-
 Bahamas
-
 Bahrain
-
 Bangladesh
-
 Belarus
-
 Belgium
-
 Bolivia
-
 Botswana
-
 Brazil
-
 Brunei
-
 Bulgaria
-
 Cambodia
-
 Cameroon
-
 Canada
-
 Chile
Chile
-
 China
China
-
 Colombia
-
 Congo
Congo
-
 Costa Rica
-
 Cote d'Ivoire
-
 Croatia
-
 Cuba
Cuba
-
 Cyprus
-
 Czechia
-
 DR Congo
-
 Denmark
-
 Dominican Republic
-
 Ecuador
-
 Egypt
Egypt
-
 El Salvador
-
 Estonia
-
 Eswatini
-
 Ethiopia
-
 Finland
-
 France
-
 Georgia
-
 Germany
-
 Ghana
Ghana
-
 Greece
-
 Haiti
Haiti
-
 Hong Kong
-
 Hungary
-
 India
India
-
 Indonesia
-
 Iran, Islamic republic
-
 Iraq
Iraq
-
 Ireland
-
 Israel
-
 Italy
Italy
-
 Jamaica
-
 Japan
Japan
-
 Jordan
-
 Kazakhstan
-
 Kenya
Kenya
-
 Korea
Korea
-
 Kuwait
-
 Kyrgyzstan
-
 Laos
Laos
-
 Latvia
-
 Lebanon
-
 Lesotho
-
 Libya
Libya
-
 Lithuania
-
 Luxembourg
-
 Madagascar
-
 Malaysia
-
 Malta
Malta
-
 Mauritius
-
 Mexico
-
 Moldova
-
 Mongolia
-
 Montenegro
-
 Morocco
-
 Mozambique
-
 Myanmar
-
 Namibia
-
 Nepal
Nepal
-
 Netherlands
-
 New Zealand
-
 Nigeria
-
 North Macedonia
-
 Norway
-
 Oman
Oman
-
 Pakistan
-
 Palestine
-
 Panama
-
 Papua New Guinea
-
 Paraguay
-
 Peru
Peru
-
 Philippines
-
 Poland
-
 Portugal
-
 Puerto Rico
-
 Qatar
Qatar
-
 Reunion
-
 Romania
-
 Rwanda
-
 Saudi Arabia
-
 Serbia
-
 Singapore
-
 Slovakia
-
 Slovenia
-
 Somalia
-
 South Africa
-
 Spain
Spain
-
 Sri Lanka
-
 Sweden
-
 Switzerland
-
 Syria
Syria
-
 Taiwan
-
 Tajikistan
-
 Tanzania
-
 Thailand
-
 Trinidad and Tobago
-
 Tunisia
-
 Turkey
-
 UAE
UAE
-
 Uganda
-
 Ukraine
-
 United Kingdom
-
United States
-
 Uruguay
-
 Uzbekistan
-
 Venezuela
-
 Vietnam
-
 Yemen
Yemen
-
 Zambia
-
 Zimbabwe
- Forex
- Crypto
