The Best Chart Patterns For Binary Options Trading


Editorial Note: While we adhere to strict Editorial Integrity, this post may contain references to products from our partners. Here's an explanation for How We Make Money. None of the data and information on this webpage constitutes investment advice according to our Disclaimer.
In short, there can be no one and best pattern to trade. If only because, by changing timeframes, some patterns can transform into others in the same market. However, since binary options trading allows for short-term trades, momentum trading can be a rational approach. Therefore, pay attention to:
trend continuation patterns such as (triangle breakouts and flags) to find entry points
trend reversal patterns (such as head and shoulders) can serve as aids in the overall assessment of the market behavior
Chart patterns show what people think about prices on the charts. Binary options traders use these patterns to analyze where prices might go, which helps them make smart choices.
Traders can use chart patterns such as head and shoulders or triangles to get a better idea of which trend is prevailing. They mix this knowledge with other tools to make better decisions. It's like a useful guide to understanding what's going on in the market.
How to Trade Binary Options Using Chart Patterns
Chart patterns are your reliable compass in trading, guiding you through volatility. To effectively utilize these patterns, understanding two key concepts is vital: Technical Analysis and Market Psychology.
Technical Analysis acts as your analytical tool, dissecting the market through price and volume data, with trendlines revealing directional paths, support/resistance zones anticipating breakouts, and indicators emphasizing price action
Market Psychology at the core, interprets chart patterns as imprints of emotions like fear and greed. Recognizing trends as either continuations or reversals reflects the control of buyers or sellers while acknowledging false signals due to market unpredictability requires confirmation from other tools and context. Mastering these basics elevates chart patterns from visuals to invaluable insights for informed trading decisions
Trend Continuation Binary Options Chart Patterns
Exploring trend continuation chart patterns is vital for traders engaging in binary options, particularly when focusing on breakouts. These patterns offer valuable insights into the market dynamics, helping traders make informed decisions. Here are a few examples of breakout patterns:
Triangle Breakout
A strong continuation pattern is when a triangle breaks out. Triangles happen when the price moves between converging lines, showing a temporary pause. Breaking out of the triangle, whether it goes up, down, or stays even, means the old trend is starting again. Traders can use this pattern to guess and benefit from a steady price movement.
Flag Breakout
Flags are small rectangles that show up after a big price move, like a flagpole. Breaking out of a flag pattern means a short break in the market before the main trend continues. Figuring out and trading the flag breakout lets binary options traders match their positions with the overall market direction.
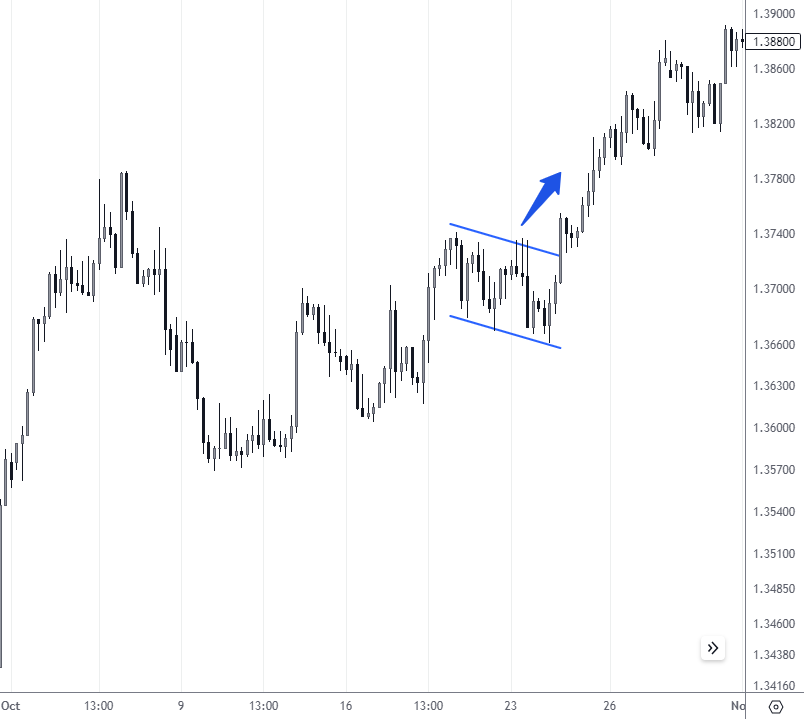 Bullish Flag Breakout
It is believed that if a candlestick closes above the flag, it should be taken as a signal to enter a position: either immediately or a little later in anticipation of a test of the pattern breakout level.
Pennant Breakout
Pennants are like flags but have a small triangle shape. Breaking out from a pennant pattern shows the ongoing trend will keep going. Binary options traders can smartly use the pennant breakout to make trades that go along with the current market feeling, making it more likely for trades to succeed.
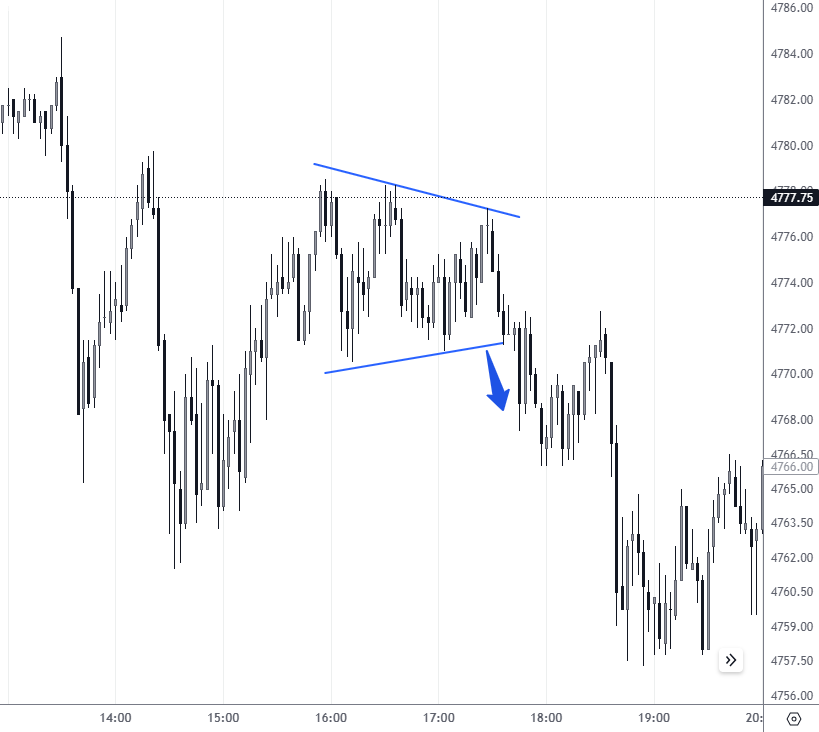 Example of a bearish triangle breakdown
You can enter the position at the moment of the triangle breakdown (more aggressive approach), or wait for its test (more conservative option).
Knowing these patterns helps binary options traders navigate breakouts more accurately and confidently.
Best binary options brokers


Trend Reversal Binary Options Chart Patterns
Identifying trend reversals using chart patterns is a vital skill for binary options traders, offering a chance to predict market shifts before they happen. Some widely recognized trend reversal patterns include:
Double Top/Bottom
This pattern occurs when the price forms two consecutive peaks (double top) or valleys (double bottom) of nearly the same height, separated by a trough (top) or a rally (bottom). Breaking below the support for a double top or above the resistance for a double bottom suggests a potential reversal. Additional confirmation may come from bearish/bullish signals like divergence or changes in volume.
Head and Shoulders
Shaped like a head with two smaller shoulders on either side, this pattern appears in an uptrend (head and shoulders) or downtrend (inverted head and shoulders).
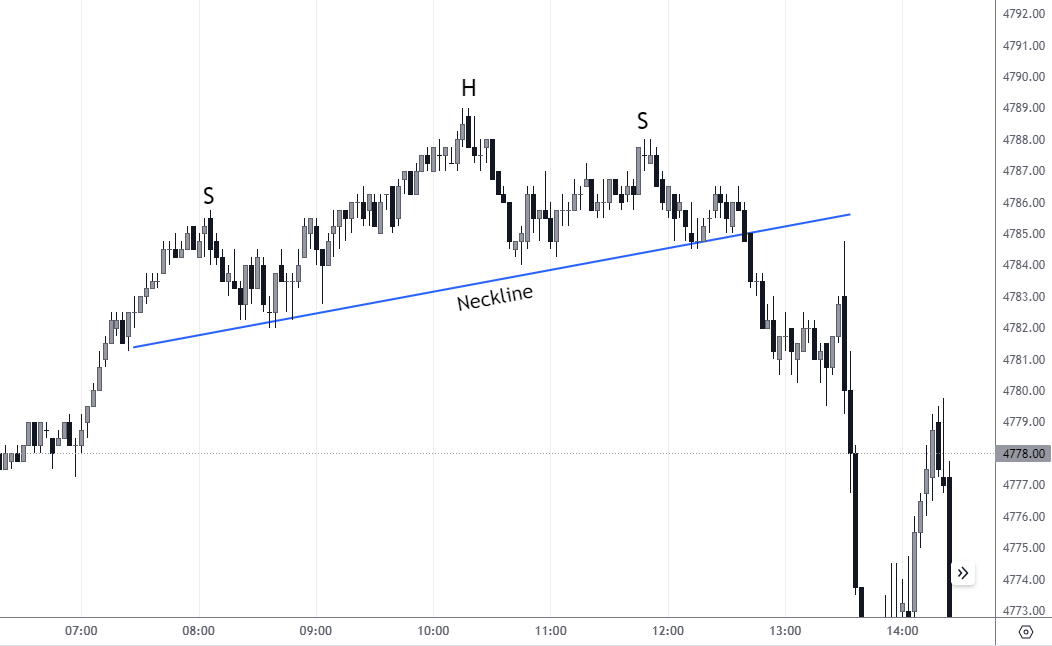 Head and Shoulders
The neckline, drawn across the lows of the shoulders, becomes a crucial reference point. A break below the neckline in an uptrend or above it in a downtrend signals the start of a reversal.
Engulfing Patterns
These patterns emerge when a large candlestick entirely engulfs a smaller, differently colored candlestick. A bullish engulfing pattern appears in a downtrend, while a bearish engulfing pattern arises in an uptrend. These patterns indicate significant buying/selling pressure, suggesting a potential reversal.
Tips for Trading Binary Options Using Chart Patterns
When dealing with binary options and chart patterns, it's advisable to approach them with caution. Here are straightforward tips to enhance your trading:
Exercise Patience
In binary options, avoid the urge to seek quick wealth. Take your time and make informed decisions. Prioritize steady success over quick gainsDevelop a Trading Plan
Create a plan for your trading activities. Define your goals and assess your risk tolerance. A well-defined plan helps maintain focus, covering entry and exit points, risk management, and market analysis.Manage Risks Thoughtfully
Being mindful of risks is crucial. Determine the amount you are comfortable losing in each trade. Implement stop-loss orders to limit potential losses. Additionally, diversify your investments to spread risk across multiple trades.
Follow these simple tips, and you can enhance your binary options trading experience, creating a more intentional and strategic journey toward success. If you're just starting with binary options and need a thorough guide to begin, take a look at this helpful article - How to Start Binary Options Trading in 7 Simple Steps. This article offers a straightforward and clear roadmap to guide you through the initial stages of binary options trading.
Conclusion
The study of patterns allows:
Firstly, to fragment the market, to give it a structure you can understand
Secondly, to make trading decisions and find rational entry points
Together with a competent risk management strategy, trading chart patterns can become the key to success in your career in the binary options market.
FAQs
What are the patterns in binary options?
Binary options patterns act as guides in trading. These recurring formations on price charts unveil potential market movements and fall into categories such as continuation patterns, reversal patterns, and breakout patterns. Savvy traders leverage these patterns to make informed decisions on entering or exiting a trade, enhancing their ability to predict market movements and capitalize on profitable opportunities.
How do you analyze binary options charts?
Analyzing binary options charts involves researching historical price data to uncover patterns, trends, and potential reversals. Traders use technical analysis tools like indicators and oscillators to assess market conditions. A comprehensive approach also includes fundamental analysis, considering external factors influencing asset values. By combining these analyses, traders gain valuable insights into optimal entry and exit points, empowering them to make informed decisions and maximize profitability.
How do you predict binary options trading?
Making accurate predictions in binary options trading requires a thorough approach. Traders use a mix of technical and fundamental analyses to carefully study historical price changes, chart patterns, and market indicators. Moreover, economic indicators, news events, and geopolitical factors are vital in decision-making. Efficient risk management strategies, such as setting stop-loss and take-profit levels, are crucial for predicting and skillfully managing trades.
Are trading chart patterns profitable?
Whether trading chart patterns is profitable is a complex question with no clear answer. To increase the probability of profit when trading binary options on patterns, study different timeframes, do not take excessive risks, and be aware of fundamental events.
Editors' Top Picks and Insights

Crypto test drive: How automakers are exploring digital assets

Lindsey Graham death: U.S. senator’s crypto legacy

Tether under pressure: USDT in Europe, audit questions, and the fight for trust

Lean Ethereum: Why Buterin wants to rebuild the network

SK Hynix debuts on Nasdaq: Largest U.S. offering by foreign company

SpaceX falls out of orbit: Does anyone still want Musk’s stock?
Related Articles
Team that worked on the article
Upendra Goswami is a full-time digital content creator, marketer, and active investor. As a creator, he loves writing about online trading, blockchain, cryptocurrency, and stock trading.
Dr. BJ Johnson is a PhD in English Language and an editor with over 15 years of experience. He earned his degree in English Language in the U.S and the UK.
Mirjan Hipolito is a journalist and news editor at Traders Union. She is an expert crypto writer with five years of experience in the financial markets.
Binary options trading is a financial trading method where traders speculate on the price movement of various assets, such as stocks, currencies, or commodities, by predicting whether the price will rise or fall within a specified time frame, often as short as a few minutes. Unlike traditional trading, binary options have only two possible outcomes: a fixed payout if the trader's prediction is correct or a loss of the invested amount if the prediction is wrong.
Cryptocurrency is a type of digital or virtual currency that relies on cryptography for security. Unlike traditional currencies issued by governments (fiat currencies), cryptocurrencies operate on decentralized networks, typically based on blockchain technology.
Options trading is a financial derivative strategy that involves the buying and selling of options contracts, which give traders the right (but not the obligation) to buy or sell an underlying asset at a specified price, known as the strike price, before or on a predetermined expiration date. There are two main types of options: call options, which allow the holder to buy the underlying asset, and put options, which allow the holder to sell the underlying asset.
Index in trading is the measure of the performance of a group of stocks, which can include the assets and securities in it.
Forex trading, short for foreign exchange trading, is the practice of buying and selling currencies in the global foreign exchange market with the aim of profiting from fluctuations in exchange rates. Traders speculate on whether one currency will rise or fall in value relative to another currency and make trading decisions accordingly. However, beware that trading carries risks, and you can lose your whole capital.

-
 Afghanistan
-
 Albania
-
 Algeria
-
 Angola
-
 Argentina
-
 Armenia
-
 Australia
-
 Austria
-
 Azerbaijan
-
 Bahamas
-
 Bahrain
-
 Bangladesh
-
 Belarus
-
 Belgium
-
 Bolivia
-
 Botswana
-
 Brazil
-
 Brunei
-
 Bulgaria
-
 Cambodia
-
 Cameroon
-
 Canada
-
 Chile
Chile
-
 China
China
-
 Colombia
-
 Congo
Congo
-
 Costa Rica
-
 Cote d'Ivoire
-
 Croatia
-
 Cuba
Cuba
-
 Cyprus
-
 Czechia
-
 DR Congo
-
 Denmark
-
 Dominican Republic
-
 Ecuador
-
 Egypt
Egypt
-
 El Salvador
-
 Estonia
-
 Eswatini
-
 Ethiopia
-
 Finland
-
 France
-
 Georgia
-
 Germany
-
 Ghana
Ghana
-
 Greece
-
 Haiti
Haiti
-
 Hong Kong
-
 Hungary
-
 India
India
-
 Indonesia
-
 Iran, Islamic republic
-
 Iraq
Iraq
-
 Ireland
-
 Israel
-
 Italy
Italy
-
 Jamaica
-
 Japan
Japan
-
 Jordan
-
 Kazakhstan
-
 Kenya
Kenya
-
 Korea
Korea
-
 Kuwait
-
 Kyrgyzstan
-
 Laos
Laos
-
 Latvia
-
 Lebanon
-
 Lesotho
-
 Libya
Libya
-
 Lithuania
-
 Luxembourg
-
 Madagascar
-
 Malaysia
-
 Malta
Malta
-
 Mauritius
-
 Mexico
-
 Moldova
-
 Mongolia
-
 Montenegro
-
 Morocco
-
 Mozambique
-
 Myanmar
-
 Namibia
-
 Nepal
Nepal
-
 Netherlands
-
 New Zealand
-
 Nigeria
-
 North Macedonia
-
 Norway
-
 Oman
Oman
-
 Pakistan
-
 Palestine
-
 Panama
-
 Papua New Guinea
-
 Paraguay
-
 Peru
Peru
-
 Philippines
-
 Poland
-
 Portugal
-
 Puerto Rico
-
 Qatar
Qatar
-
 Reunion
-
 Romania
-
 Rwanda
-
 Saudi Arabia
-
 Serbia
-
 Singapore
-
 Slovakia
-
 Slovenia
-
 Somalia
-
 South Africa
-
 Spain
Spain
-
 Sri Lanka
-
 Sweden
-
 Switzerland
-
 Syria
Syria
-
 Taiwan
-
 Tajikistan
-
 Tanzania
-
 Thailand
-
 Trinidad and Tobago
-
 Tunisia
-
 Turkey
-
 UAE
UAE
-
 Uganda
-
 Ukraine
-
 United Kingdom
-
United States
-
 Uruguay
-
 Uzbekistan
-
 Venezuela
-
 Vietnam
-
 Yemen
Yemen
-
 Zambia
-
 Zimbabwe
- Forex
- Crypto
