Binary Options Trend Analysis


Editorial Note: While we adhere to strict Editorial Integrity, this post may contain references to products from our partners. Here's an explanation for How We Make Money. None of the data and information on this webpage constitutes investment advice according to our Disclaimer.
The tools helpful in identifying trends in binary options include
Moving averages - Clear insights into prevailing trend
MACD - Signals the strength of the trend through histogram
Fibonacci retracement - Provides retracement levels within the trend
Elliott Wave Theory - Splits the macro trend into micro price waves
Bollinger Bands - Incorporates volatility insights into trend judgment
Trend analysis can turn out to be a key factor for your trading strategy. This skill empowers traders to anticipate market movements, something that they can't afford to overlook in binary options trading. In this article, the experts at TU will discuss the art of trend identification, explore advanced techniques, and introduce essential strategies.
What are the three types of trends?
Uptrend
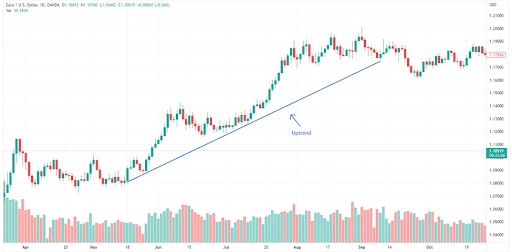
An uptrend is recognized by a series of higher highs and higher lows in the price of an asset. This pattern indicates that the market sentiment is positive, and the stock’s value is generally increasing over time. Uptrends can last for longer durations, from a few weeks. to as long as a year.
Downtrend
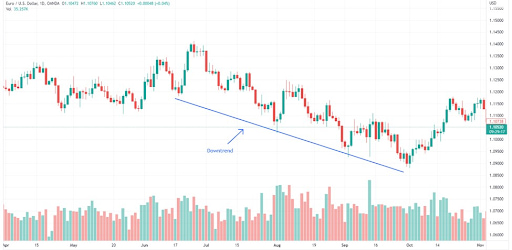
In contrast to an uptrend, a downtrend is marked by lower highs and lower lows in the asset’s price. This signifies a negative market sentiment, with the asset’s value gradually decreasing.
Sideways Trend
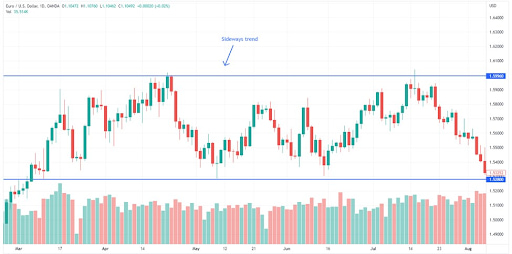
Also known as a horizontal trend, a sideways trend occurs when there is little change in the price movement of an asset. This typically happens when the supply and demand for the asset art in balance. Sideways trends can be observed during periods of price consolidation, before a significant price trend begins or after a price reversal. Traders can benefit from sideways trends by using strategies such as placing stop-loss orders near support or resistance levels or looking for breakout and breakdown opportunities. Learn more how to trade lower highs and higher lows in binary options. If you are interested in how to trade binary options using trend continuation patterns, read the Traders Union article.
Identifying trends with technical indicators
The following indicators are widely used for identification of trends in binary options trading
Moving Averages (MAs)
MAs calculate the average price of an asset over a specific period, which helps smooth out short-term price fluctuations and rival the longer-term price trend. Traders can adjust the time period of the indicator to suit their trading style, with options ranging from short periods of few minutes to longer periods like several weeks.
Types Of Moving Averages
There are several types of MAs used in binary options trading, including
Simple Moving Average (SMA) – This type calculates the average price over a given period by summing up all closing prices and dividing by the number of periods. While it is straightforward, it puts equal emphasis on all prices in the range, which some traders find less detailed.
Weighted Moving Average (WMA) – WMA addresses the SMA's issues by assigning different weights to prices. It gives more importance to recent prices, making it more responsive to short-term trends. However, it can still lead to false signals.
Exponential Moving Average (EMA) – EMA also assigns different weights to prices but does so in a more sophisticated manner. It uses an exponential smoothing constant to weigh recent prices more heavily. Like WMA, EMA is sensitive to short-term fluctuations.
Moving Average strategies and tactics
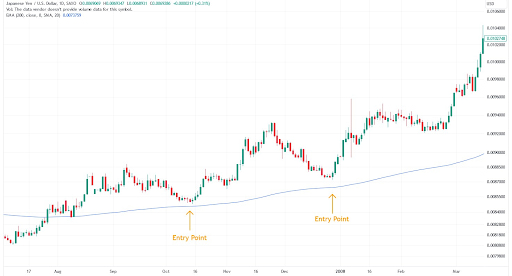
When using moving averages, an uptrend is identified when the moving average is rising and the price is above it. Conversely, a downtrend is identified when the moving average is falling and the price is below it. The moving average crossovers, where short-term and long-term MAs intersect, can signal trend reversals. Also, moving averages can help identify dynamic support and resistance levels. When the price approaches the MA but does not cross it, it can act as a dynamic support or resistance, constantly adjusting based on recent price action.
Moving Average Convergence Divergence (MACD)
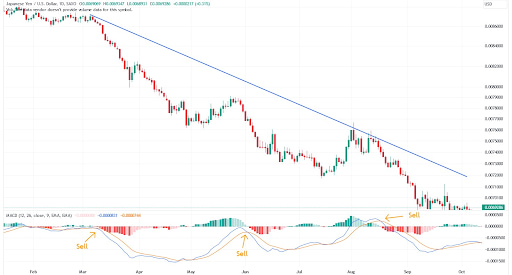
MACD helps traders look out for potential changes in market trends and assesses the strength of existing trends. It uses two Exponential Moving Averages (EMAs) to measure market conditions and has three key elements
MACD Line – This is calculated by subtracting a short-term EMA (like 12 days) from a long-term EMA (i.e 26 days).
Signal Line – A 9-day EMA of the MACD line.
Histogram – This visualizes the difference between the MACD line and the signal line.
Types of MACD signals
Crossovers
Buy Signal – When the MACD line crosses above the signal line, it's seen as a bullish signal, suggesting an upward trend. Sell Signal – Conversely, when the MACD line crosses below the signal line, it's a bearish signal, indicating a possible downward trend.Zero Line
MACD above zero is bullish, indicating that the short-term EMA is moving higher than the long-term EMA. MACD below zero is bearish, showing that short-term EMA is moving lower than the long-term EMA.Divergence
Occurs when the price's movement doesn't match the MACD indicator. Bullish divergence occurs when prices make lower lows, but the MACD makes higher lows, and vice versa for bearish divergence.
MACD strategies and tactics
There are several indicators that can be used along with MACD, which the experts have discussed as follows
| Strategy Name | Description |
|---|---|
| MACD 0 Line Crossover | Look for MACD line crossovers. A bullish crossover (from negative to positive) signals a trade opportunity. However, exercise caution as crossovers don't always indicate a complete trend reversal. |
| MACD Signal Crossover | Observe the MACD line and signal line. A bullish crossover (when MACD is below the signal line) indicates a call option, while a bearish crossover (when MACD is above the signal line) suggests a put option. |
| MACDMomentum Divergence | Search for divergence between price movements and the MACD indicator. In a bullish divergence, the price hits lower lows, but the MACD records higher lows. In a bearish divergence, it's the opposite, with the price moving to higher highs while the MACD shows lower highs. |
| MACD and Other Indicators | Combine the MACD with other indicators such as the Relative Vigor Index (RVI) or the Money Flow Index (MFI) to enhance the reliability of your trading signals. Utilize MACD crossovers in conjunction with signals generated by these additional indicators. |
| MACD and Bollinger Bands | Combine the MACD indicator with Bollinger Bands for 60-second options trading, which is suitable for capitalizing on short-term price movements in the market. This strategy is particularly helpful for traders looking for quick opportunities. |
| MACD with RSI | Implement a strategy using both MACD and RSI indicators on 15-minute charts with a 60-minute expiry. For a Call option, look for the 7-day EMA to cross the 26-day EMA in a bottom-up manner, RSI to rise above 50, and the MACD line to ascend. For a Put option, wait for the 7-day EMA to cross the 26-day EMA in a top-down manner, RSI to drop below 50, and the MACD line to descend. Follow all conditions before entering a trade. Practice on a demo account first. |
Advanced trend analysis techniques
Beyond basic indicators and strategies, there lies a treasure box of advanced tools that are often used by seasoned traders. These include
Fibonacci Retracement
The famous Fibonacci sequence, a series of numbers widely recognized in both nature and trading, is based on the mathematical tool known as Fibonacci retracements. This sequence initiates with 0,1; each subsequent number represents the sum of its two preceding ones, so the sequence goes as – 0;1;1;2;3;5;8... These ratios present themselves notably within an array of natural phenomena such as seashell spirals, sunflower heads and even market price patterns.
Traders apply Fibonacci retracements to pinpoint potential support and resistance levels within a specific trend. The key ratios utilized for these retracements are – 23.6%, 38.2%, 50%; 61.8% and finally, 78.6%.
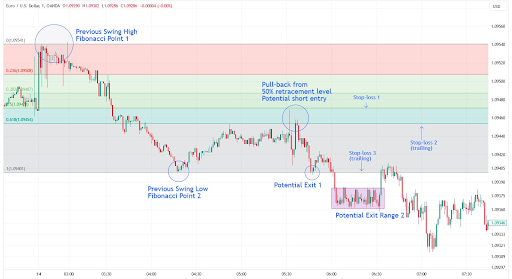
Fibonacci retracements identify critical reversal or consolidation levels during a trend. Traders select recent high and low points, draw horizontal Fibonacci levels, and view them as potential support or resistance. In an uptrend, these levels help assess trend strength by looking for price bounces or consolidations.
Example
Scenario – You are keeping an eye on the rising price of a stock. You decide to use Fibonacci retracements to identify potential entry points.
Identify High and Low Points – A high point (for example, $100) and a low point (for example, $85) are identified in a recent trend.
Draw Retracement Levels – Using the charting tool, you draw Fibonacci retracement levels based on ratios. They reach critical levels of 23.6%, 38.2%, 50%, 61.8% and 78.6%.
Analyze the trend – As the stock price continues to rise, it faces resistance near the 61.8% retracement level.
Trading Decision – This consolidation at the 61.8% retracement level could signal a potential reversal or a continuation of the uptrend. As a binary options trader, you can use this information to decide whether to place a "call" option (betting on an uptrend continuation) or a "put" option (betting on a reversal).
Elliott Wave Theory
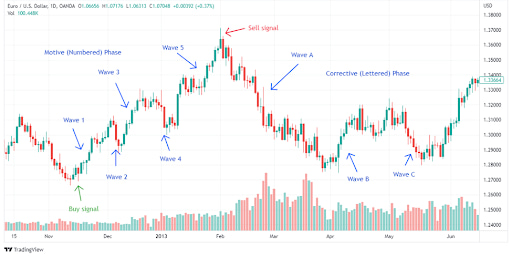
The Elliott Wave Theory is a technical tool based on the dynamics of long trends. It highlights relationships between diverse chart periods, mainly through two critical market phase classifications
Motive Phase – During this phase, the market actively trends in its primary direction; it ascends during an uptrend and descends in a downtrend.
Corrective Phase – In this phase, the market actively counters the main trend.
These phases follow specific rules, and every motive phase is followed by a corrective phase, and vice versa, creating a cyclical pattern in the market. The theory consists of different degrees of trends, from larger to smaller. Each movement, whether upwards or downwards, consists of smaller trends, with the same motive and corrective phases. These smaller trends follow the same rules as the broader trends
Elliot Wave Theory strategy and tactics
Traders can apply Elliott Wave Theory in binary options trading by following these steps
Begin the identification of the main market direction with a daily chart that will allow you to pinpoint the primary trend direction. Then through careful analysis, determine whether the market presently resides in a motive phase or corrective phase.
After identifying the primary trend, make a transition to shorter time frames for an in-depth analysis of trends within major movements that will aid traders in forecasting the direction of shorter periods.
Select a time frame for binary options trading and continue your analysis until you identify either the completion of a motive phase, or a corrective phase.
Wait for the current movement to conclude and predict the direction of the next one. Your analysis should guide you in selecting binary options such as high/low, one-touch, or ladder options.
Ending diagonal in Elliott Wave
Elliott Wave Theory can also help identify patterns like the "ending diagonal." When observed towards the end of a long-term trend, this pattern can signal a potential reversal. An ending diagonal is a formation characterized by five waves, taking on a wedge-like shape, and typically appearing at the conclusion of either an impulsive or corrective movement within the framework of Elliott Wave Theory. This pattern serves as a signal that the preceding price action has advanced rapidly and excessively, suggesting a probable upcoming reversal.
Bollinger Bands
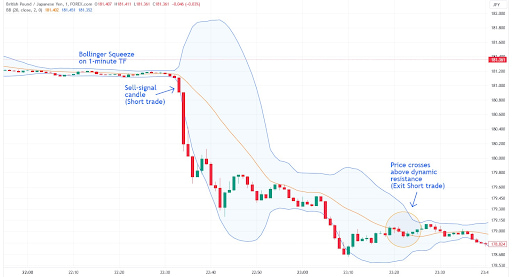
This is a useful tool for understanding the volatility of an asset’s price. It consists of bands that show how the current price relates to historical averages within a certain time period. Bollinger Bands are commonly used in binary trading to assess volatility and potential price change.
The two key elements of Bollinger Bands are
Bollinger squeezes – Squeezes show the level of volatility. When the bands are close together, it means there's low volatility, and when they are far apart, it indicates high volatility. Squeezes don't provide direct trading signals, rather they just tell you how volatile things are. However, a squeeze over a long period of time may indicate that a substantial breakout is on the horizon.
Breakouts – Breakouts occur when the asset's price moves above the upper band or below the lower band. This state is somewhat unstable, suggesting that prices might return inside the bands soon. However, once the breakout is confirmed, meaning that asset prices continue to move outside the band, it could be the beginning of substantial market move.
Understanding false breakouts
A false breakout is a situation where the market price appears to break out of a key support or resistance level but quickly reverses its direction, often trapping traders who believed they were spotting a genuine breakout. These breakouts can be misleading, causing traders to exit their positions prematurely and miss out on profits (and even register losses).
How to identify a false breakout?
Recognizing false breakouts is a crucial skill for traders. Typically, false breakouts are characterized by a brief price movement beyond a support or resistance level, followed by a swift return to the previous trend. To identify a false breakout, traders should watch for specific signs, such as candlestick closes above the support or resistance level, assessing how far the price has moved from that level in pips, and the behaviour of volume and trend indicators. As a good practice, avoid all trades where breakout is a result of low-volume trades.
What are market anomalies?
Market anomalies are irregularities or deviations from the expected behaviour of financial markets. This anomaly can disrupt trends and make trading more challenging. Traders should be aware of market anomalies that can lead to false signals, including
Market Manipulation – Large institutional traders can influence the market. They may initiate false breakouts to trigger stop-loss orders and create volatility in the market and trading opportunities for themselves.
Slow Markets – In stagnant or consolidating markets, a false breakout is more likely to occur as the market lacks a strong trend to propel it in one direction.
Sudden Price Spikes – Unexpected events or news releases can cause sudden price spikes that may look like breakouts but are often short-lived
To navigate false breakouts and market anomalies, traders can consider the following strategies and key points
Risk Management – Always use risk management tools like stop-loss orders to limit potential losses if a trade doesn’t go as per your expectation. Place your stop-loss strategically based on the significant levels that you have determined through analysis.
Confirmation – Wait for multiple confirmations, such as price action along with technical indicators, and volume, before entering a trade. This reduces the chances of falling for a false breakout.
Selecting the right entry point – After confirming a false breakout, traders must identify an appropriate entry point which should align with the overall trend, emphasizing the importance of trading in the direction of the trend. Choosing between limit orders and market orders depends on the trader's preference and risk tolerance.
Trend Analysis – Pay attention to the strength and duration of a trend. A strong, long-term trend is less likely to experience false breakouts than a sideways or weakening trend.
Stay Informed – Keep a track of economic events, news releases, and market sentiment. This information can help you anticipate sudden price spikes and market anomalies.
Best binary options brokers


Risk management for binary trading
Risk Management is a crucial aspect in trading. In the below table, experts have highlighted some key considerations for managing your risk efficiently
| Technique | Explanation |
|---|---|
| Stop-Loss Orders | Set predetermined exit points to limit losses and avoid emotional decisions during losing trades. |
| Position Sizing | Risk only a small percentage of your total capital (usually 1-2%) on a single trade to prevent account depletion. |
| Spread Your Risk | Diversify your investments across different trades or assets to balance potential losses and gains. |
| Keep an Eye on Your Trades | Continuously monitor your trades, adjust stop-loss orders, and adapt your strategy as needed for effective risk management. |
| Early closure facility | Utilize the option to close a trade before its expiration to limit losses or secure profits in volatile market conditions. |
Exploring OTM, ATM, and ITM strategies
Another key consideration is to pick if you wish to invest in binary options that are Out of the Money (OTM), At the Money (ATM), or In the Money (ITM).
OTM options have strike prices that aren't ideal for the current market, meaning they need significant price changes to make a profit.
ATM options have strike prices close to the current market price and have a balanced risk and reward.
ITM options have strike prices that favor the current market, needing minimal price changes for a higher chance of profit.
These distinctions help traders choose options that match their market expectations and risk tolerance.
In the table below, we provide a concise overview of these binary options (OTM, ATM, and ITM) to help you make informed investment decisions. For those unaware of pricing, binary options are generally priced in relation to $100, so higher the price, lower the profit on payout of $100 (higher premium), and vice versa.
| Option Type | Description |
|---|---|
| OTM (Out of the Money) | Lower upfront cost, lower probability of profit at expiration, primarily composed of time value, potential for significant gains with higher risk. Typically priced before $50. |
| ATM (At the Money) | Priced around 50% probability of profit, more liquid, balanced risk-reward profile, value primarily derived from time value, quick price changes. Typically priced around $50. |
| ITM (In the Money) | Higher cost, higher probability of profit at expiration, more liquid, slower price changes, value attributed to both time and intrinsic value, lower risk of loss. Typically priced higher than $50. |
Staying informed about market trends
To excel in binary trading, one must remain informed of market trends through keeping an eye on financial news websites – such as Bloomberg. Such platforms offer real time updates across various markets. Similarly, other tools for trend analysis are provided by trading platforms, which are equipped with real-time market data.
To effectively analyze market trends and news, traders first need to grasp the impact of a particular news or event and then keenly observe market reactions. Next step is to identify potential trend shifts. For instance, if there is a significant drop in the stock market index, this could indicate an emerging bearish trend. Traders can utilize this analysis to guide their trading decisions and consider strategies such as initiating a trade on the sell side in binary trading.
Conclusion
Trend analysis in binary options trading is highly useful, with three main trends – uptrends, downtrends, and sideways trends guiding trading decisions. Technical indicators like Moving Averages (MA) and the Moving Average Convergence Divergence (MACD) help identify these trends and their strength. Advanced techniques include Fibonacci retracements and Elliott Wave Theory.
On the caution side, recognizing market anomalies, like false breakouts, is essential and requires robust risk management. To make sound trading decisions, binary options traders can diversify between Out of the Money (OTM), At the Money (ATM), and In the Money (ITM) options based on market expectations and risk tolerance. Lastly, staying informed about market trends through news platforms and tools provided by trading platforms is key to staying ahead and making informed trading choices.
FAQs
How do you find the trend in binary options?
Finding the trend in binary options trading generally requires the use of price action analysis or knowledge of directional indicators.
Which indicator confirms the trend?
Indicators such as the Moving Average, MACD, and Average Directional Index (ADX) are known for confirming trends.
What is the best method to identify a trend?
As per most seasoned traders, the best, plain vanilla method of identifying trends is by the use of trendlines.
How do you analyze a market for binary options?
3-D charting can be highly effective in analyzing a market for binary options. It involves analyzing the price of an asset in multiple time frames to get a comprehensive idea of price movement.
Editors' Top Picks and Insights

Hunting crypto owners: Why criminals have gone offline

BitMEX is shutting down: Why Trump could not save the exchange

Do governments need crypto workers?

Brent nears $100: Why oil prices are rising

Gram Wallet launch: Can Telegram bring crypto to the masses?

AI without limits: How dangerous are neural networks?
Related Articles
Team that worked on the article
Andrey Mastykin is an experienced author, editor, and content strategist who has been with Traders Union since 2020. As an editor, he is meticulous about fact-checking and ensuring the accuracy of all information published on the Traders Union platform.
Dr. BJ Johnson is a PhD in English Language and an editor with over 15 years of experience. He earned his degree in English Language in the U.S and the UK.
Mirjan Hipolito is a journalist and news editor at Traders Union. She is an expert crypto writer with five years of experience in the financial markets.
CFD is a contract between an investor/trader and seller that demonstrates that the trader will need to pay the price difference between the current value of the asset and its value at the time of contract to the seller.
Cryptocurrency is a type of digital or virtual currency that relies on cryptography for security. Unlike traditional currencies issued by governments (fiat currencies), cryptocurrencies operate on decentralized networks, typically based on blockchain technology.
Forex leverage is a tool enabling traders to control larger positions with a relatively small amount of capital, amplifying potential profits and losses based on the chosen leverage ratio.
Forex trading, short for foreign exchange trading, is the practice of buying and selling currencies in the global foreign exchange market with the aim of profiting from fluctuations in exchange rates. Traders speculate on whether one currency will rise or fall in value relative to another currency and make trading decisions accordingly. However, beware that trading carries risks, and you can lose your whole capital.
Bollinger Bands (BBands) are a technical analysis tool that consists of three lines: a middle moving average and two outer bands that are typically set at a standard deviation away from the moving average. These bands help traders visualize potential price volatility and identify overbought or oversold conditions in the market.

-
 Afghanistan
-
 Albania
-
 Algeria
-
 Angola
-
 Argentina
-
 Armenia
-
 Australia
-
 Austria
-
 Azerbaijan
-
 Bahamas
-
 Bahrain
-
 Bangladesh
-
 Belarus
-
 Belgium
-
 Bolivia
-
 Botswana
-
 Brazil
-
 Brunei
-
 Bulgaria
-
 Cambodia
-
 Cameroon
-
 Canada
-
 Chile
Chile
-
 China
China
-
 Colombia
-
 Congo
Congo
-
 Costa Rica
-
 Cote d'Ivoire
-
 Croatia
-
 Cuba
Cuba
-
 Cyprus
-
 Czechia
-
 DR Congo
-
 Denmark
-
 Dominican Republic
-
 Ecuador
-
 Egypt
Egypt
-
 El Salvador
-
 Estonia
-
 Eswatini
-
 Ethiopia
-
 Finland
-
 France
-
 Georgia
-
 Germany
-
 Ghana
Ghana
-
 Greece
-
 Haiti
Haiti
-
 Hong Kong
-
 Hungary
-
 India
India
-
 Indonesia
-
 Iran, Islamic republic
-
 Iraq
Iraq
-
 Ireland
-
 Israel
-
 Italy
Italy
-
 Jamaica
-
 Japan
Japan
-
 Jordan
-
 Kazakhstan
-
 Kenya
Kenya
-
 Korea
Korea
-
 Kuwait
-
 Kyrgyzstan
-
 Laos
Laos
-
 Latvia
-
 Lebanon
-
 Lesotho
-
 Libya
Libya
-
 Lithuania
-
 Luxembourg
-
 Madagascar
-
 Malaysia
-
 Malta
Malta
-
 Mauritius
-
 Mexico
-
 Moldova
-
 Mongolia
-
 Montenegro
-
 Morocco
-
 Mozambique
-
 Myanmar
-
 Namibia
-
 Nepal
Nepal
-
 Netherlands
-
 New Zealand
-
 Nigeria
-
 North Macedonia
-
 Norway
-
 Oman
Oman
-
 Pakistan
-
 Palestine
-
 Panama
-
 Papua New Guinea
-
 Paraguay
-
 Peru
Peru
-
 Philippines
-
 Poland
-
 Portugal
-
 Puerto Rico
-
 Qatar
Qatar
-
 Reunion
-
 Romania
-
 Rwanda
-
 Saudi Arabia
-
 Serbia
-
 Singapore
-
 Slovakia
-
 Slovenia
-
 Somalia
-
 South Africa
-
 Spain
Spain
-
 Sri Lanka
-
 Sweden
-
 Switzerland
-
 Syria
Syria
-
 Taiwan
-
 Tajikistan
-
 Tanzania
-
 Thailand
-
 Trinidad and Tobago
-
 Tunisia
-
 Turkey
-
 UAE
UAE
-
 Uganda
-
 Ukraine
-
 United Kingdom
-
United States
-
 Uruguay
-
 Uzbekistan
-
 Venezuela
-
 Vietnam
-
 Yemen
Yemen
-
 Zambia
-
 Zimbabwe
- Forex
- Crypto
